| Sample | Run | ScientificName | SampleName | Taxon | Latitude | Longitude |
|---|---|---|---|---|---|---|
| SRS4979271 | SRR9309782 | Diplacus longiflorus | LON-T33_1 | ssp. longiflorus | 34.3438 | -118.5099 |
| SRS4979267 | SRR9309785 | Diplacus longiflorus | LON-T8_8 | ssp. longiflorus | 34.1347 | -118.6452 |
| SRS4979269 | SRR9309784 | Erythranthe parviflora | PAR-KK161 | ssp. parviflorus | 34.0180 | -119.6730 |
| SRS4979266 | SRR9309787 | Erythranthe parviflora | PAR-KK168 | ssp. parviflorus | 34.0180 | -119.6730 |
| SRS4979268 | SRR9309786 | Erythranthe parviflora | PAR-KK180 | ssp. parviflorus | 34.0180 | -119.6730 |
| SRS4979265 | SRR9309789 | Erythranthe parviflora | PAR-KK182 | ssp. parviflorus | 34.0193 | -119.6802 |
Monkeyflowers dataset
Speciation genomics and simulation
The monkeyflower model system
Monkeyflowers (Mimulus) have recently become a key model in evolution and plant biology (Pennisi, 2019). The monkeyflower system consists of 160–200 species that display an amazing phenotypic variation. The genome is small, only 207Mbp, which makes it an ideal candidate for genomics - and for computer exercises!
The monkeyflower genomic landscape
Recently, Stankowski et al. (2019) used the monkeyflower system to investigate what forces affect the genomic landscape. Burri (2017) has suggested that background selection (BGS) is one of the main causes for correlations between genomic landscapes, and that one way to study this phenomenon is to look at closely related taxa. This is one of the objectives of the Stankowski et al. (2019) paper.
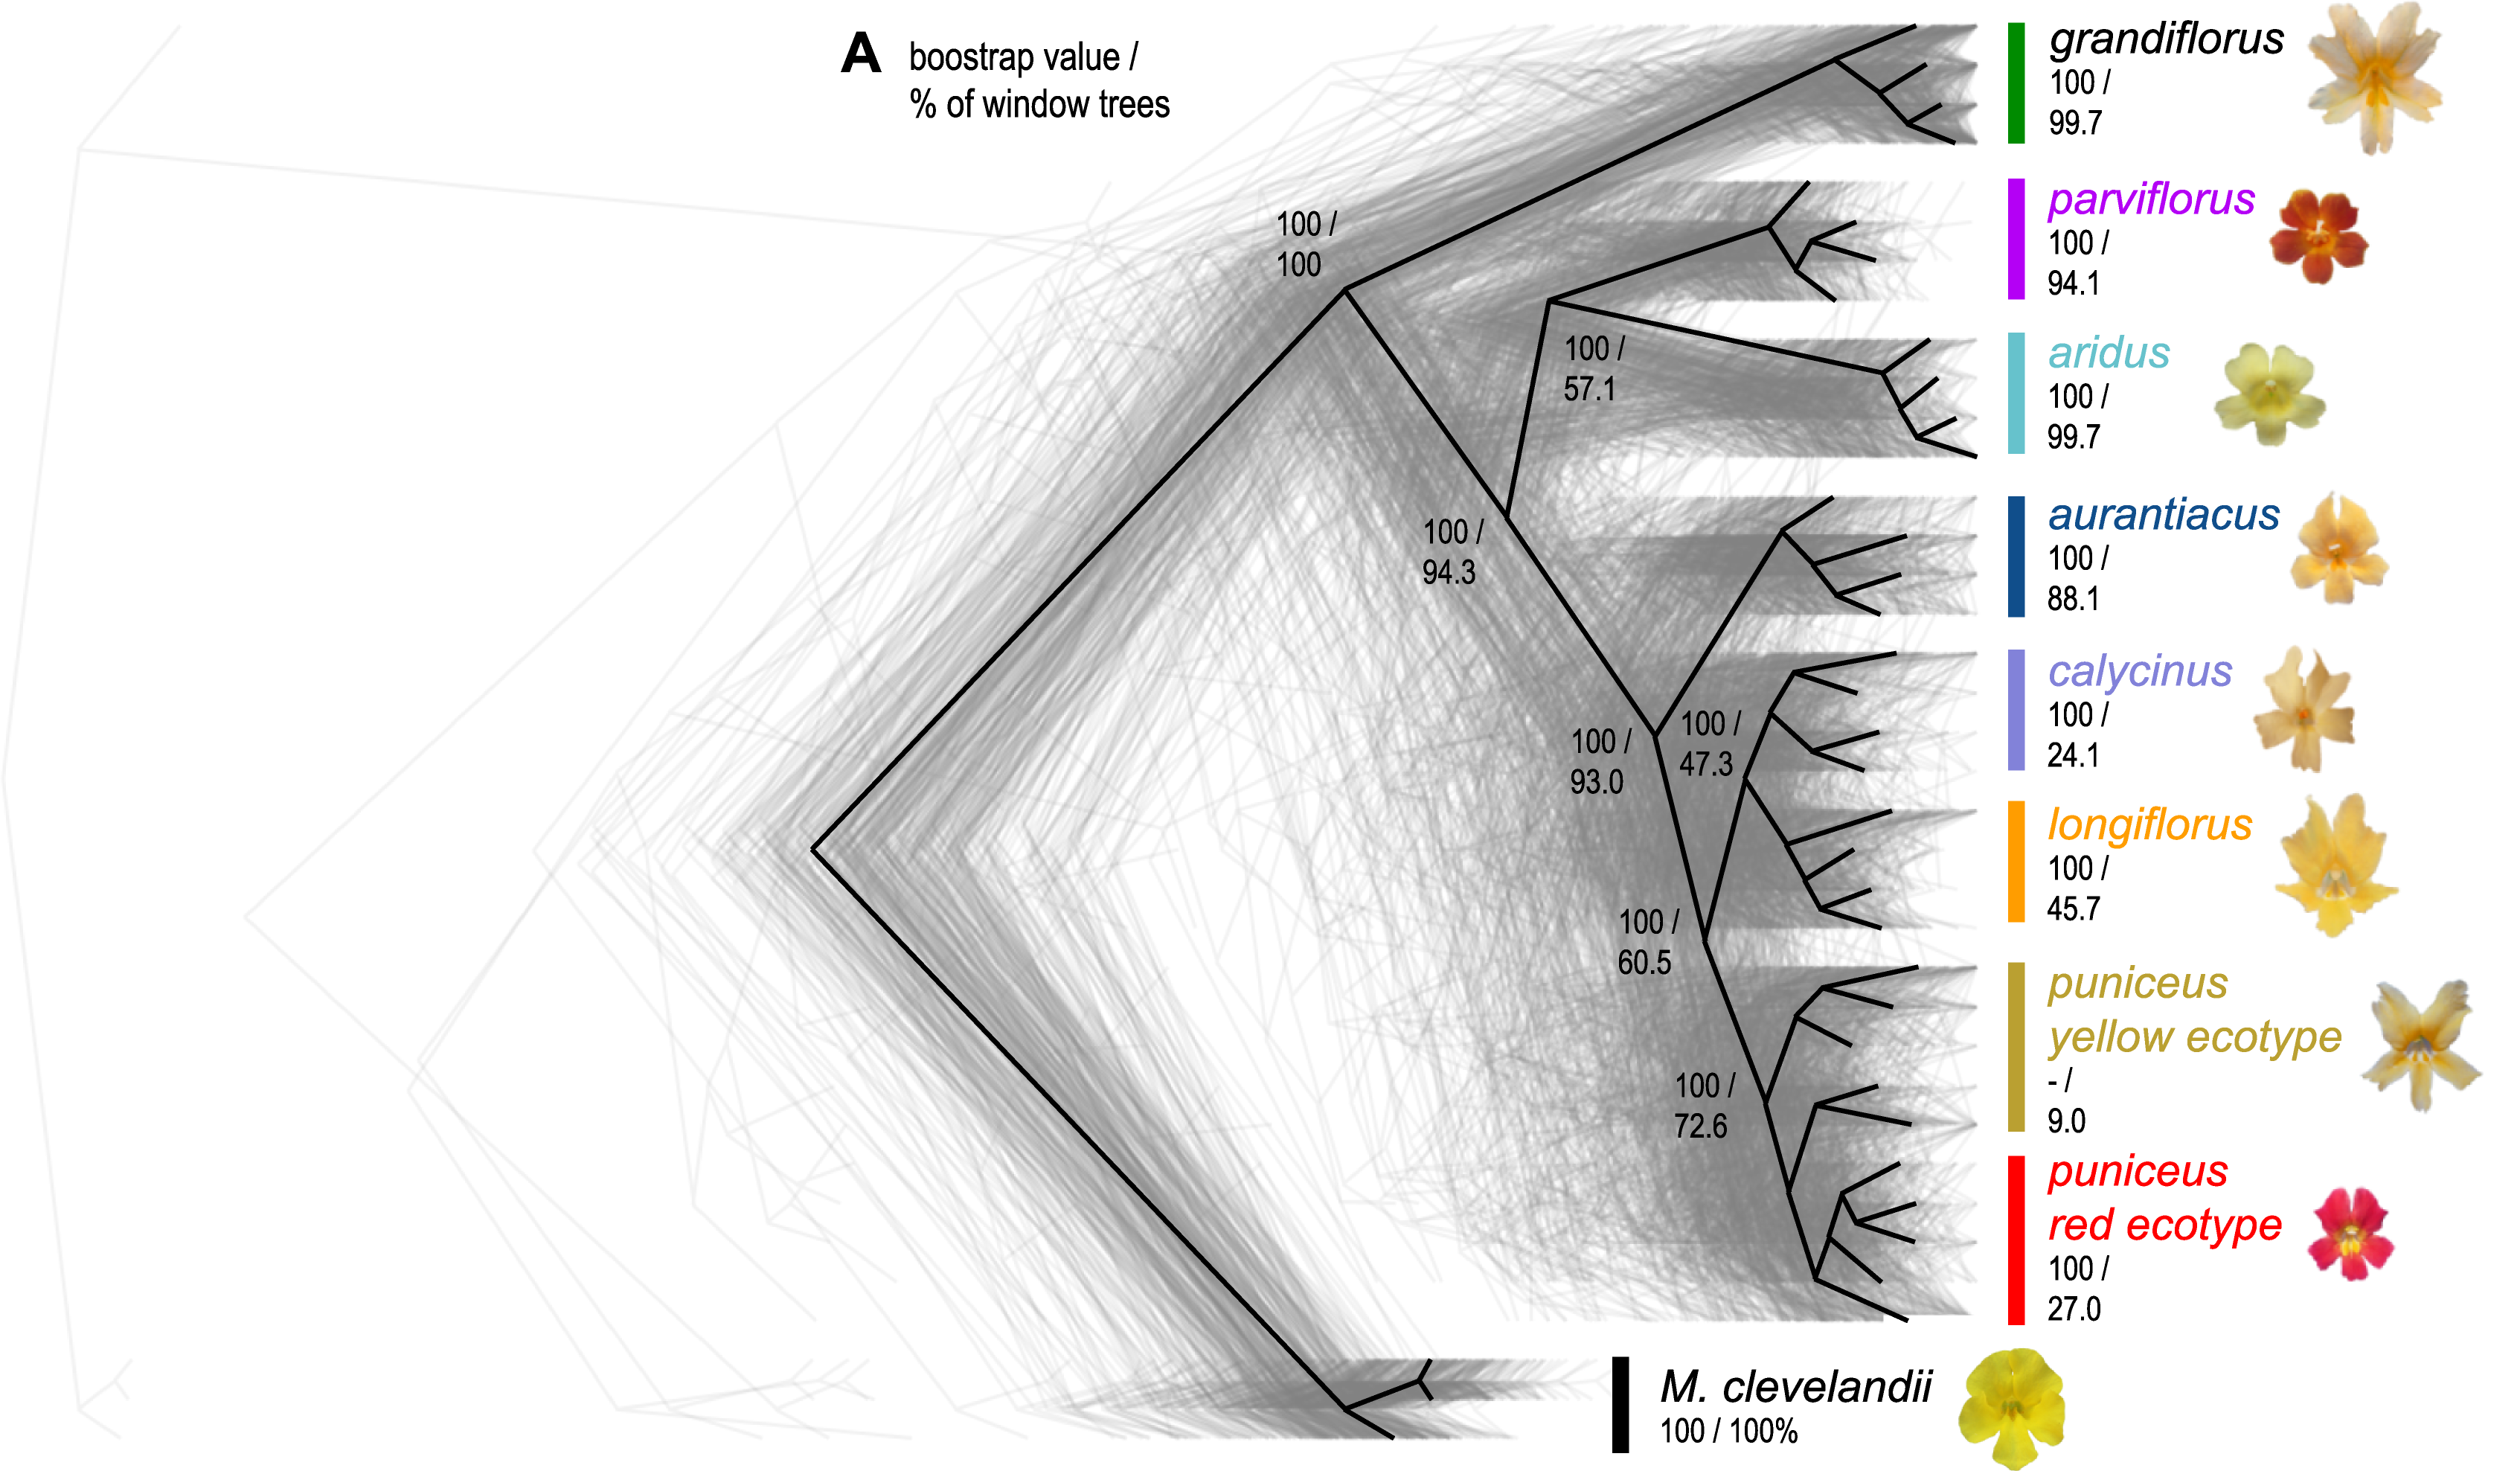
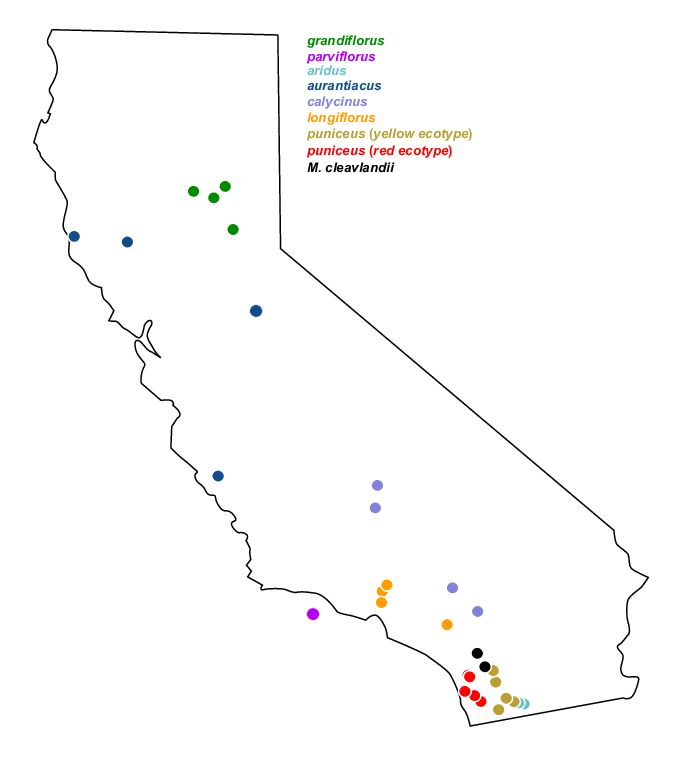
They performed whole-genome resequencing of 37 individuals from 7 subspecies and 2 ecotypes of Mimulus aurantiacus and its sister taxon M. clevelandii (Figure 1), all sampled in California (Figure 2).
Genomewide statistics, such as diversity (\(\pi\)), divergence (\(d_{XY}\)) and differentiation \(F_{ST}\), were calculated within and between taxa to generate genomic diversity landscapes. The landscapes were highly similar across taxa, and local variation in genomic features, such as gene density and recombination rate, was predictive of variation in landscape patterns. These features suggest the influence of selection, in particular BGS.
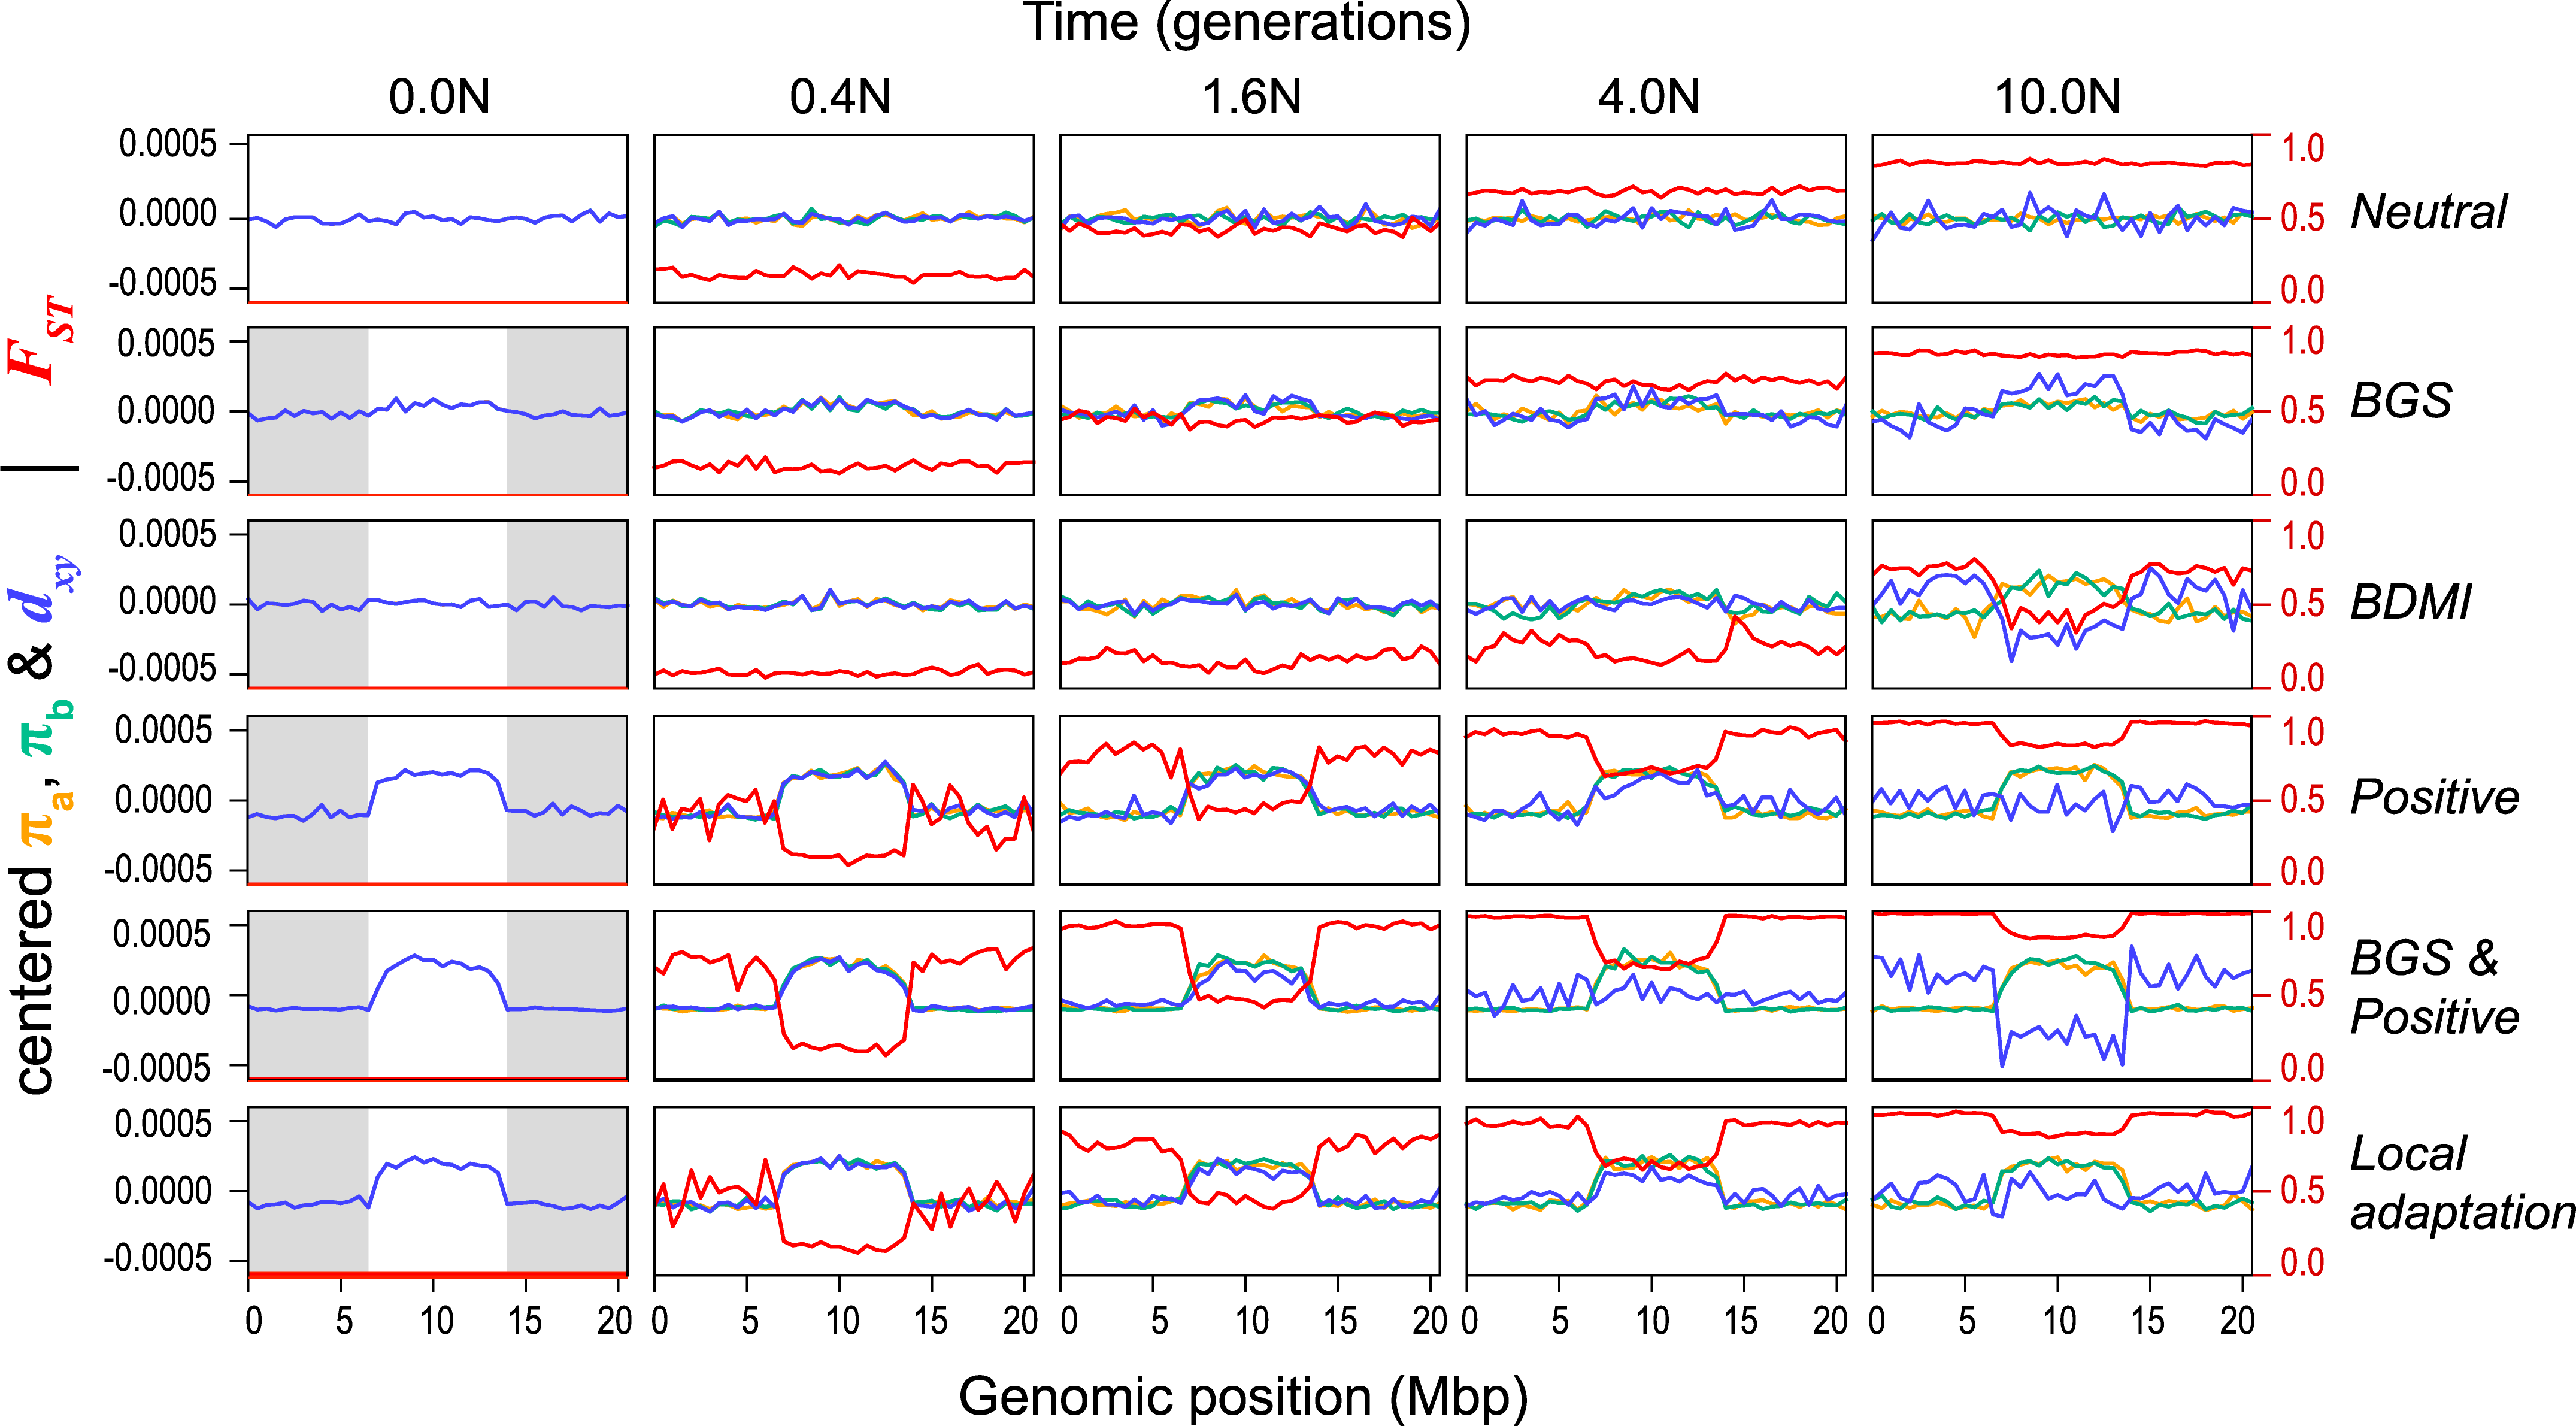
Although many characteristics were predicted by a model where BGS is one of the main causes, there were deviations. Therefore, the authors performed simulations in SLiM (Haller & Messer, 2019) with alternative models to see whether other factors could explain the observed patterns.
In all, six scenarios were studied:
- neutral evolution
- BGS (non-neutral mutations are deleterious)
- Bateson-Dobzhansky-Muller incompatibility (BDMI); after split, a fraction variants deleterious in one population, neutral in other
- positive selection
- BGS and positive selection
- local adaptation; as 4 but also after split some variants are beneficial in one population, neutral in other
Figure 3 shows typical results of the simulations.
In conclusion, the authors found that although BGS plays a role, it does not sufficiently explain all observations, and that other aspects of natural selection (such as rapid adaptation) are responsible for the similarities between genomic landscapes.
A locus that previously had been associated with differentiation of red and yellow ecotypes was investigated in more detail. The locus is located on linkage group 4 (LG4), and we will be using both a 3Mbp region of interest (ROI) surronding the locus, and the whole linkage group, for different exercises.
Data
The dataset consists of 37 samples (see Table 1 for example information). Raw sequence reads were downloaded from Sequence Read Archive (SRA), bioproject PRJNA549183 and mapped to the reference sequence M_aurantiacus_v1_splitline_ordered.fasta. Reads that mapped to the ROI were extracted and constitute the sequence data that will be used during the exercises.
UPPMAX data storage
The monkeyflower dataset is located in UPPMAX project naiss2023-22-1084 at /proj/naiss2023-22-1084/webexport/monkeyflower. In addition to local access, data can be accessed remotely through https://export.uppmax.uu.se/naiss2023-22-1084.
Github
The github repository pgip-data contains reference sequence and read data for 37 monkeyflower individuals for the region LG4:12,000,000-12,100,000. The data resides in the data/monkeyflower/tiny subdirectory. This data set is used as input data to render the website.
The repository hosts a Snakemake workflow to generate all data needed for the exercises.


