Code
data(fat, package = "faraway")Data for exercises are on Canvas under Files -> data_exercises –> linear-models
Exercise 1 (Brozek score) Researchers collected age, weight, height and 10 body circumference measurements for 252 men in an attempt to find an alternative way of calculate body fat as oppose to measuring someone weight and volume, the latter one by submerging in a water tank. Is it possible to predict body fat using easy-to-record measurements?
Use lm() function and fit a linear method to model brozek, score estimate of percent body fat
To access and preview the data:
data(fat, package = "faraway")Solution. Exercise 1
# access and preview data
data(fat, package = "faraway")
head(fat)
##   brozek siri density age weight height adipos  free neck chest abdom   hip
## 1   12.6 12.3  1.0708  23 154.25  67.75   23.7 134.9 36.2  93.1  85.2  94.5
## 2    6.9  6.1  1.0853  22 173.25  72.25   23.4 161.3 38.5  93.6  83.0  98.7
## 3   24.6 25.3  1.0414  22 154.00  66.25   24.7 116.0 34.0  95.8  87.9  99.2
## 4   10.9 10.4  1.0751  26 184.75  72.25   24.9 164.7 37.4 101.8  86.4 101.2
## 5   27.8 28.7  1.0340  24 184.25  71.25   25.6 133.1 34.4  97.3 100.0 101.9
## 6   20.6 20.9  1.0502  24 210.25  74.75   26.5 167.0 39.0 104.5  94.4 107.8
##   thigh knee ankle biceps forearm wrist
## 1  59.0 37.3  21.9   32.0    27.4  17.1
## 2  58.7 37.3  23.4   30.5    28.9  18.2
## 3  59.6 38.9  24.0   28.8    25.2  16.6
## 4  60.1 37.3  22.8   32.4    29.4  18.2
## 5  63.2 42.2  24.0   32.2    27.7  17.7
## 6  66.0 42.0  25.6   35.7    30.6  18.8

# fit linear regression model
model.all <- lm(brozek ~ age + weight + height + neck + abdom + hip + thigh + knee + ankle + biceps + forearm + wrist, data = fat)

# print model summary
print(summary(model.all))
##
## Call:
## lm(formula = brozek ~ age + weight + height + neck + abdom +
##     hip + thigh + knee + ankle + biceps + forearm + wrist, data = fat)
##
## Residuals:
##      Min       1Q   Median       3Q      Max
## -10.2664  -2.5658  -0.0798   2.8976   9.3204
##
## Coefficients:
##               Estimate Std. Error t value Pr(>|t|)
## (Intercept) -17.063433  14.489336  -1.178  0.24011
## age           0.056520   0.029888   1.891  0.05983 .
## weight       -0.085513   0.045170  -1.893  0.05954 .
## height       -0.059703   0.086695  -0.689  0.49171
## neck         -0.439315   0.214802  -2.045  0.04193 *
## abdom         0.875779   0.070589  12.407  < 2e-16 ***
## hip          -0.192118   0.132655  -1.448  0.14885
## thigh         0.237304   0.131793   1.801  0.07303 .
## knee         -0.006595   0.222832  -0.030  0.97642
## ankle         0.164831   0.204681   0.805  0.42144
## biceps        0.149530   0.157693   0.948  0.34397
## forearm       0.424885   0.182801   2.324  0.02095 *
## wrist        -1.474317   0.494475  -2.982  0.00316 **
## ---
## Signif. codes:  0 '***' 0.001 '**' 0.01 '*' 0.05 '.' 0.1 ' ' 1
##
## Residual standard error: 3.98 on 239 degrees of freedom
## Multiple R-squared:  0.7489, Adjusted R-squared:  0.7363
## F-statistic:  59.4 on 12 and 239 DF,  p-value: < 2.2e-16

# diagnostics plots
par(mfrow=c(2,2))
plot(model.all)

# remove potentially influential observations
obs <- c(86)
fat2 <- fat[-obs, ]

# re-fit the model
model.clean <- lm(brozek ~ age + weight + height + neck + abdom + hip + thigh + knee + ankle + biceps + forearm + wrist, data = fat)

# diagnostics plots
par(mfrow=c(2,2))
plot(model.clean)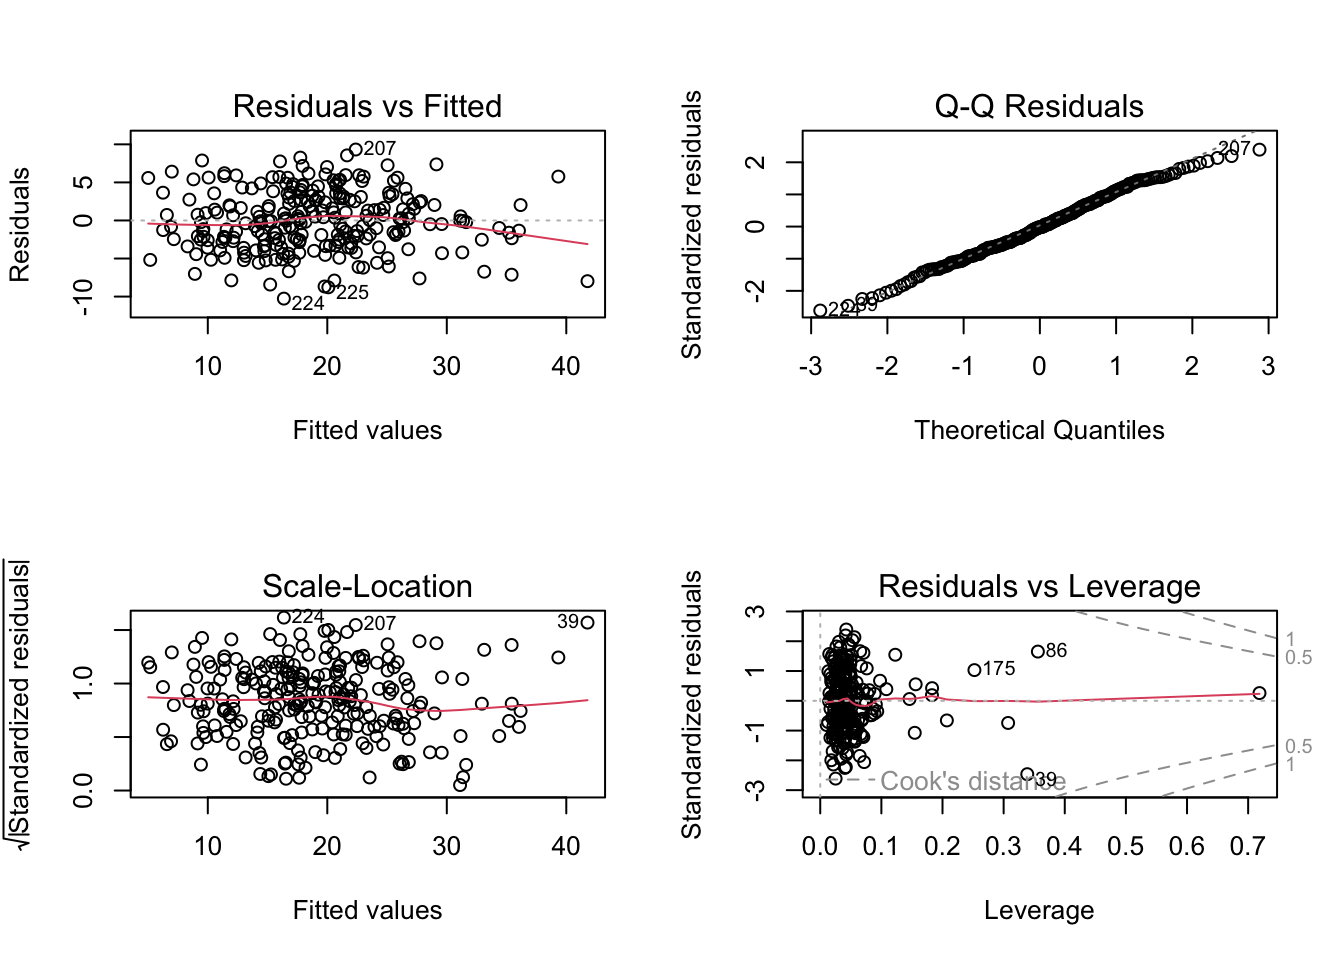
# model summary
print(summary(model.clean))
##
## Call:
## lm(formula = brozek ~ age + weight + height + neck + abdom +
##     hip + thigh + knee + ankle + biceps + forearm + wrist, data = fat)
##
## Residuals:
##      Min       1Q   Median       3Q      Max
## -10.2664  -2.5658  -0.0798   2.8976   9.3204
##
## Coefficients:
##               Estimate Std. Error t value Pr(>|t|)
## (Intercept) -17.063433  14.489336  -1.178  0.24011
## age           0.056520   0.029888   1.891  0.05983 .
## weight       -0.085513   0.045170  -1.893  0.05954 .
## height       -0.059703   0.086695  -0.689  0.49171
## neck         -0.439315   0.214802  -2.045  0.04193 *
## abdom         0.875779   0.070589  12.407  < 2e-16 ***
## hip          -0.192118   0.132655  -1.448  0.14885
## thigh         0.237304   0.131793   1.801  0.07303 .
## knee         -0.006595   0.222832  -0.030  0.97642
## ankle         0.164831   0.204681   0.805  0.42144
## biceps        0.149530   0.157693   0.948  0.34397
## forearm       0.424885   0.182801   2.324  0.02095 *
## wrist        -1.474317   0.494475  -2.982  0.00316 **
## ---
## Signif. codes:  0 '***' 0.001 '**' 0.01 '*' 0.05 '.' 0.1 ' ' 1
##
## Residual standard error: 3.98 on 239 degrees of freedom
## Multiple R-squared:  0.7489, Adjusted R-squared:  0.7363
## F-statistic:  59.4 on 12 and 239 DF,  p-value: < 2.2e-16

# re-fit the model (no height)
model.red1 <- lm(brozek ~ age + weight + neck + abdom + hip + thigh + knee + ankle + biceps + forearm + wrist, data = fat)
print(summary(model.red1))
##
## Call:
## lm(formula = brozek ~ age + weight + neck + abdom + hip + thigh +
##     knee + ankle + biceps + forearm + wrist, data = fat)
##
## Residuals:
##      Min       1Q   Median       3Q      Max
## -10.2830  -2.6162  -0.1017   2.8789   9.3713
##
## Coefficients:
##              Estimate Std. Error t value Pr(>|t|)
## (Intercept) -22.66569   11.97691  -1.892  0.05963 .
## age           0.05948    0.02954   2.013  0.04521 *
## weight       -0.09829    0.04114  -2.389  0.01765 *
## neck         -0.43444    0.21445  -2.026  0.04389 *
## abdom         0.88762    0.06839  12.979  < 2e-16 ***
## hip          -0.17180    0.12919  -1.330  0.18483
## thigh         0.25327    0.12960   1.954  0.05183 .
## knee         -0.02318    0.22128  -0.105  0.91665
## ankle         0.17300    0.20411   0.848  0.39752
## biceps        0.15695    0.15715   0.999  0.31894
## forearm       0.43091    0.18239   2.363  0.01895 *
## wrist        -1.51011    0.49120  -3.074  0.00235 **
## ---
## Signif. codes:  0 '***' 0.001 '**' 0.01 '*' 0.05 '.' 0.1 ' ' 1
##
## Residual standard error: 3.976 on 240 degrees of freedom
## Multiple R-squared:  0.7484, Adjusted R-squared:  0.7369
## F-statistic:  64.9 on 11 and 240 DF,  p-value: < 2.2e-16

# re-fit the model (no knee)
model.red2 <- lm(brozek ~ age + weight + neck + abdom + hip + thigh + ankle + biceps + forearm + wrist, data = fat)
print(summary(model.red2))
##
## Call:
## lm(formula = brozek ~ age + weight + neck + abdom + hip + thigh +
##     ankle + biceps + forearm + wrist, data = fat)
##
## Residuals:
##      Min       1Q   Median       3Q      Max
## -10.2552  -2.5979  -0.1133   2.8693   9.3584
##
## Coefficients:
##              Estimate Std. Error t value Pr(>|t|)
## (Intercept) -23.08716   11.25781  -2.051  0.04137 *
## age           0.05875    0.02864   2.051  0.04134 *
## weight       -0.09965    0.03897  -2.557  0.01117 *
## neck         -0.43088    0.21131  -2.039  0.04253 *
## abdom         0.88875    0.06740  13.186  < 2e-16 ***
## hip          -0.17231    0.12884  -1.337  0.18234
## thigh         0.24942    0.12403   2.011  0.04544 *
## ankle         0.16946    0.20089   0.844  0.39974
## biceps        0.15847    0.15616   1.015  0.31123
## forearm       0.42946    0.18150   2.366  0.01876 *
## wrist        -1.51470    0.48823  -3.102  0.00215 **
## ---
## Signif. codes:  0 '***' 0.001 '**' 0.01 '*' 0.05 '.' 0.1 ' ' 1
##
## Residual standard error: 3.968 on 241 degrees of freedom
## Multiple R-squared:  0.7484, Adjusted R-squared:  0.738
## F-statistic: 71.69 on 10 and 241 DF,  p-value: < 2.2e-16

# re-fit the model (no ankle)
model.red3 <- lm(brozek ~ age + weight + neck + abdom + hip + thigh  + biceps + forearm + wrist, data = fat)
print(summary(model.red3))
##
## Call:
## lm(formula = brozek ~ age + weight + neck + abdom + hip + thigh +
##     biceps + forearm + wrist, data = fat)
##
## Residuals:
##      Min       1Q   Median       3Q      Max
## -10.0740  -2.5615  -0.1021   2.7999   9.3199
##
## Coefficients:
##              Estimate Std. Error t value Pr(>|t|)
## (Intercept) -20.61247   10.86240  -1.898   0.0589 .
## age           0.05727    0.02857   2.004   0.0461 *
## weight       -0.09141    0.03770  -2.424   0.0161 *
## neck         -0.45458    0.20931  -2.172   0.0308 *
## abdom         0.88098    0.06673  13.203   <2e-16 ***
## hip          -0.17575    0.12870  -1.366   0.1733
## thigh         0.25504    0.12378   2.061   0.0404 *
## biceps        0.15178    0.15587   0.974   0.3311
## forearm       0.42805    0.18138   2.360   0.0191 *
## wrist        -1.40948    0.47175  -2.988   0.0031 **
## ---
## Signif. codes:  0 '***' 0.001 '**' 0.01 '*' 0.05 '.' 0.1 ' ' 1
##
## Residual standard error: 3.965 on 242 degrees of freedom
## Multiple R-squared:  0.7477, Adjusted R-squared:  0.7383
## F-statistic: 79.67 on 9 and 242 DF,  p-value: < 2.2e-16

# re-fit the model (no biceps)
model.red4 <- lm(brozek ~ age + weight + neck + abdom + hip + thigh  + forearm + wrist, data = fat)
print(summary(model.red4))
##
## Call:
## lm(formula = brozek ~ age + weight + neck + abdom + hip + thigh +
##     forearm + wrist, data = fat)
##
## Residuals:
##      Min       1Q   Median       3Q      Max
## -10.0574  -2.7411  -0.1912   2.6929   9.4977
##
## Coefficients:
##              Estimate Std. Error t value Pr(>|t|)
## (Intercept) -20.06213   10.84654  -1.850  0.06558 .
## age           0.05922    0.02850   2.078  0.03876 *
## weight       -0.08414    0.03695  -2.277  0.02366 *
## neck         -0.43189    0.20799  -2.077  0.03889 *
## abdom         0.87721    0.06661  13.170  < 2e-16 ***
## hip          -0.18641    0.12821  -1.454  0.14727
## thigh         0.28644    0.11949   2.397  0.01727 *
## forearm       0.48255    0.17251   2.797  0.00557 **
## wrist        -1.40487    0.47167  -2.978  0.00319 **
## ---
## Signif. codes:  0 '***' 0.001 '**' 0.01 '*' 0.05 '.' 0.1 ' ' 1
##
## Residual standard error: 3.965 on 243 degrees of freedom
## Multiple R-squared:  0.7467, Adjusted R-squared:  0.7383
## F-statistic: 89.53 on 8 and 243 DF,  p-value: < 2.2e-16

# re-fit the model (no hip)
model.red5 <- lm(brozek ~ age + weight + neck + abdom  + thigh  + forearm + wrist, data = fat)
print(summary(model.red5))
##
## Call:
## lm(formula = brozek ~ age + weight + neck + abdom + thigh + forearm +
##     wrist, data = fat)
##
## Residuals:
##      Min       1Q   Median       3Q      Max
## -10.0193  -2.8016  -0.1234   2.9387   9.0019
##
## Coefficients:
##              Estimate Std. Error t value Pr(>|t|)
## (Intercept) -30.17420    8.34200  -3.617 0.000362 ***
## age           0.06149    0.02852   2.156 0.032047 *
## weight       -0.11236    0.03151  -3.565 0.000437 ***
## neck         -0.37203    0.20434  -1.821 0.069876 .
## abdom         0.85152    0.06437  13.229  < 2e-16 ***
## thigh         0.20973    0.10745   1.952 0.052099 .
## forearm       0.51824    0.17115   3.028 0.002726 **
## wrist        -1.40081    0.47274  -2.963 0.003346 **
## ---
## Signif. codes:  0 '***' 0.001 '**' 0.01 '*' 0.05 '.' 0.1 ' ' 1
##
## Residual standard error: 3.974 on 244 degrees of freedom
## Multiple R-squared:  0.7445, Adjusted R-squared:  0.7371
## F-statistic: 101.6 on 7 and 244 DF,  p-value: < 2.2e-16

# compare model.clean and final model
print(summary(model.clean))
##
## Call:
## lm(formula = brozek ~ age + weight + height + neck + abdom +
##     hip + thigh + knee + ankle + biceps + forearm + wrist, data = fat)
##
## Residuals:
##      Min       1Q   Median       3Q      Max
## -10.2664  -2.5658  -0.0798   2.8976   9.3204
##
## Coefficients:
##               Estimate Std. Error t value Pr(>|t|)
## (Intercept) -17.063433  14.489336  -1.178  0.24011
## age           0.056520   0.029888   1.891  0.05983 .
## weight       -0.085513   0.045170  -1.893  0.05954 .
## height       -0.059703   0.086695  -0.689  0.49171
## neck         -0.439315   0.214802  -2.045  0.04193 *
## abdom         0.875779   0.070589  12.407  < 2e-16 ***
## hip          -0.192118   0.132655  -1.448  0.14885
## thigh         0.237304   0.131793   1.801  0.07303 .
## knee         -0.006595   0.222832  -0.030  0.97642
## ankle         0.164831   0.204681   0.805  0.42144
## biceps        0.149530   0.157693   0.948  0.34397
## forearm       0.424885   0.182801   2.324  0.02095 *
## wrist        -1.474317   0.494475  -2.982  0.00316 **
## ---
## Signif. codes:  0 '***' 0.001 '**' 0.01 '*' 0.05 '.' 0.1 ' ' 1
##
## Residual standard error: 3.98 on 239 degrees of freedom
## Multiple R-squared:  0.7489, Adjusted R-squared:  0.7363
## F-statistic:  59.4 on 12 and 239 DF,  p-value: < 2.2e-16
print(summary(model.red5))
##
## Call:
## lm(formula = brozek ~ age + weight + neck + abdom + thigh + forearm +
##     wrist, data = fat)
##
## Residuals:
##      Min       1Q   Median       3Q      Max
## -10.0193  -2.8016  -0.1234   2.9387   9.0019
##
## Coefficients:
##              Estimate Std. Error t value Pr(>|t|)
## (Intercept) -30.17420    8.34200  -3.617 0.000362 ***
## age           0.06149    0.02852   2.156 0.032047 *
## weight       -0.11236    0.03151  -3.565 0.000437 ***
## neck         -0.37203    0.20434  -1.821 0.069876 .
## abdom         0.85152    0.06437  13.229  < 2e-16 ***
## thigh         0.20973    0.10745   1.952 0.052099 .
## forearm       0.51824    0.17115   3.028 0.002726 **
## wrist        -1.40081    0.47274  -2.963 0.003346 **
## ---
## Signif. codes:  0 '***' 0.001 '**' 0.01 '*' 0.05 '.' 0.1 ' ' 1
##
## Residual standard error: 3.974 on 244 degrees of freedom
## Multiple R-squared:  0.7445, Adjusted R-squared:  0.7371
## F-statistic: 101.6 on 7 and 244 DF,  p-value: < 2.2e-16
Note: we have just run a very simple feature selection using stepwise regression. In this method, using backward elimination, we build a model containing all the variables and remove them one by one based on defined criteria (here we have used p-values) and we stop when we have a justifiable model or when removing a predictor does not change the chosen criterion significantly.