 Spatial Transcriptomics
- Alma Andersson, KTH Royal Institute of Technology, Stockholm, 🇸🇪 Sweden
- Åsa Björklund, National Bioinformatics Infrastructure (NBIS), 🇸🇪 Sweden
Background
Spatial transcriptomics (ST) allows for visualization and quantitative analysis of gene expression in tissue sections. There is a multitude of recent methods for ST, but here we will focus on data from the Visium platform.
Spatial transcriptomics data generated with the Visium platform is in many ways similar to single cell transcriptomics (SC). It contains UMI counts from about 5-20 cells per spot (spatial capture location) instead of single cells, meaning that the expression profile of a spot represents a mix of transcripts originating from all cells contributing to said spot. Despite several cells contributing to each spot, ST data - just as SC data - is still quite sparse. The major difference between SC and Visum data, aside from the latter not operating at single cell resolution, is that each observation (spot) has spatial information associated with it, i.e., we know where in the tissue the captured transcripts come from.
As mentioned, there are far more spatial transcriptomics techniques than just Visium, and new ones are continuously published, hence it's fair to say that this is a rapidly evolving field. Simultaneous to this introduction of new experimental techniques, we've seen a surge in new computational tools and methods for analysis of ST data. In this course we aim to make you familiar with a few of them.
Useful links
- Tutorials for analysis of ST data and integration with SC data using Seurat, Scran or Squidpy.
- Museum of Spatial Transcriptomics Extensive overview and lists of tools for Spatial transcriptomics.
- OSTA Orchestrating Spatially Resolved Transcriptomics Analysis with Bioconductor
Project topics
Each task will be done in a group of four students, but many of the steps involves testing different tools or different analysis parameters. So we suggest that you subdivide the tasks within your group as you see fit.
In both projects we will work with Visium mouse brain sections, but each group will be focusing on different objectives.
Topic 1: Analysis of multiple visium datasets
In this project you will work with mouse brain sections from Kleshchevnikov et al. which can be downloaded
here
or using wget:
wget https://cell2location.cog.sanger.ac.uk/tutorial/mouse_brain_visium_wo_cloupe_data.zip
alternatively curl :
curl https://cell2location.cog.sanger.ac.uk/tutorial/mouse_brain_visium_wo_cloupe_data.zip -O mouse_brain_visium_wo_cloupe_data.zip
Topic 2: Annotating celltypes in visium data using single cell data
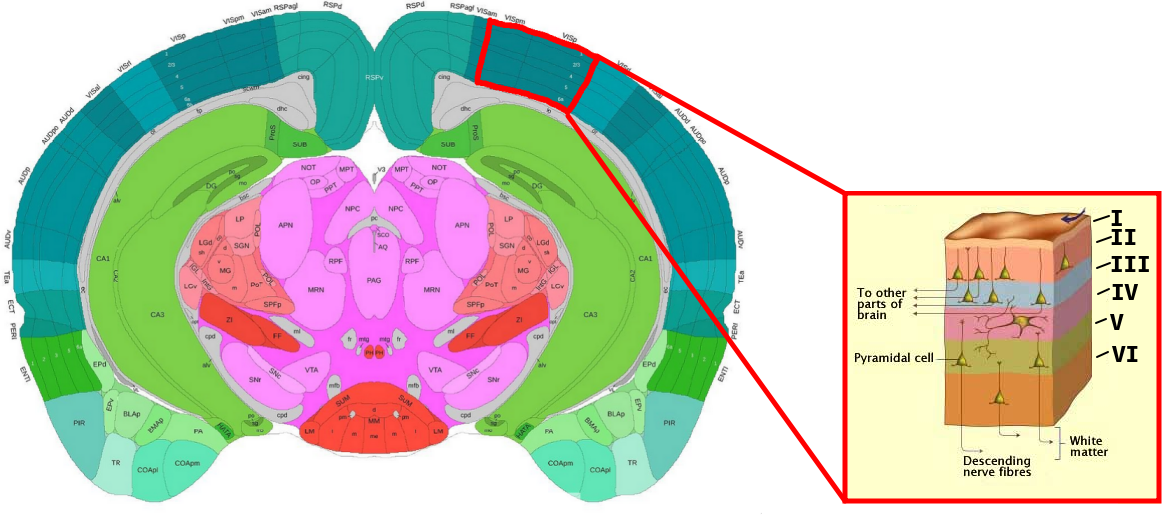
In this project you will focus on the integration of single cell data with spatial data from the primary visual cortex (VISp) region, a well-studied part of the cortex. What makes this structure interesting to study from a spatial perspective is that it exhibits a form of layering where different types of neurons are arranged in six laminar layers (Layer I to VI), see image below:
If your are unfamiliar with the mouse brain or just want some guidance when orienting your tissues, we highly recommend the Allen Brain Atlas' interactive reference, which you may find here.
The single cell data we'll be using was originally published by Tasic et al. and can be accessed
here. In order
to save you some time, we've generated a "ready-to-use" h5ad file for you, containing both the count and meta data,
which you can download here. If you are interested, the script we used to
create this h5ad file is located in scripts/sc_make_h5ad.py. h5ad files can
easily be loaded in python using the anndata or scanpy packages, there's
also support for these files in R for example using the readH5AD function
from the zellkonverter package.
Practical information
We have provided conda recipies for some of the most common tools that you may want to use in the projects in this folder
If you are not familiar with conda, please have a look at the
Precourse_material. There are separate environments for R and
python, where we suggest you use whatever language you feel most comfortable
with; please note that you do not have to limit yourself to one language per
group, in fact it's a good exercise to try to coordinate data and results
between different suites and languages.
Please refer to our Tips and tricks where we try to list common issues with some of the most common tools.