
Main Page
Schedule
Pre-course
Travel Info
FAQ
Theme: orderedlist
Quantification of spliced and unspliced counts
If you just want to infer trajectories, the ‘regular’ quantification of single-cell data, which produces a single count matrix, is sufficient. This changes however once you want to get RNA velocity information as well, because for this we need to quantify the number of reads that map to introns vs exons for each gene and cell. Classical pipelines, e.g. Cell Ranger, will typically ignore reads that are mapped to introns, or don’t distinguish between intronic and exonic reads. Most often, if we mapped against the whole trancriptome, the right information is still present in the alignment (BAM file), and we just need to rerun the quantification step
I will briefly discuss two pipelines to get RNA velocity information here. One is the classical pipeline which can work with any BAM file, the other is a recent pipeline that is much faster by using pseudoalignments.
velocyto
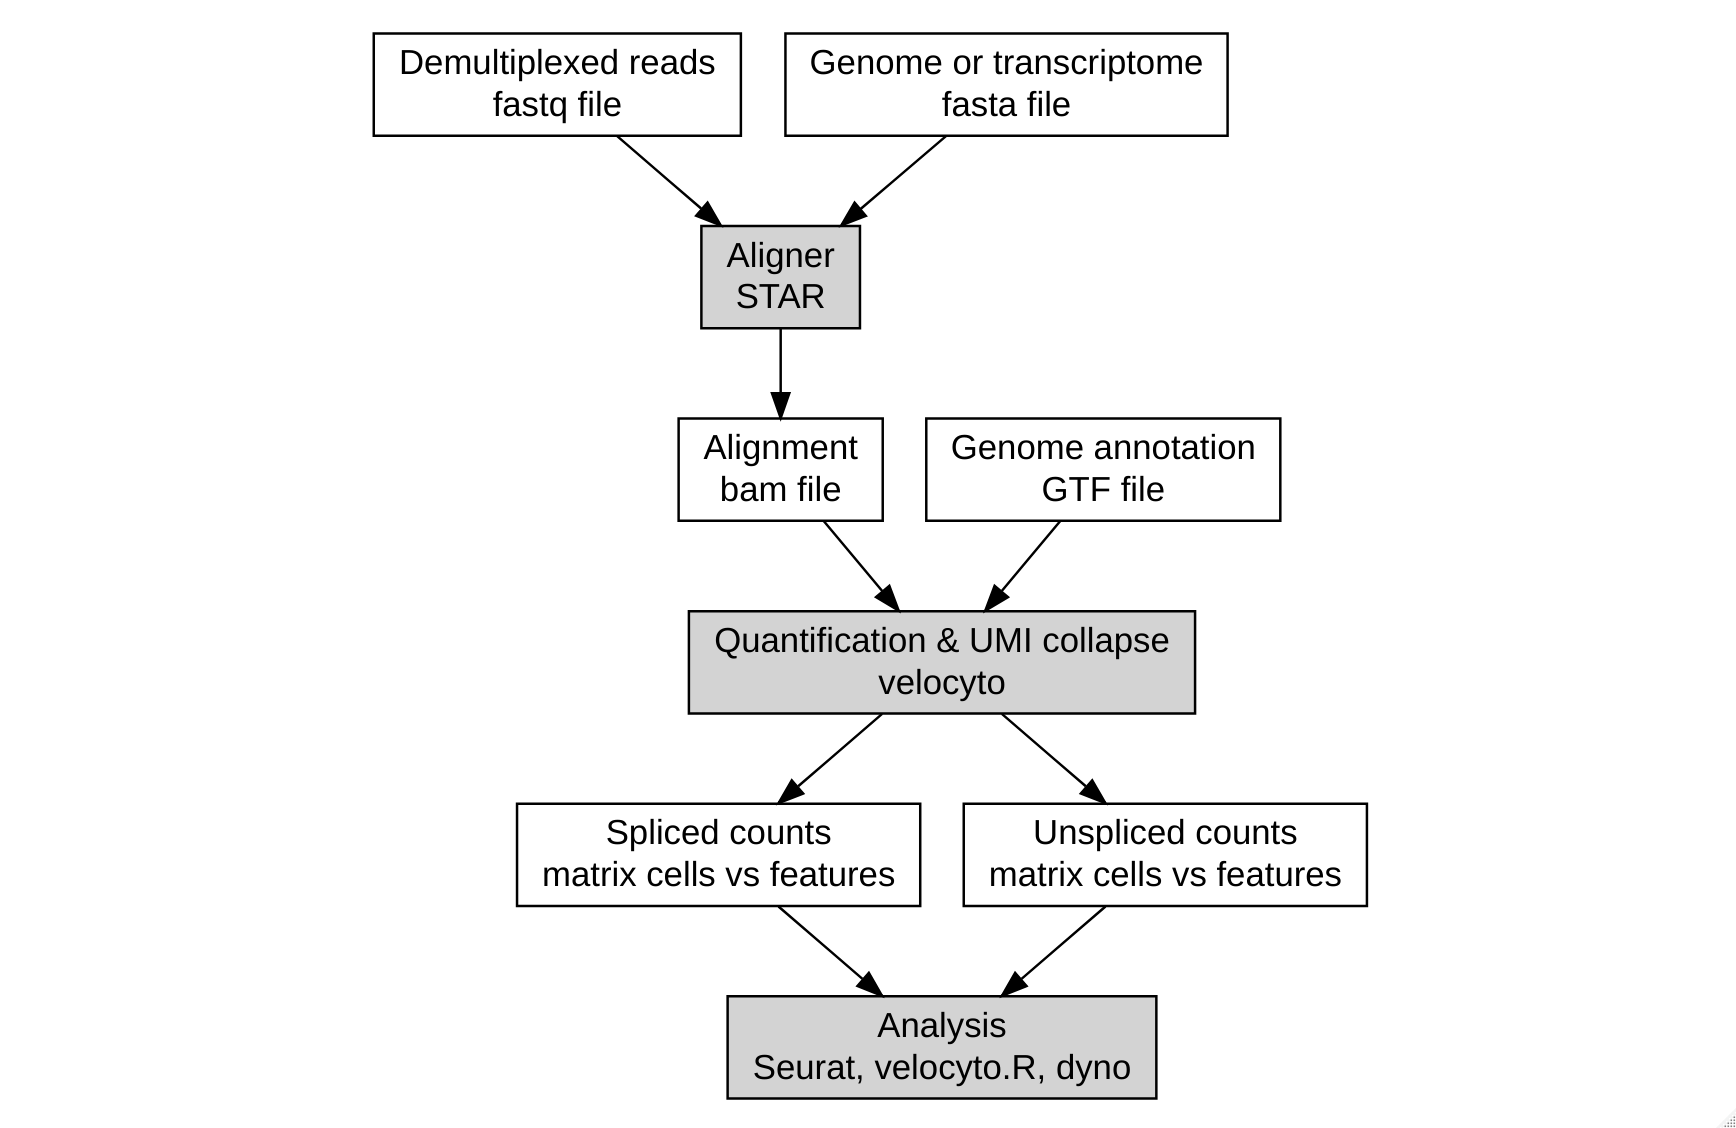
The velocyto pipeline was developed by the creators (Gioele La Manno, now at EPFL). It works with a python command line tool, and can be used with most analysis pipelines as long as you have an alignment (bam file) and genome annotation (gtf file). It also provides some helper functions for the most popular single-cell technologies. A typical (simplified) workflow looks like this:
The pipeline is well documented at http://velocyto.org/velocyto.py/tutorial/cli.html#cli
In our experience, the velocyto pipeline can take quite a while (3 hours for 5 million reads), and consume quite a bit of memory (10 GB at best). Of course, mileage may vary.
BUStools
The BUStools pipeline is more recent, and was developed to make pseudoalignment tools useful for single-cell analysis. The central piece is kallisto, a pseudoaligner first developed for bulk RNA-seq (See http://tinyheero.github.io/2015/09/02/pseudoalignments-kallisto.html for a down-to-earth description). Pseudoalignment is much faster then exact alignment, but with a (claimed) negligible decrease in accuracy (Bray et al. 2016; Patro et al. 2017).
Central to a pseudo-aligner such as kallisto is the generation of an index based on k-mers and De Bruijn graphs. The generation of this index can take some time and memory, but can be reused between analyses. Often, only the exome is used to generate this index.
Using pseudo-aligners for single-cell analyses can be tricky because of the correct handling of UMIs. You need to keep track for every read to which gene(s) it aligned, and to which UMI this read belongs. After pseudo-alignment, the different reads of the same UMI need to be collapsed to get a single count for this UMI. For this reason (and others), the BUS format was developed, which maps cell barcodes, UMIs and a set of transcripts (Melsted, Ntranos, and Pachter n.d.). In essence, the BUS file is an alternative to the BAM file, but contains less information (e.g. we don’t know to where exactly a read was mapped), but is much faster to generate.

To use BUStools for RNA velocity, we need to generate an index which contains both introns and exons. This is the most time-consuming and memory intensive part of the whole pipeline, using over 50GB during more than an hour. Once you have the index, the rest of the process is pretty straightforward. This is nicely described in the following tutorial: https://bustools.github.io/BUS_notebooks_R/velocity.html.
Dataset for this workshop
For this workshop, I ran the kallisto/BUStools quantification pipeline using a nextflow workflow (available on request), for which the output files can be downloaded at https://drive.google.com/open?id=1eYDUry72RmQTz1t56DpXVUgkd7oEDaoq
Unzip this into the data folder (i.e. data/adipose_differentiation-merick/…) and you’re good to go! The dataset contains adipocyte progenitors and was generated using 10X single-cell 3’ v2 chemistry (Merrick et al. 2019).
Some (open) issues
RNA velocity analysis is still relatively new, and it is expected that the analysis pipeline will be refined a bit in the future. Here are some common issues to ponder about.
What with reads that overlap an intron-exon junction?
Most tools will label these as ‘unspliced’ reads.
What with alternative splicing? I.e. an exon might actually be an intron for some transcripts
These are assigned ambiguous by most tools (BUStools and velocyto) and will be discarded for downstream analyses.
I use a 3’ technology (e.g. 10X), how can I have intronic reads?!
A considerable number of reads come from “secondary priming”, even when oligo-dT primers are used, as described in the original RNA velocity paper (Manno et al. 2018).
In some organisms (Arabidopsis as an example) the number of intronic reads can be quite low, which makes RNA velocity analysis nearly impossible. One reason may be that introns are relatively short in Arabidopsis.