Making reports with 
26-Jan-2026

Quarto connects code with results

Quarto connects code with results
---
title: "There's something about penguins"
author: "John Doe, Joan Doe, Dyon Do"
date: today
format: html
---

# Palmer penguins

```{r Penguin figure}
#| fig-width: 10
#| fig-height: 5
library("ggplot2")
library("palmerpenguins")
data(penguins, package = "palmerpenguins")
ggplot(penguins, aes(x      = bill_length_mm,
                     y      = body_mass_g,
                     colour = species)) +
    geom_point(size = 2) +
    theme_bw() +
    labs(x      = "Bill length (mm)",
         y      = "Body mass (g)",
         colour = "Species") +
    scale_colour_manual(values = c("#c1dea0", "#85be42", "#425f21"))
```
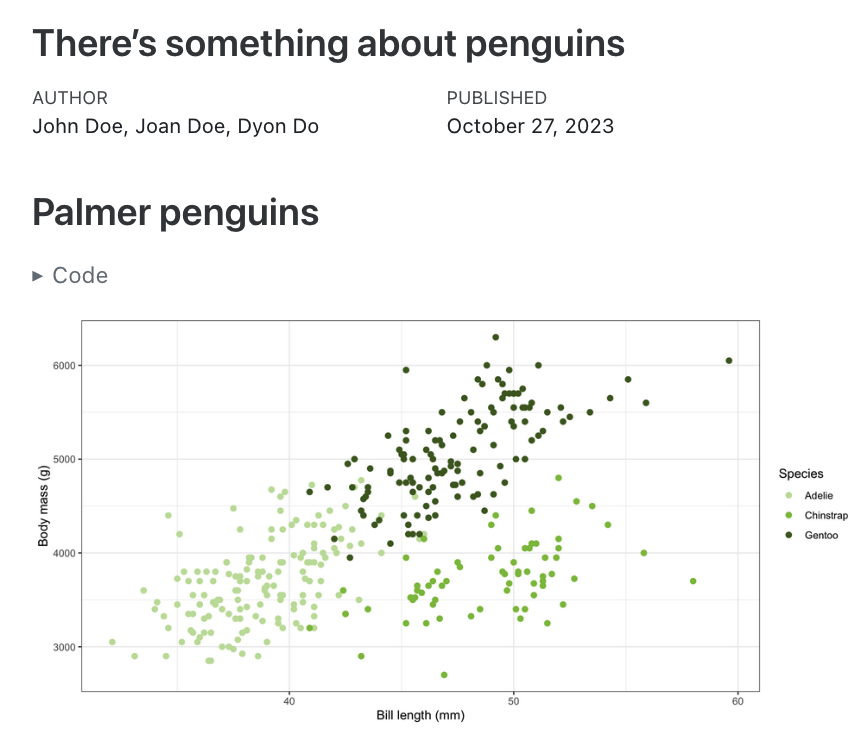
Quarto connects code with results
---
title: "There's something about penguins"
author: "John Doe, Joan Doe, Dyon Do"
date: today
format: html
---

# Palmer penguins

```{r Penguin figure}
#| fig-width: 10
#| fig-height: 5
library("ggplot2")
library("palmerpenguins")
data(penguins, package = "palmerpenguins")
ggplot(penguins, aes(x      = bill_length_mm,
                     y      = body_mass_g,
                     colour = species)) +
    geom_point(size = 2) +
    theme_bw() +
    labs(x      = "Bill length (mm)",
         y      = "Body mass (g)",
         colour = "Species") +
    scale_colour_manual(values = c("#c1dea0", "#85be42", "#425f21"))
```
A YAML header:
- Defines document-wide options
- Specifies the output format
- Can include several parameters
Markdown text:
- Freely add and format text using markdown
Code chunks:
- Evaluate code and show its output
- Specify global and/or local chunk options (e.g. figure dimensions)
- Also works with other languages (e.g. Python)
Rendering Quarto documents
Many IDEs like VS Code and RStudio also have buttons to render Quarto documents.
Output formats
- Reports and general documents (HTML, PDF, Jupyter Notebook, Microsoft Word)
- Presentations (reveal.js, PowerPoint, Beamer)
- Interactive documents (Observable, R Shiny)
- Books, blogs and websites (the entire course website is done with Quarto)
- Journal articles
- Your own custom formats
Presentations with Quarto
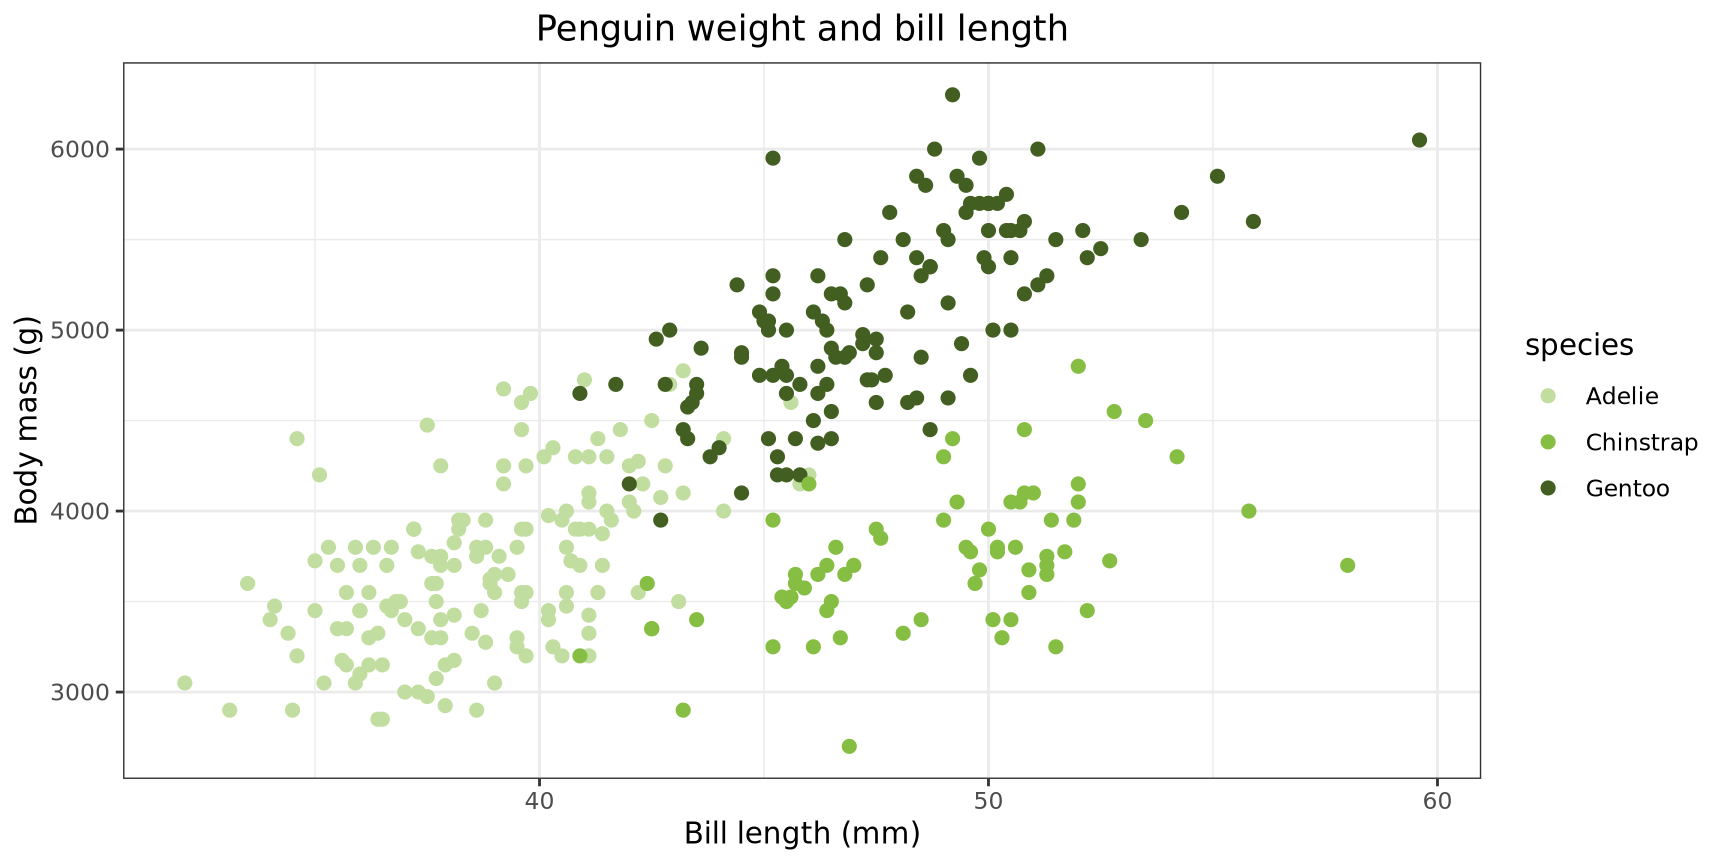
library("ggplot2")
library("palmerpenguins")
data(penguins, package = "palmerpenguins")
ggplot(penguins, aes(x      = bill_length_mm,
                     y      = body_mass_g,
                     colour = species)) +
    geom_point(size = 2) +
    theme_bw() +
    labs(x = "Bill length (mm)",
         y = "Body mass (g)") +
    ggtitle("Penguin weight and bill length") +
    theme(plot.title = element_text(hjust = 0.5)) +
    scale_colour_manual(values = c("#c1dea0",
                                   "#85be42",
                                   "#425f21"))
Quarto vs. R Markdown
- Quarto is a command line tool
- Quarto \(\thickapprox\) R Markdown 2.0
- Quarto is language-agnostic (does not depend on R)
- Quarto has all functionality built-in (you don’t need to install another package to create e.g. presentations)
- The Quarto format is similar to R Markdown
- Quarto can render R Markdown documents
- R Markdown will continue to be supported, but Quarto is the focus of new functionality and major development

