Bulk RNASeq Analysis
Roy Francis / Dag Ahrén
29-Nov-2024
What is RNA?
- The transcriptome is spatially and temporally dynamic
- Data comes from functional units (coding regions)
- Only a tiny fraction of the genome
Applications
- Identify gene sequences in genomes (annotation)
- Learn about gene function
- Differential gene expression
- Explore isoform and allelic expression
- Understand co-expression, pathways and networks
- Gene fusion
- RNA editing
Workflow
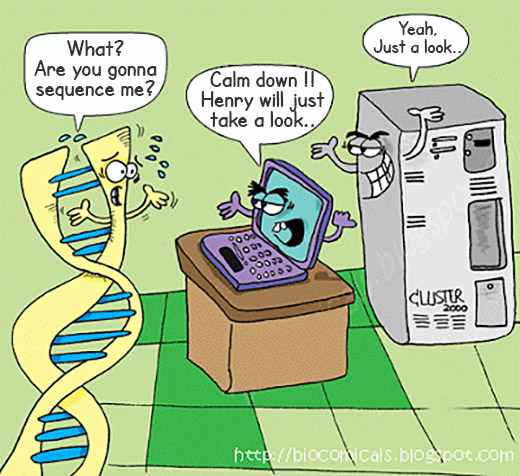
Conesa et al. (2016)
De-Novo assembly
- When no reference genome available
- To identify novel genes/transcripts/isoforms
- Identify fusion genes
- Assemble transcriptome from short reads
- Access quality of assembly and refine
- Map reads back to assembled transcriptome
Experimental design
- Biological replicates: 6 - 12 Schurch et al. (2016)
- Sample size estimation Hart et al. (2013)
- Power analysis rnaseq-power web app, Zhao et al. (2018)
- Balanced design to avoid batch effects
- RIN values have strong effect Gallego Romero et al. (2014)
Library & Sequencing
- polyA selection / Ribosomal RNA depletion
- Single-end / Paired-end
Library prep
- 80% of the RNA in a cell is ribosomal RNA (rRNA)
- rRNA can be eliminated using polyA selection or rRNA depletion
- PolyA selection mostly captures only protein-coding genes / mRNA but gives cleaner results
- Depletion of rRNA is the solution if it’s important to retain all RNA species
- smallRNAs are purified through size selection
- PCR amplification may be needed for low quantity input (See section PCR duplicates)
- Use stranded (directional) libraries Zhao et al. (2015), Levin et al. (2010)
- Accurately identify sense/antisense transcript
- Resolve overlapping genes
- Exome capture
- Library normalisation to concentrate specific transcripts
- Libraries should have high complexity / low duplication. Daley & Smith (2013)
Sequencing
- Short reads vs long reads (Illumina/PacBio)
- Read length Chhangawala et al. (2015)
- Greater than 50bp does not improve DGE
- Longer reads are better for isoforms
- Pooling samples
- Sequencing depth (Coverage / Reads per sample)
- Single-end reads (Cheaper?)
- Use paired-end reads
- Increased mappable reads
- Increased power in assemblies
- Better for structural variation and isoforms
- Decreased false-positives for DGE
- More replicates are better than more depth Liu et al. (2014)
Corley et al. (2017)
Workflow • DGE
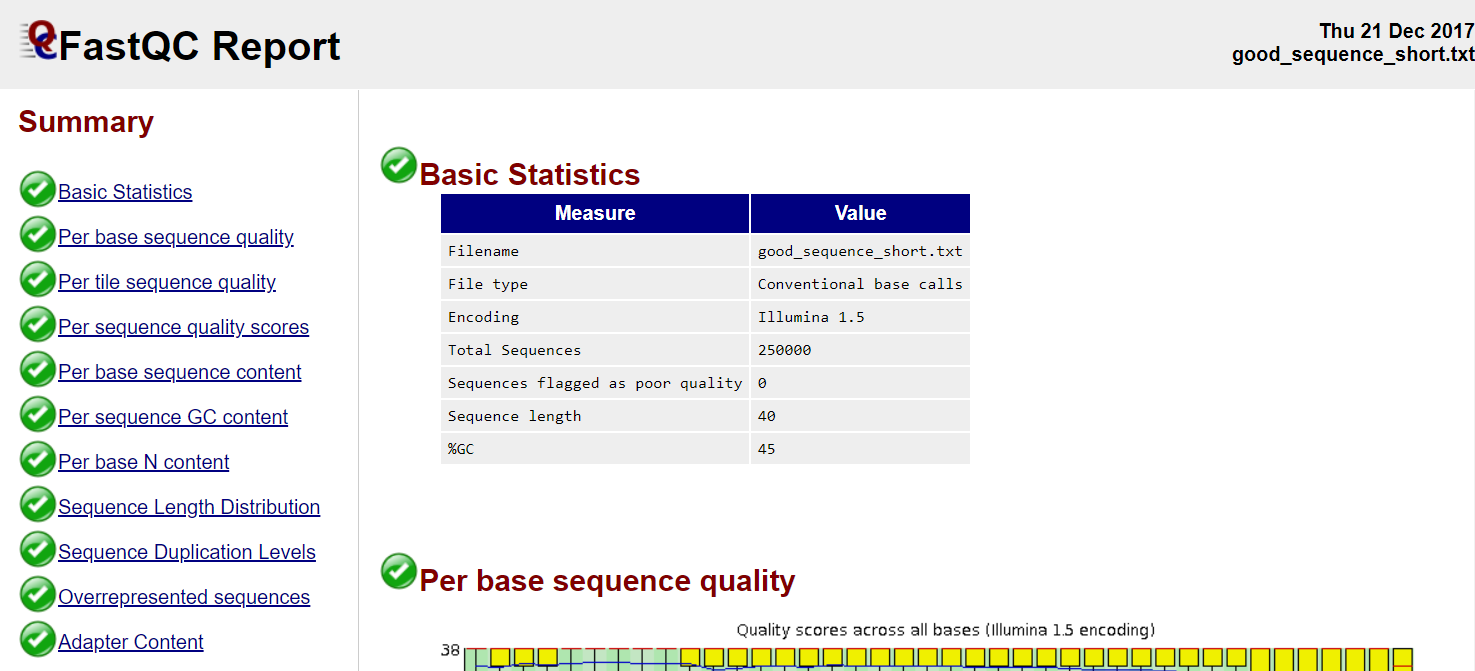
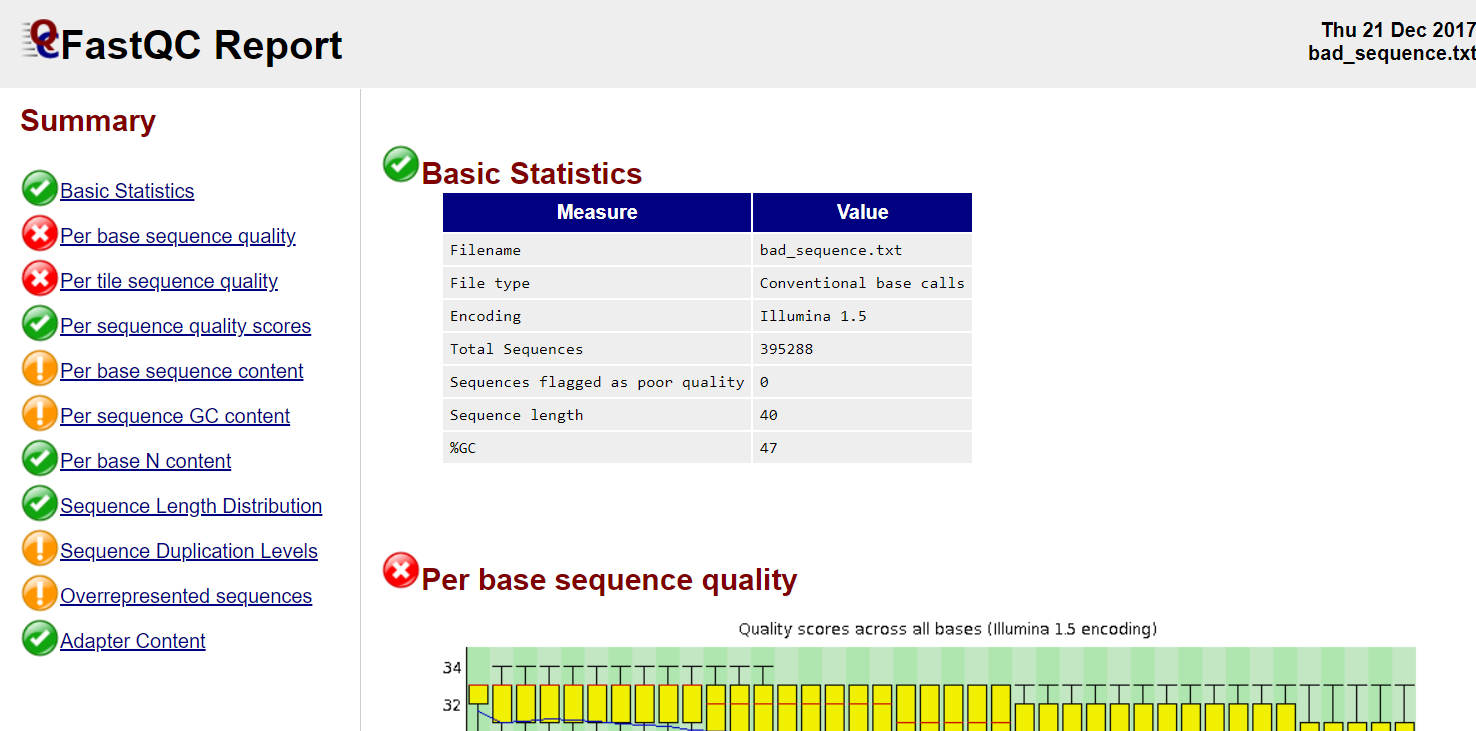
Read QC
- Number of reads
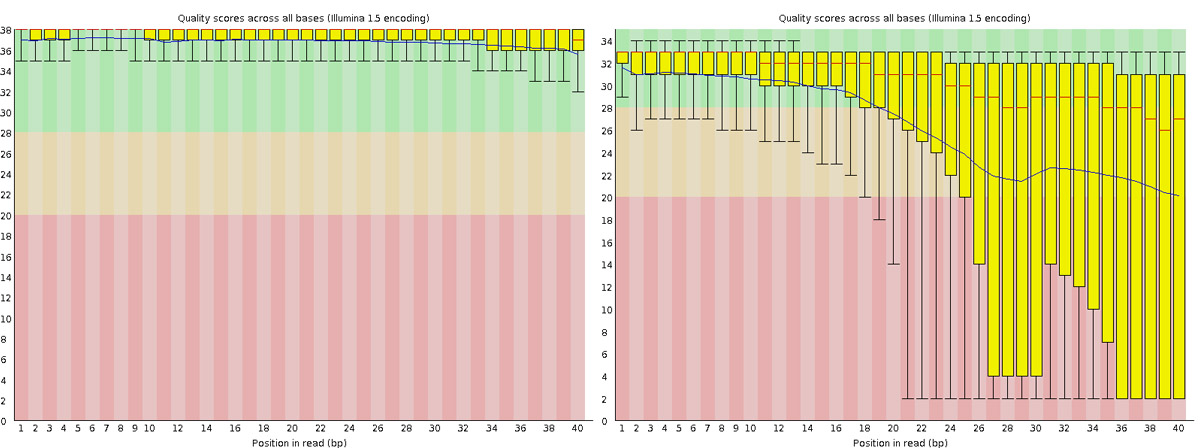
- Per base sequence quality
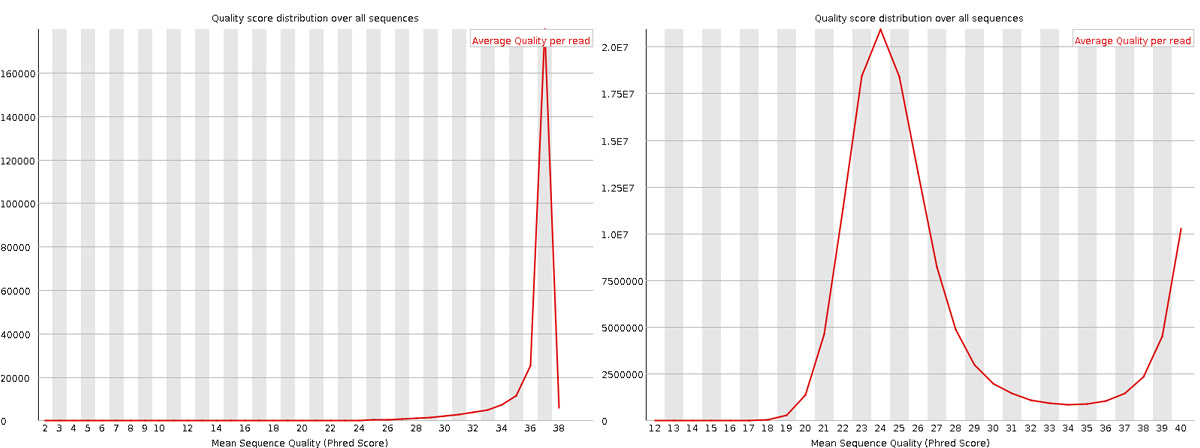
- Per sequence quality score
- Per base sequence content
- Per sequence GC content
- Per base N content
- Sequence length distribution
- Sequence duplication levels
- Overrepresented sequences
- Adapter content
- Kmer content
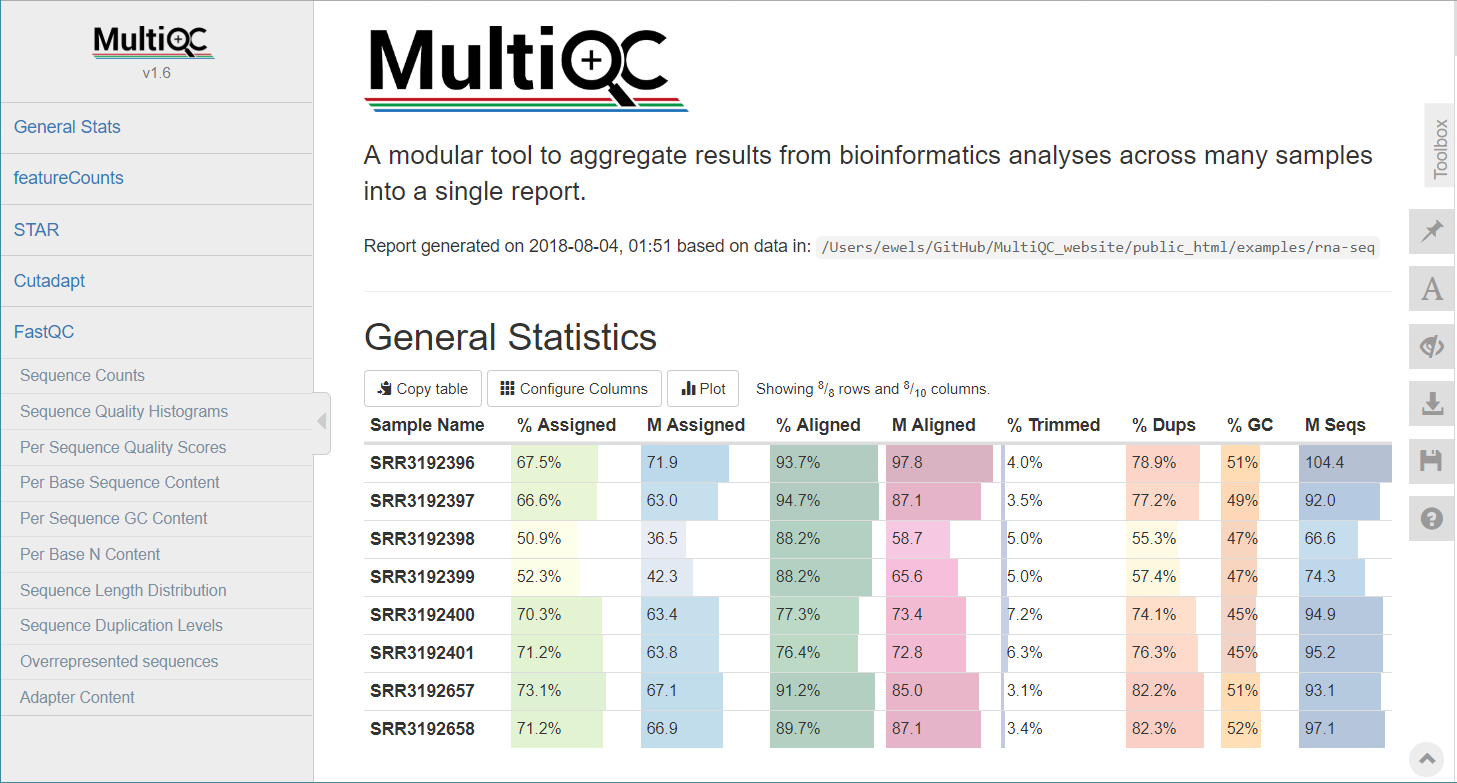
FastQC, MultiQC, https://sequencing.qcfail.com/


FastQC
Read QC • PBSQ, PSQS
Per base sequence quality
Per sequence quality scores
Trimming
- Trimming reads to remove adapter/readthrough or low quality bases
- Related options are hard clipping, filtering reads
- Sliding window trimming
- Filter by min/max read length
- Remove reads less than ~18nt
- Demultiplexing/Splitting
When to avoid trimming?
- Read trimming may not always be necessary Liao & Shi (2020)
- Fixed read length may sometimes be more important
- Expected insert size distribution may be more important for assemblers
Mapping
- Aligning reads back to a reference sequence
- Mapping to genome vs transcriptome
- Splice-aware alignment (genome) (STAR, HISAT2 etc)
Aligners • Metrics
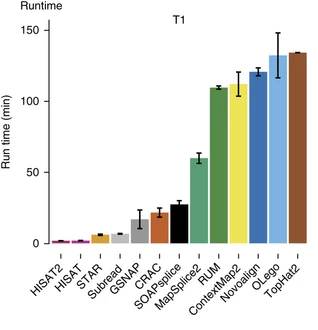
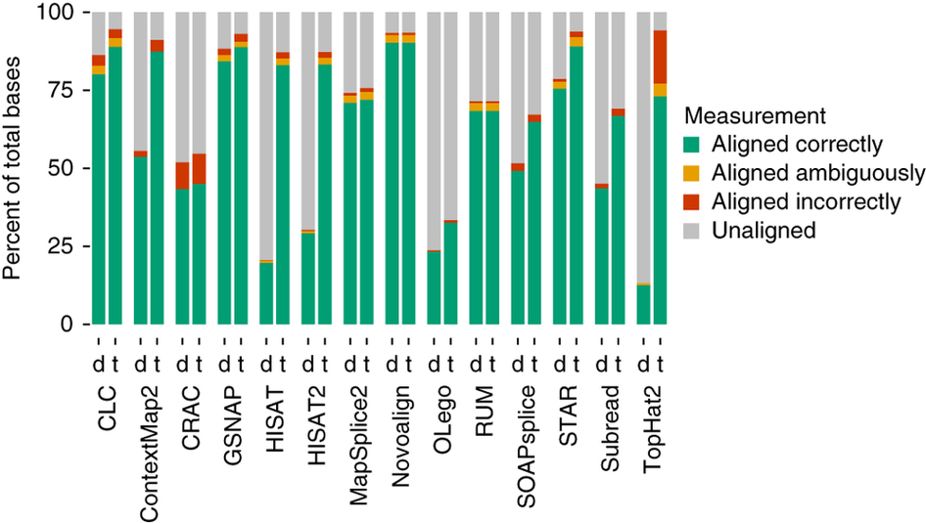
Baruzzo et al. (2017)
Aligners time and RAM
| Program | Time_Min | Memory_GB |
|---|---|---|
| HISATx1 | 22.7 | 4.3 |
| HISATx2 | 47.7 | 4.3 |
| HISAT | 26.7 | 4.3 |
| STAR | 25 | 28 |
| STARx2 | 50.5 | 28 |
| GSNAP | 291.9 | 20.2 |
| TopHat2 | 1170 | 4.3 |
- Reads (FASTQ)
@ST-E00274:179:HHYMLALXX:8:1101:1641:1309 1:N:0:NGATGT
NCATCGTGGTATTTGCACATCTTTTCTTATCAAATAAAAAGTTTAACCTACTCAGTTATGCGCATACGTTTTTTGATGGCATTTCCATAAACCGATTTTTTTTTTATGCACGTACCCAAAACGTGCAGAAAAATACGCTGCTAGAAATGTA
+
#AAAFAFA<-AFFJJJAFA-FFJJJJFFFAJJJJ-<FFJJJ-A-F-7--FA7F7-----FFFJFA<FFFFJ<AJ--FF-A<A-<JJ-7-7-<FF-FFFJAFFAA--A--7FJ-7----77-A--7F7)---7F-A----7)7-----7<<-
@instrument:runid:flowcellid:lane:tile:xpos:ypos read:isfiltered:controlnumber:sampleid
- Reference Genome/Transcriptome (FASTA)
>1 dna:chromosome chromosome:GRCz10:1:1:58871917:1 REF
GATCTTAAACATTTATTCCCCCTGCAAACATTTTCAATCATTACATTGTCATTTCCCCTC- Annotation (GTF/GFF)
#!genome-build GRCz10
4       ensembl_havana  gene    6732    52059   .       -       .       gene_id "ENSDARG00000104632"; gene_version "2"; gene_name "rerg"; gene_source "ensembl_havana"; gene_biotype "protein_coding"; havana_gene "OTTDARG00000044080"; havana_gene_version "1";
seq source feature start end score strand frame attribute
Alignment
- SAM/BAM (Sequence Alignment Map format)
ST-E00274:188:H3JWNCCXY:4:1102:32431:49900 163 1 1 60 8S139M4S = 385 535 TATTTAGAGATCTTAAACATCCATTCCCCCTGCAAACATTTTCAATCATTACATTGTCATTTTCCCTCCAAATTAAATTTAGCCAGAGGCGCACAACATACGACCTCTAAAAAAGGTGCTGGAACATGTACCTATATGCAGCACCACCATC AAAFAFFAFFFFJ7FFFFJ<JAFA7F-<AJ7JJ<FFFJ--<FAJF<7<7FAFJ-<AFA<-JJJ-AF-AJ-FF<F--A<FF<-7777-7JA-77A---F-7AAFF-FJA--77FJ<--77)))7<JJA<J77<-------<7--))7)))7- NM:i:4 MD:Z:12T0T40C58T25 AS:i:119 XS:i:102 XA:Z:17,-53287490,4S33M4D114M,11; MQ:i:60 MC:Z:151M RG:Z:ST-E00274_188_H3JWNCCXY_4query flag ref pos mapq cigar mrnm mpos tlen seq qual opt
Never store alignment files in raw SAM format. Always compress it! SAM format
| Format | Size_GB |
|---|---|
| SAM | 7.4 |
| BAM | 1.9 |
| CRAM lossless Q | 1.4 |
| CRAM 8 bins Q | 0.8 |
| CRAM no Q | 0.26 |
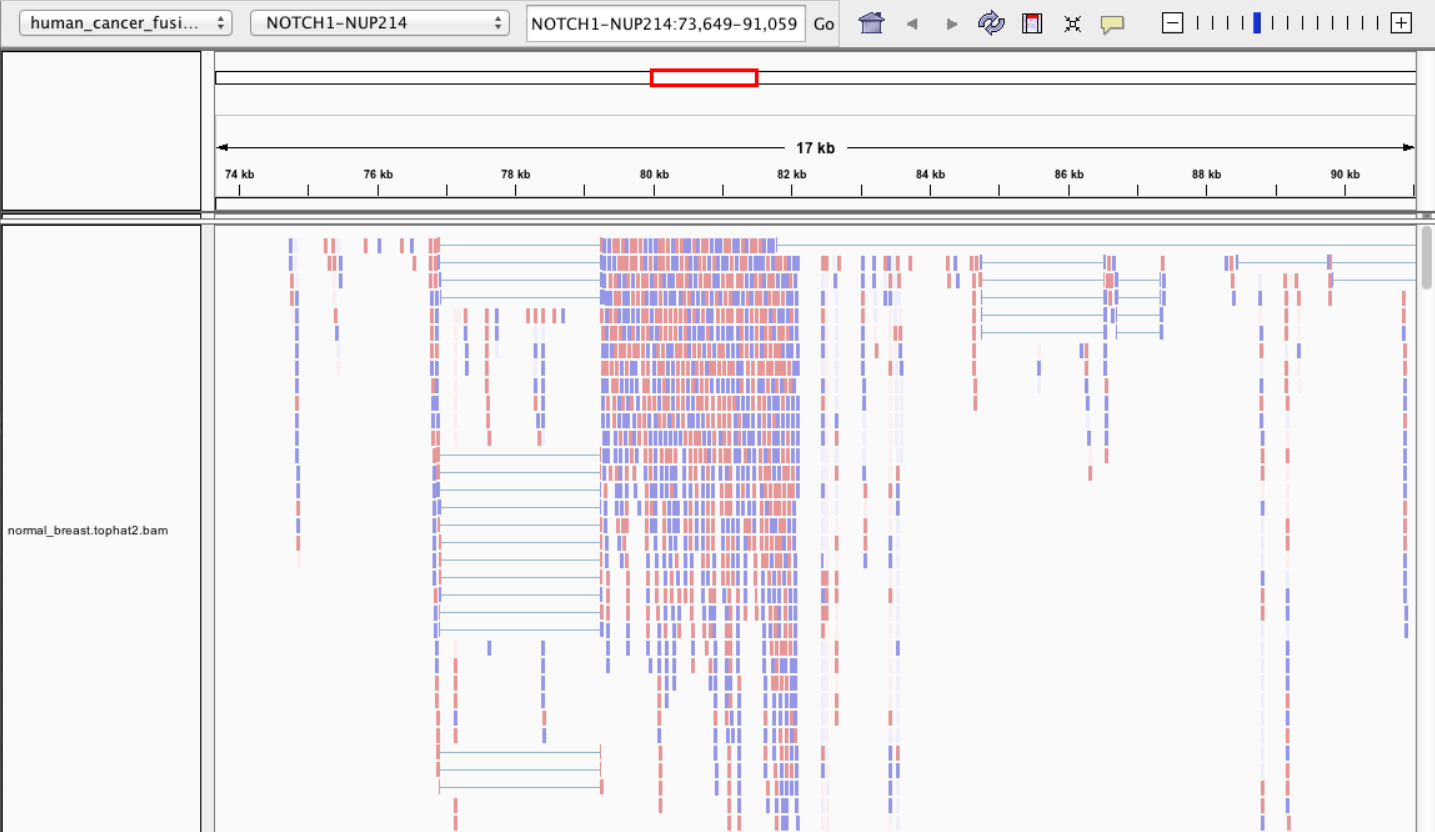
Visualisation • IGV
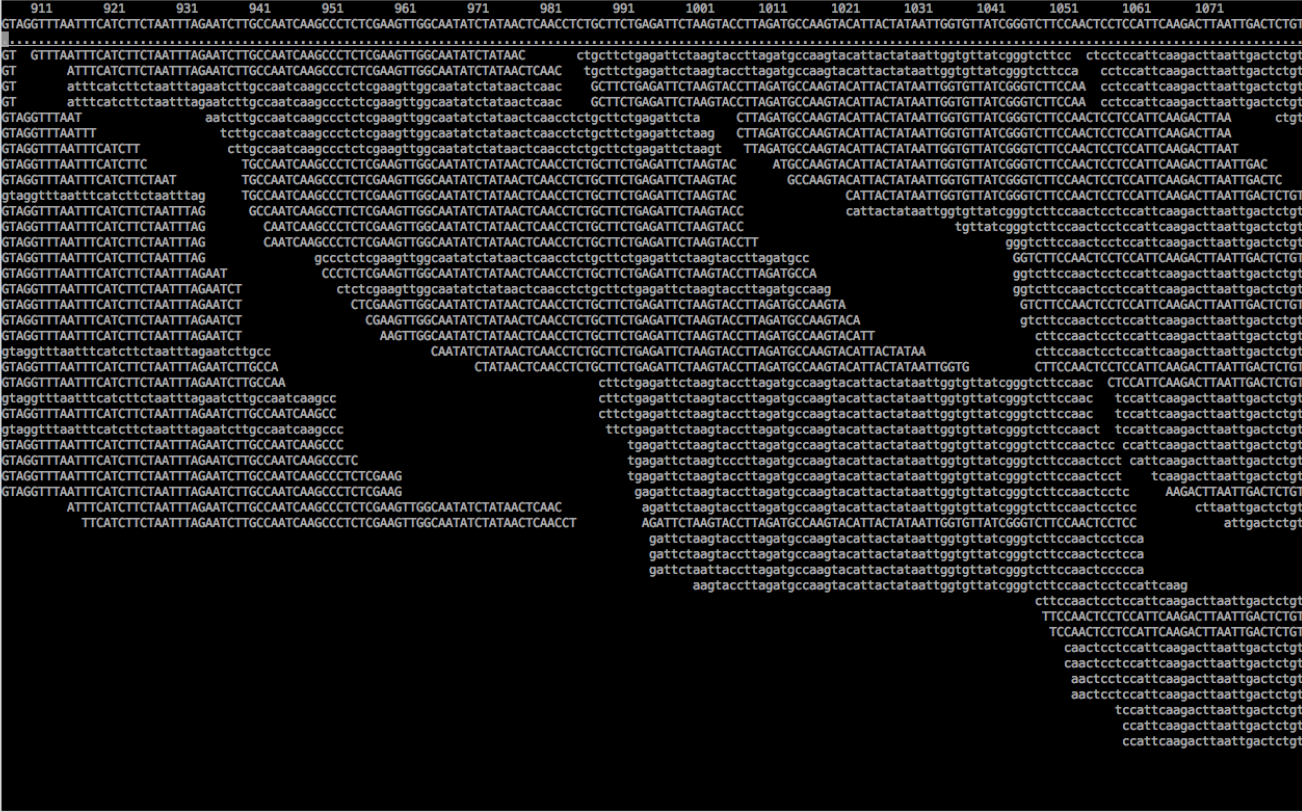
Visualisation • tview
samtools tview alignment.bam genome.fasta
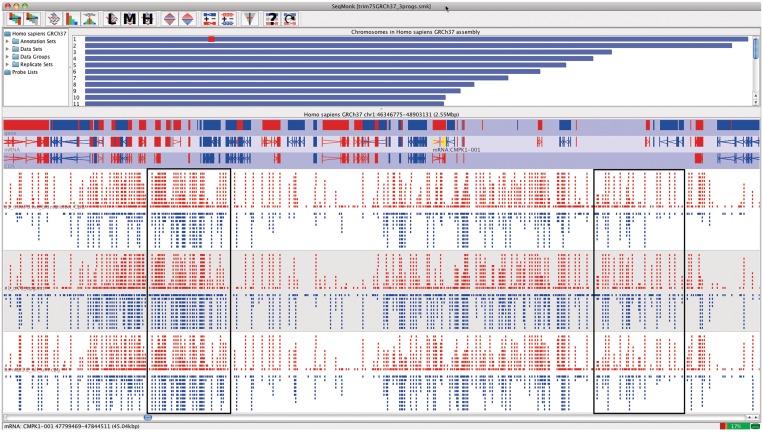
Visualisation • SeqMonk
Alignment QC
- Number of reads mapped/unmapped/paired etc
- Uniquely mapped
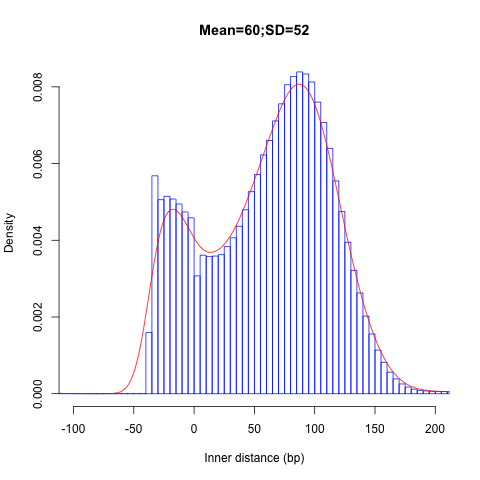
- Insert size distribution
- Coverage
- Gene body coverage
- Biotype counts / Chromosome counts
- Counts by region: gene/intron/non-genic
- Sequencing saturation
- Strand specificity
STAR (final log file), samtools stats, bamtools stats, QoRTs, RSeQC, Qualimap
Alignment QC • STAR Log
MultiQC can be used to summarise and plot STAR log files.
Alignment QC • Features
QoRTs was run on all samples and summarised using MultiQC.
Alignment QC • QoRTs
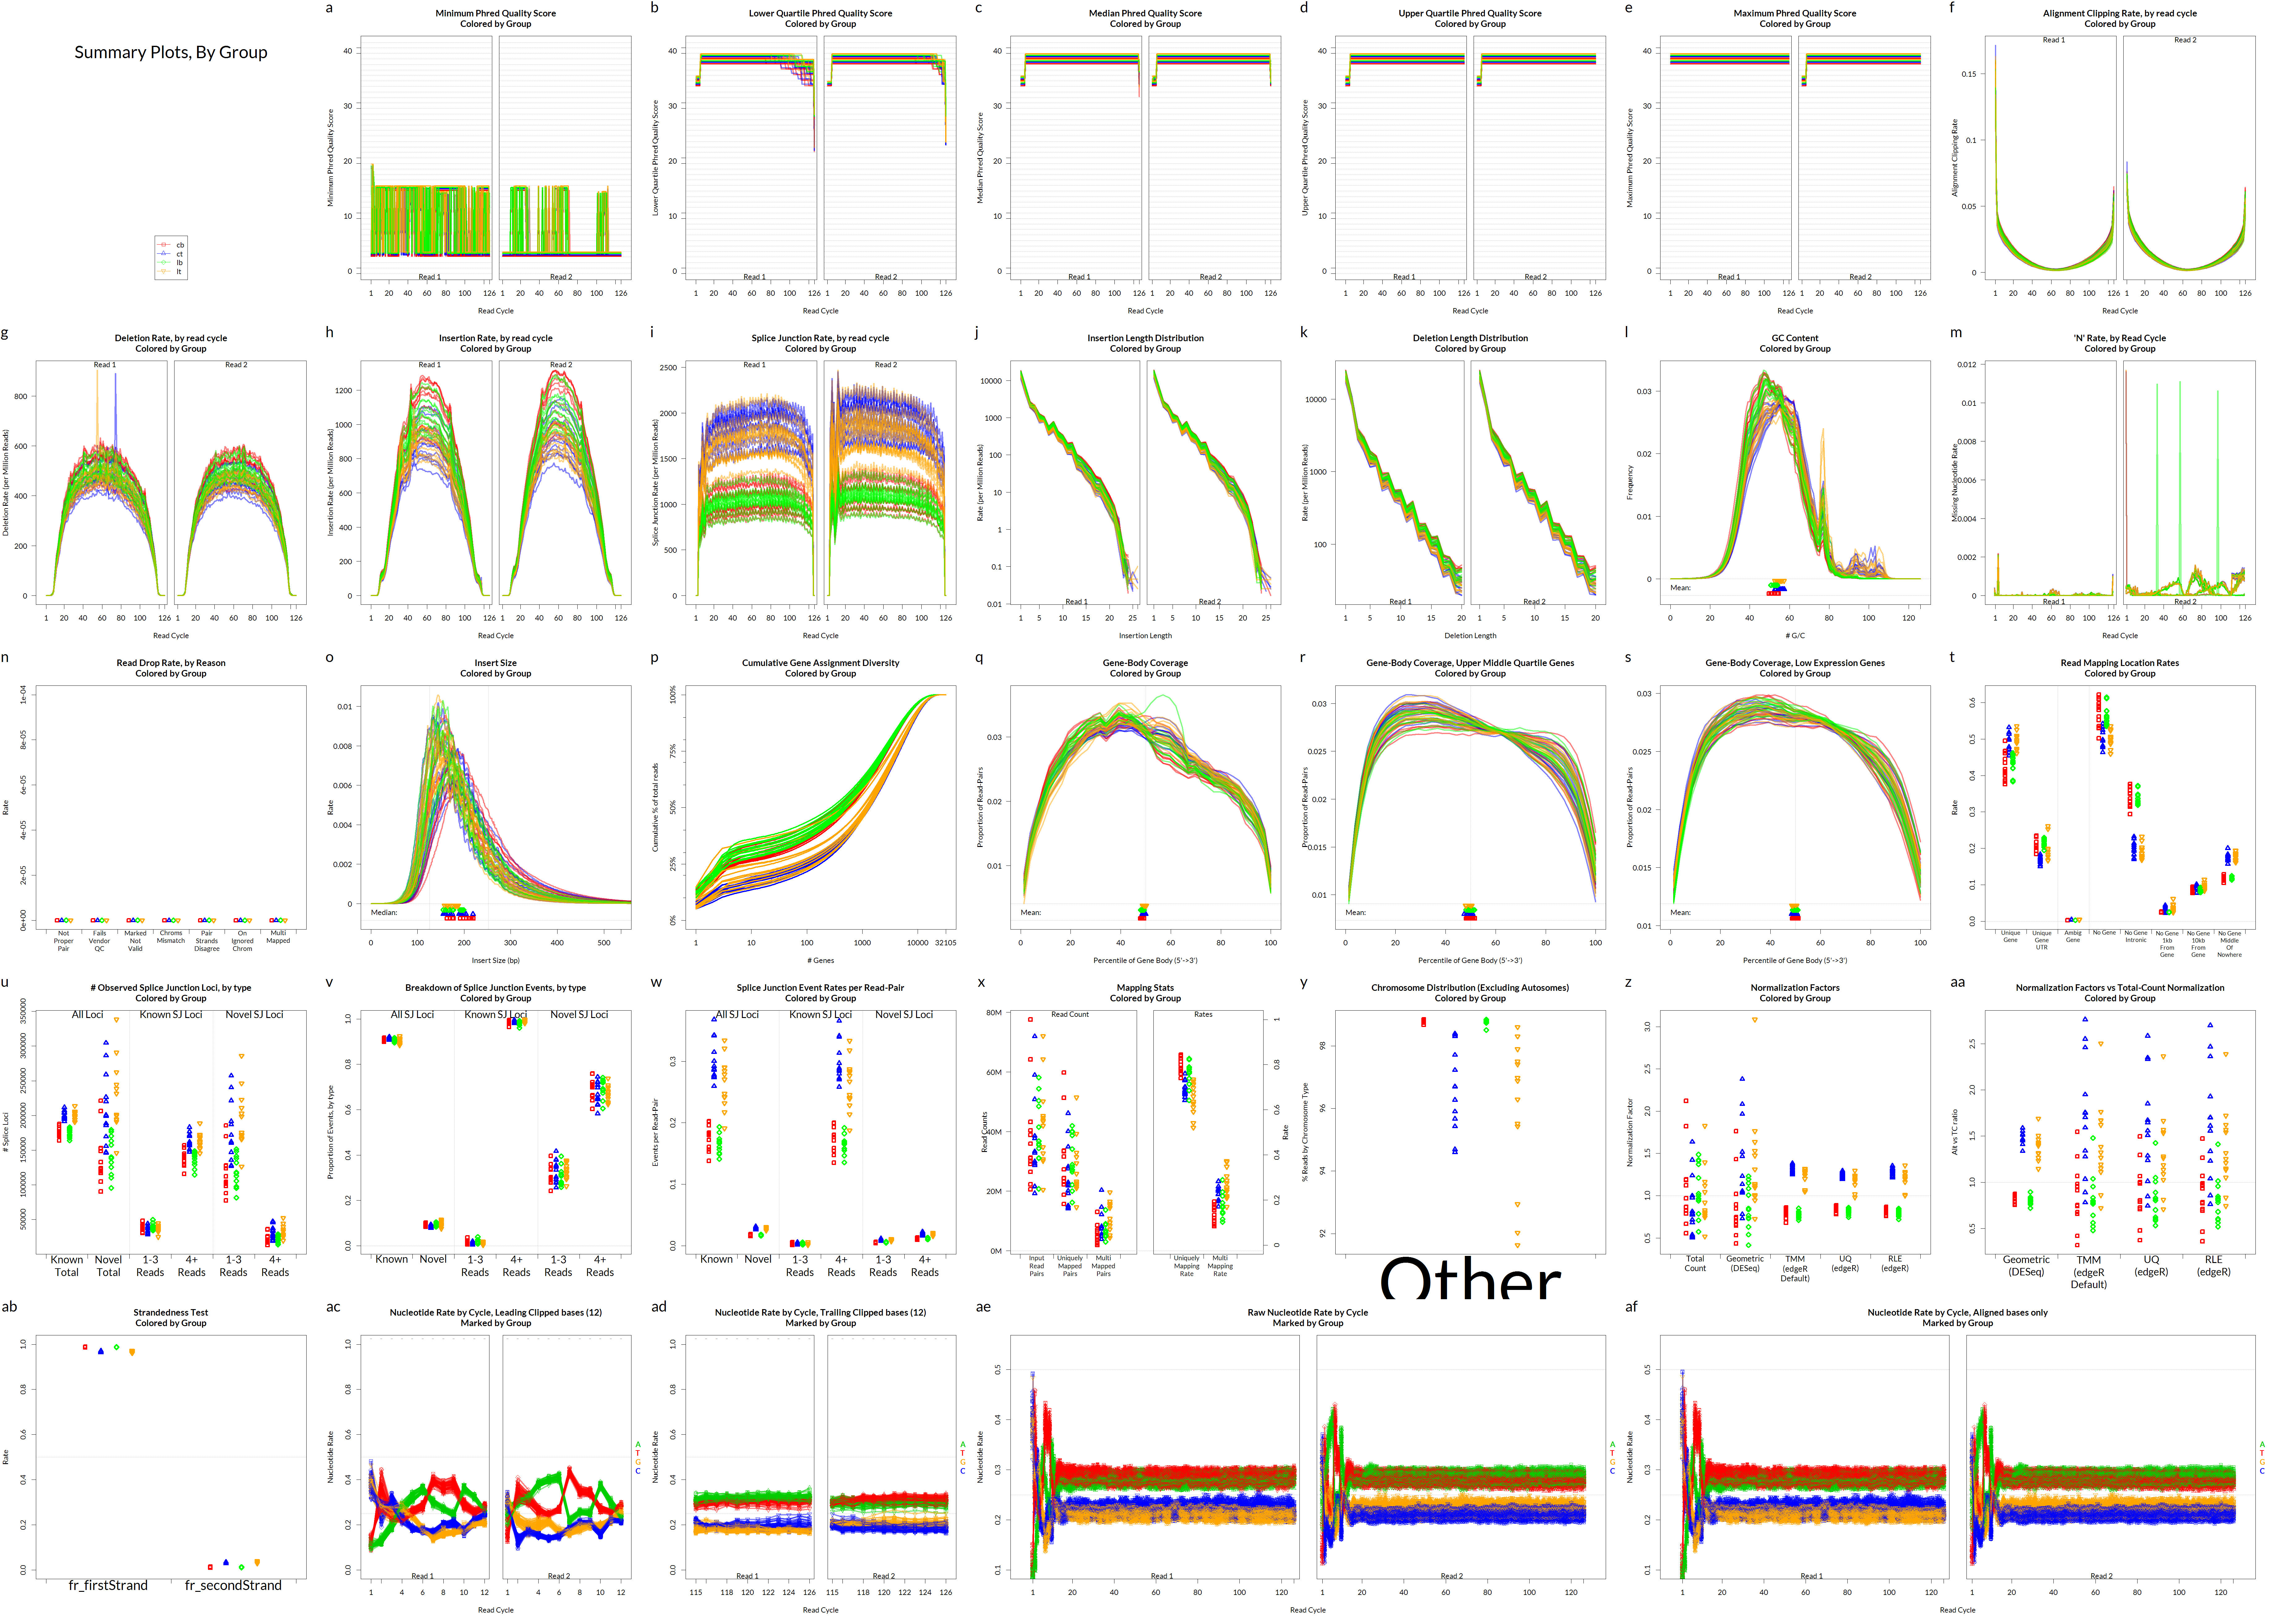
Alignment QC • Examples
Read mapping profile 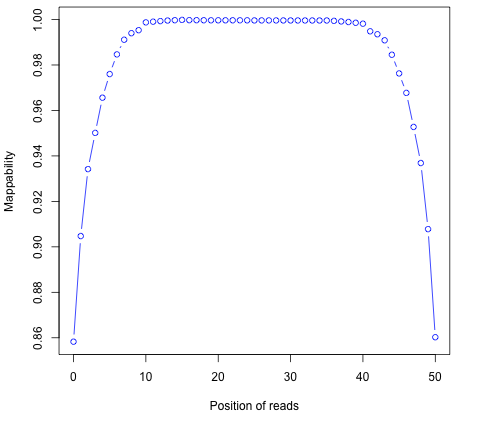
Gene body coverage 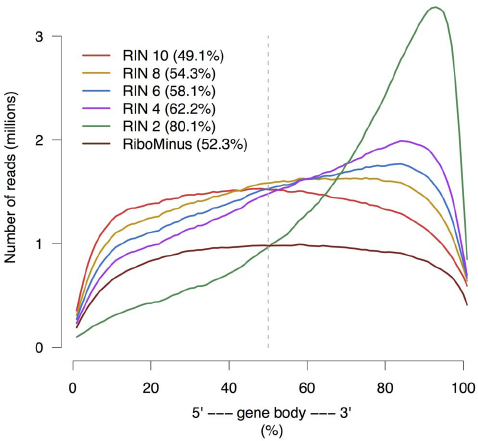
Sigurgeirsson et al. (2014)
Alignment QC • Examples
Insert size
Saturation curve
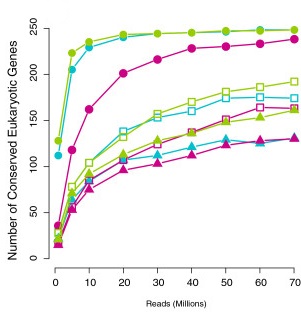
Francis et al. (2013)
Quantification • Counts
- Read counts = gene expression
- Intersection on gene models
- Reads can be quantified on any feature (gene, transcript, exon etc)
Quantification
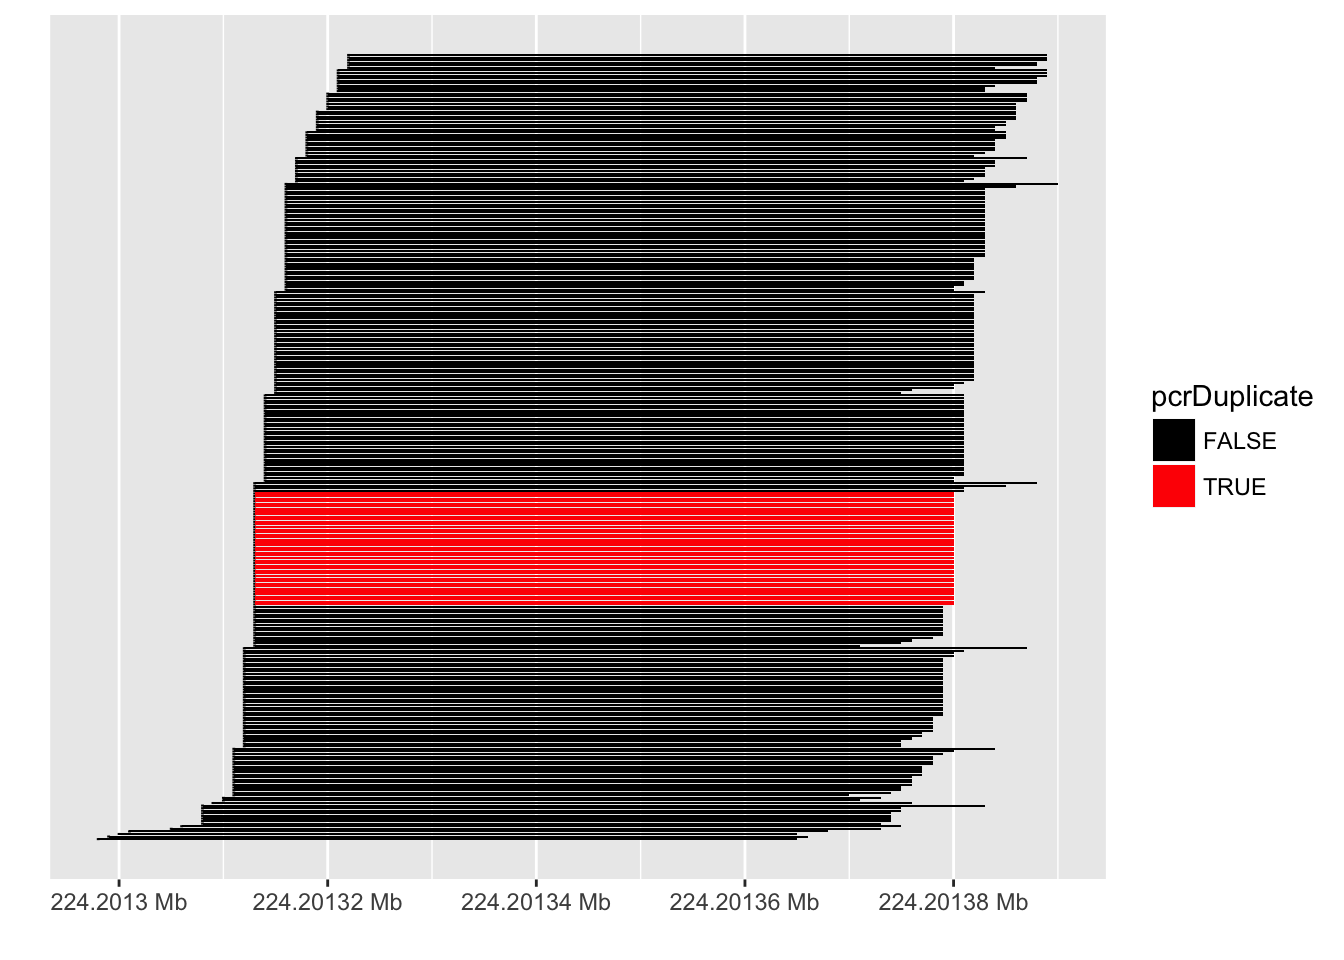
PCR duplicates
- Computational deduplication not recommended Klepikova et al. (2017), Parekh et al. (2016)
- Use PCR-free library-prep kits
- Use UMIs during library-prep Fu et al. (2018)
Multi-mapping
- Added (BEDTools multicov)
- Discard (featureCounts, HTSeq)
- Distribute counts (Cufflinks, featureCounts)
- Rescue
- Probabilistic assignment (Rcount, Cufflinks)
- Prioritise features (Rcount)
- Probabilistic assignment with EM (RSEM)
Quantification • Abundance
- Count methods
- Provide no inference on isoforms
- Cannot accurately measure fold change
- Probabilistic assignment
- Deconvolute ambiguous mappings
- Transcript-level
- cDNA reference
Kallisto, Salmon
Quantification QC
ENSG00000000003    140   242   188   143   287   344   438   280   253
ENSG00000000005    0     0     0     0     0     0     0     0     0
ENSG00000000419    69    98    77    55    52    94    116   79    69
ENSG00000000457    56    75    104   79    157   205   183   178   153
ENSG00000000460    33    27    23    19    27    42    69    44    40
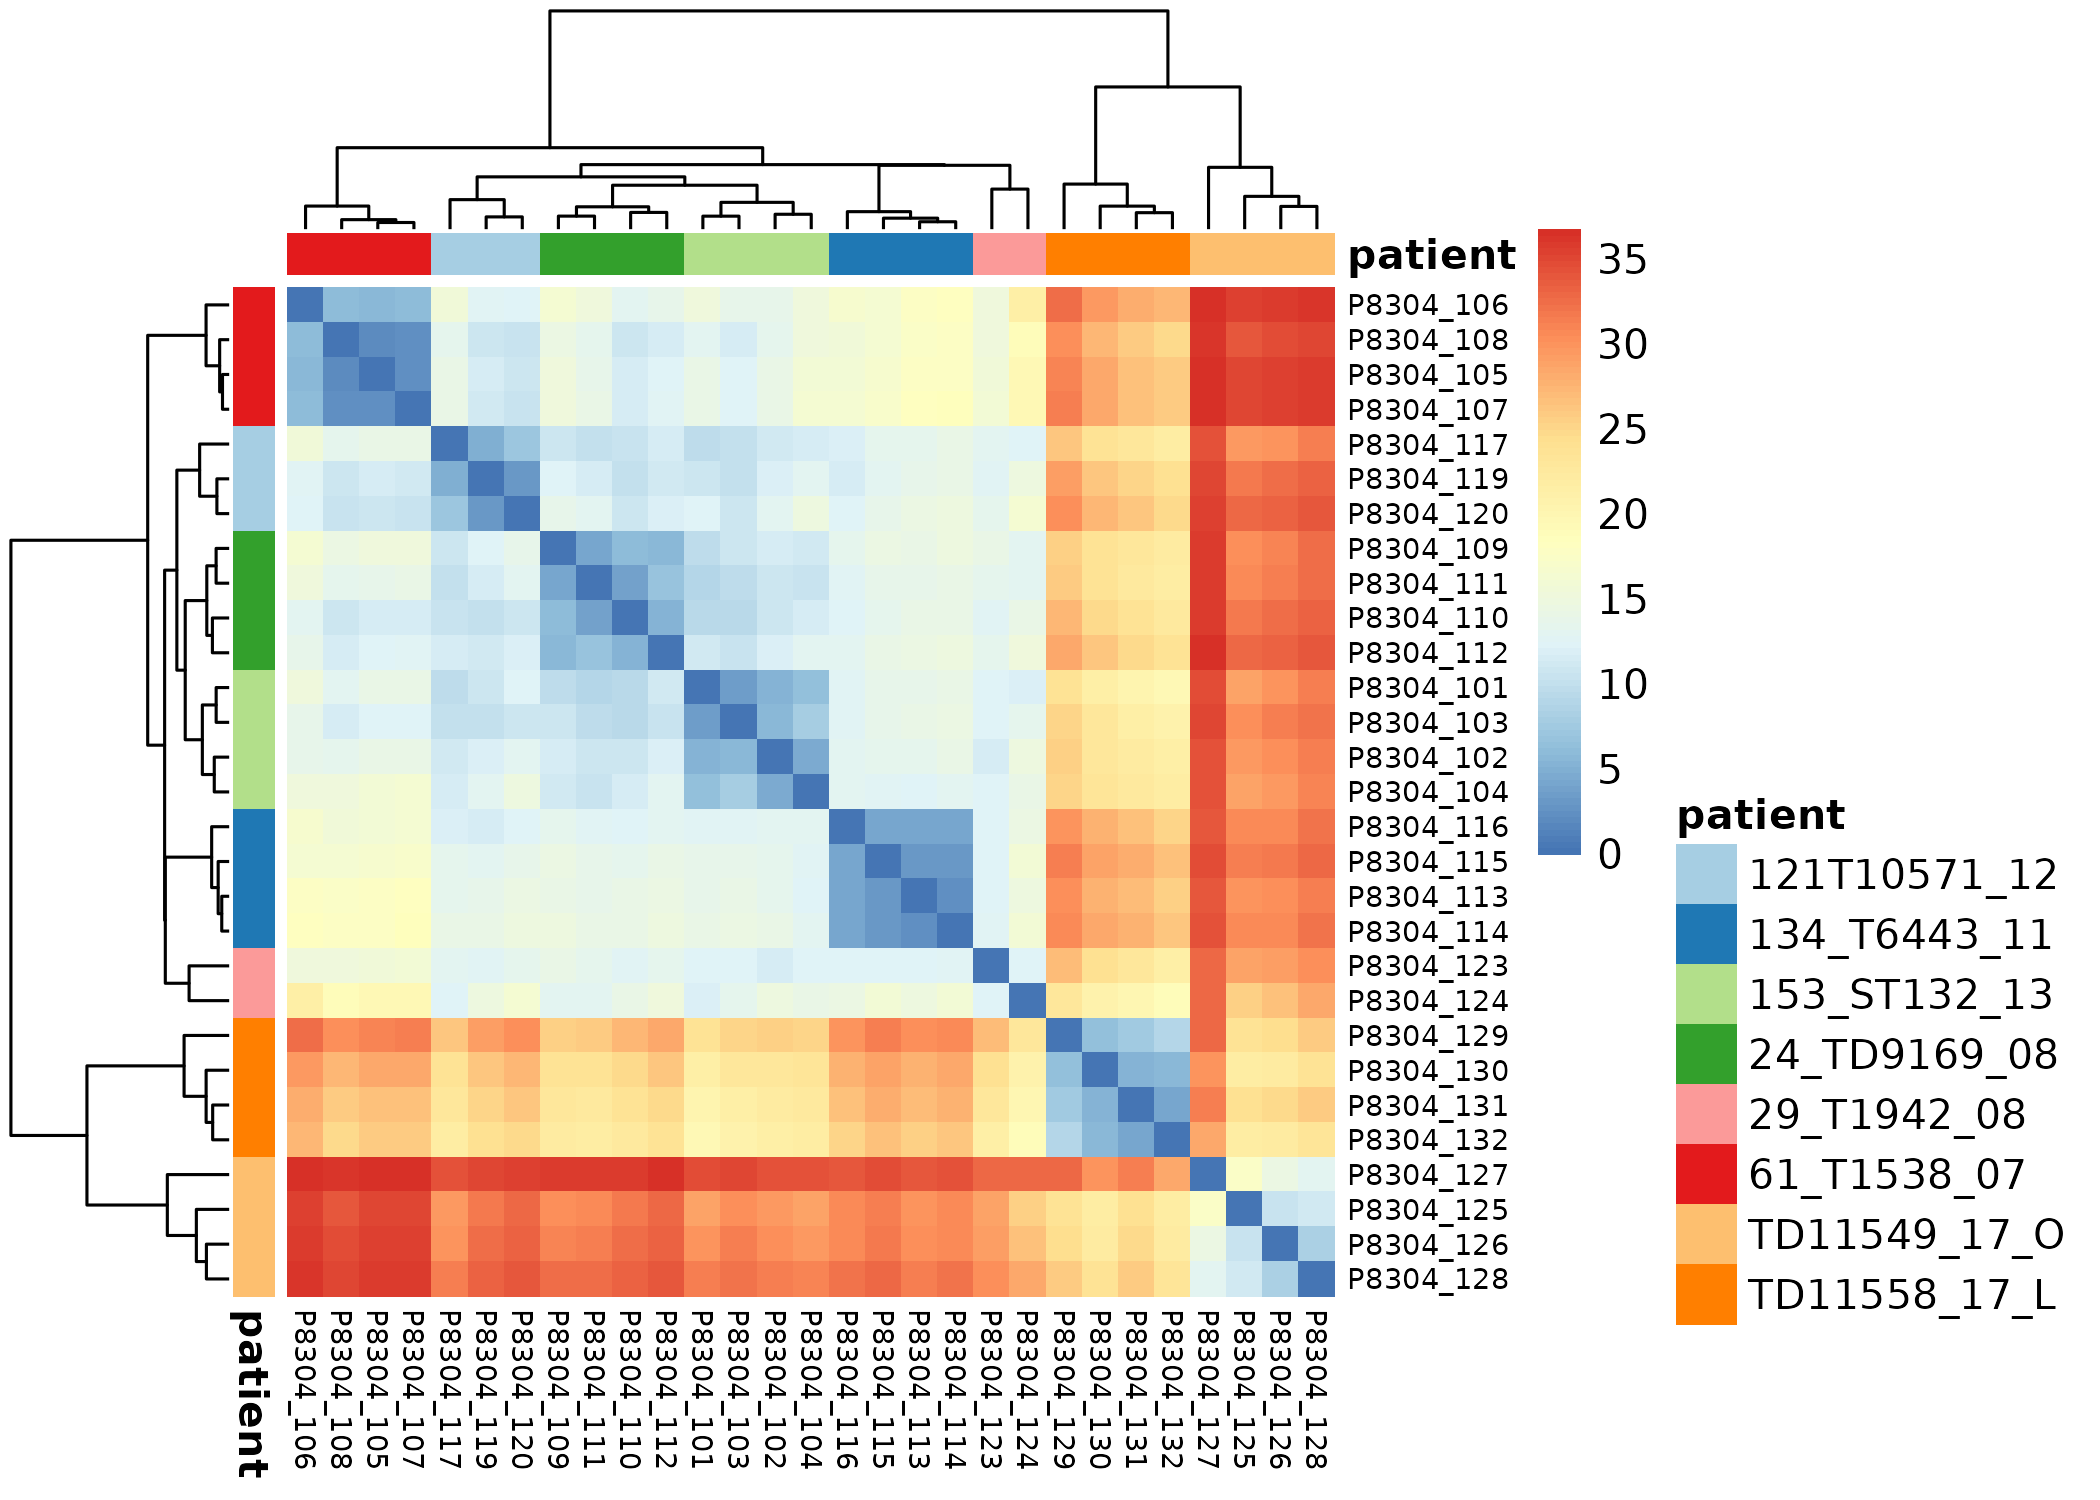
Pairwise correlation between samples must be high (>0.9)
MultiQC
Normalization
- Control for Sequencing depth, compositional bias and more
- Median of Ratios (DESeq2) and TMM (edgeR) perform the best

- For DGE using DGE packages, use raw counts
- For clustering, heatmaps etc use VST, VOOM or RLOG
- For own analysis, plots etc, use TPM
- Other solutions: spike-ins/house-keeping genes
Dillies et al. (2013), Evans et al. (2018), Wagner et al. (2012)

Exploratory
- Transform raw counts to VST, VOOM, RLOG, TPM etc
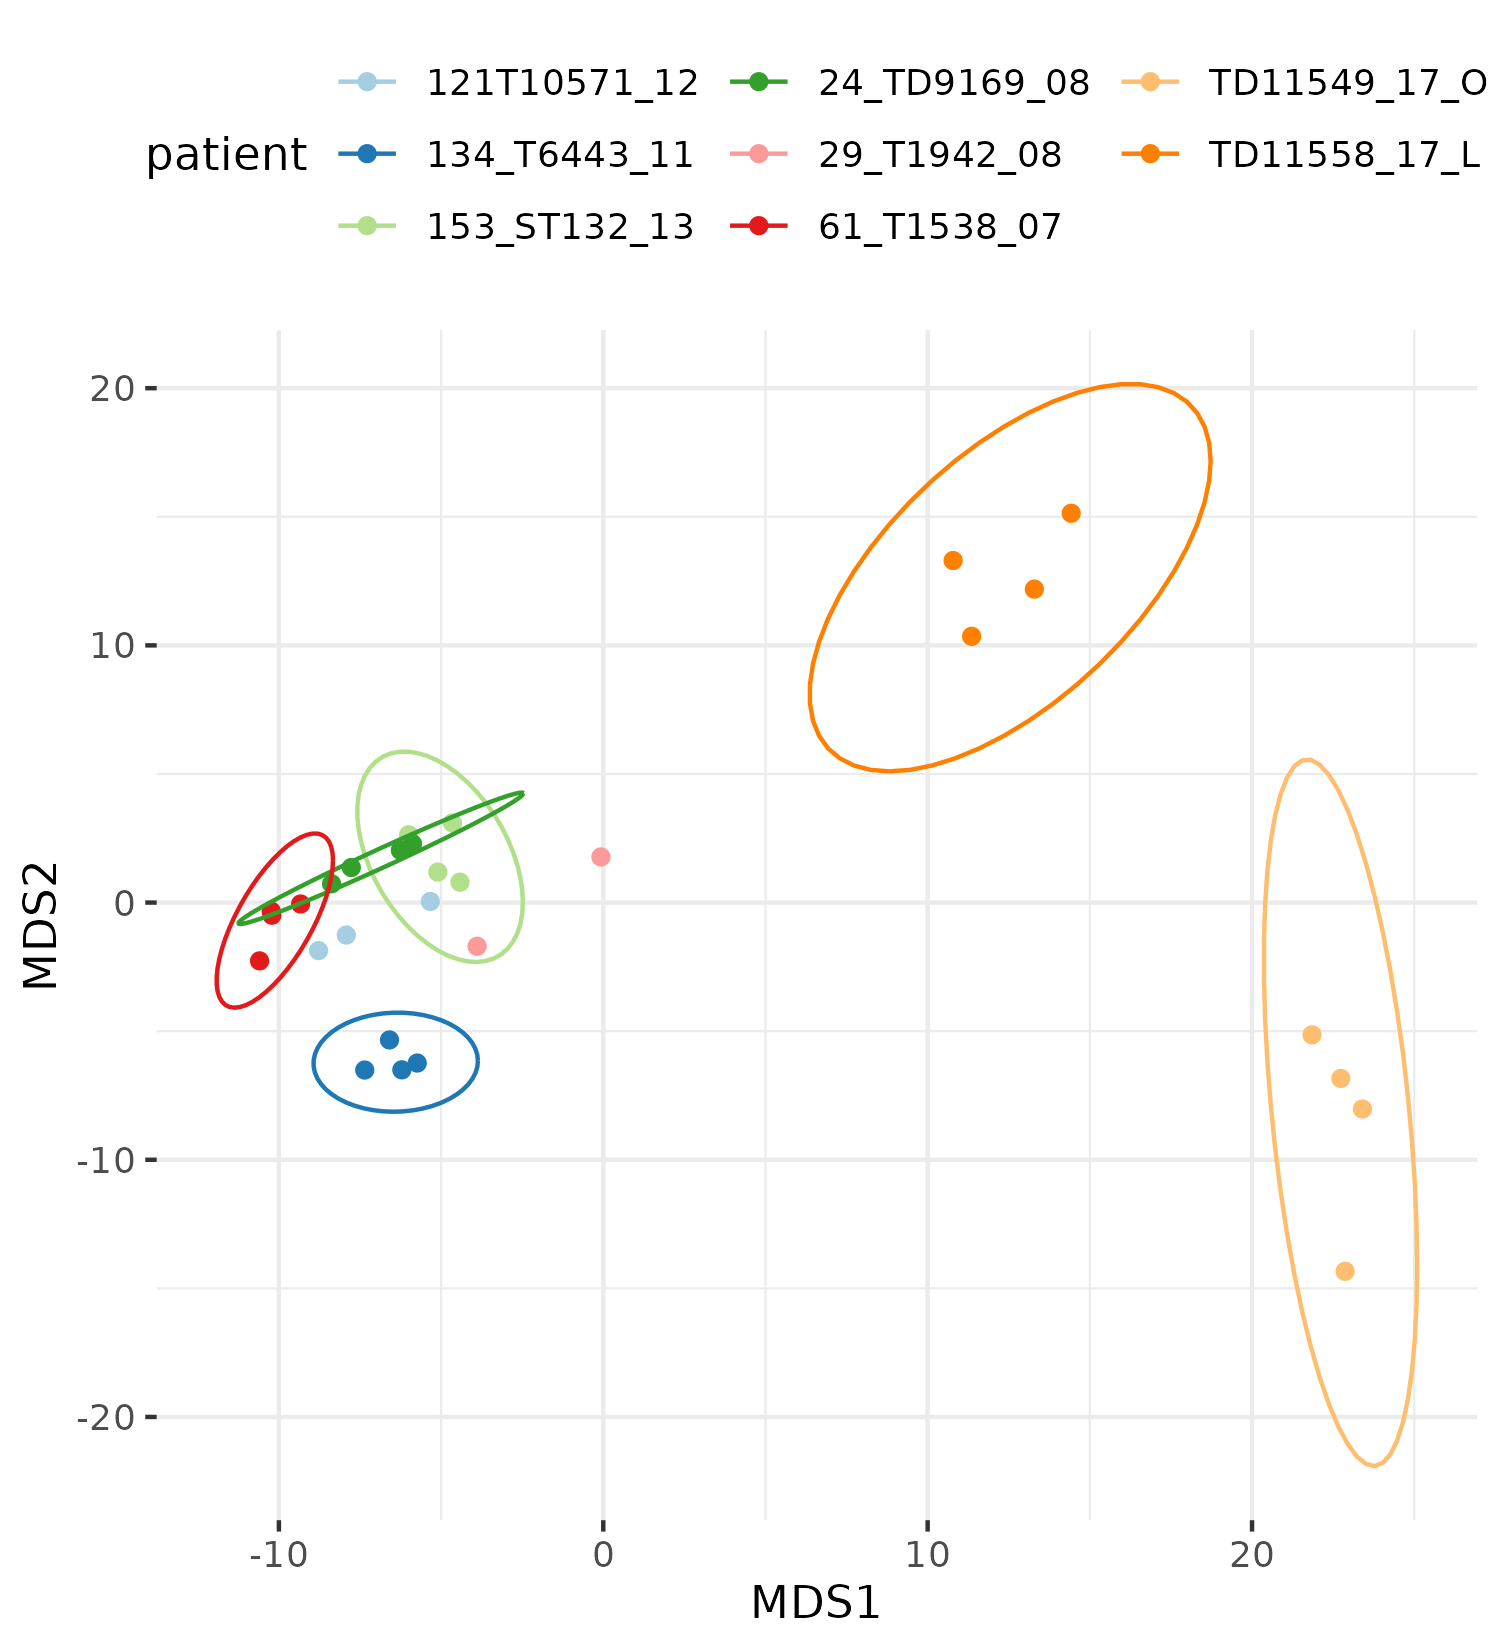
Batch correction
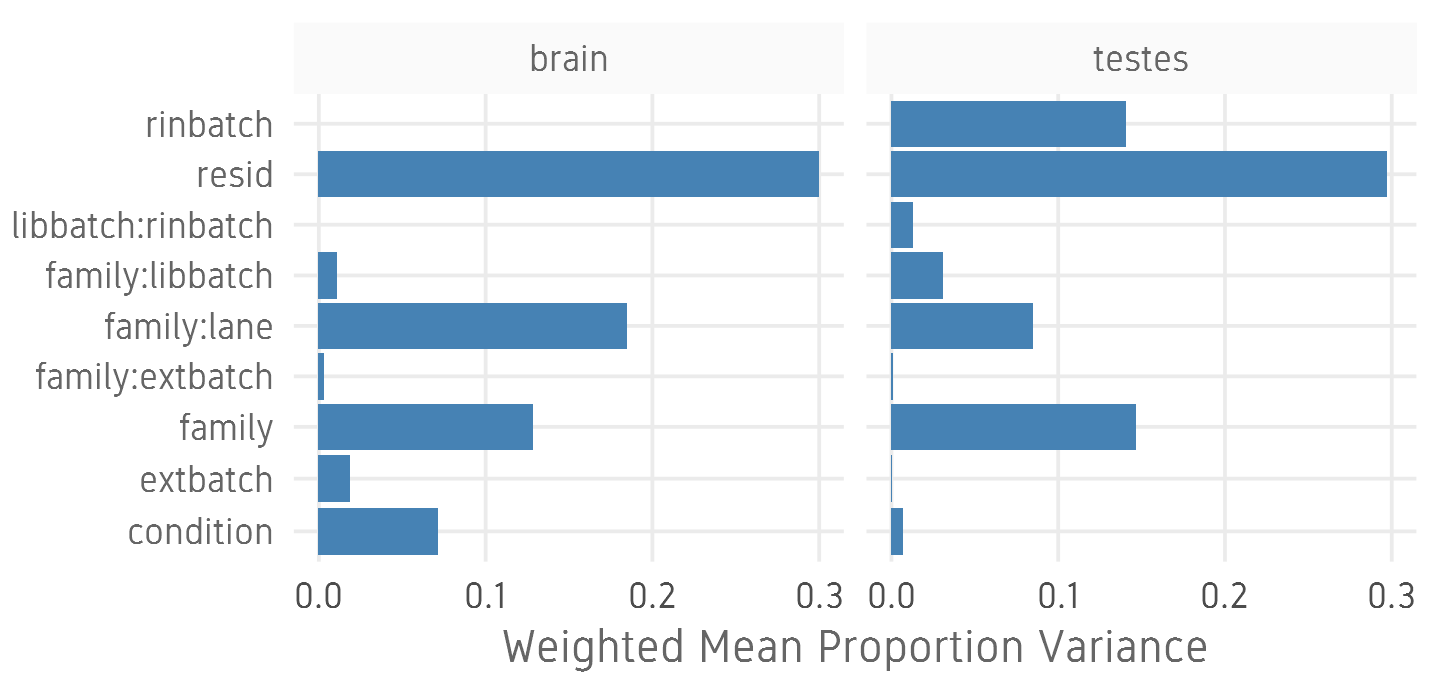
- Estimate variation explained by variables (PVCA)
Differential expression
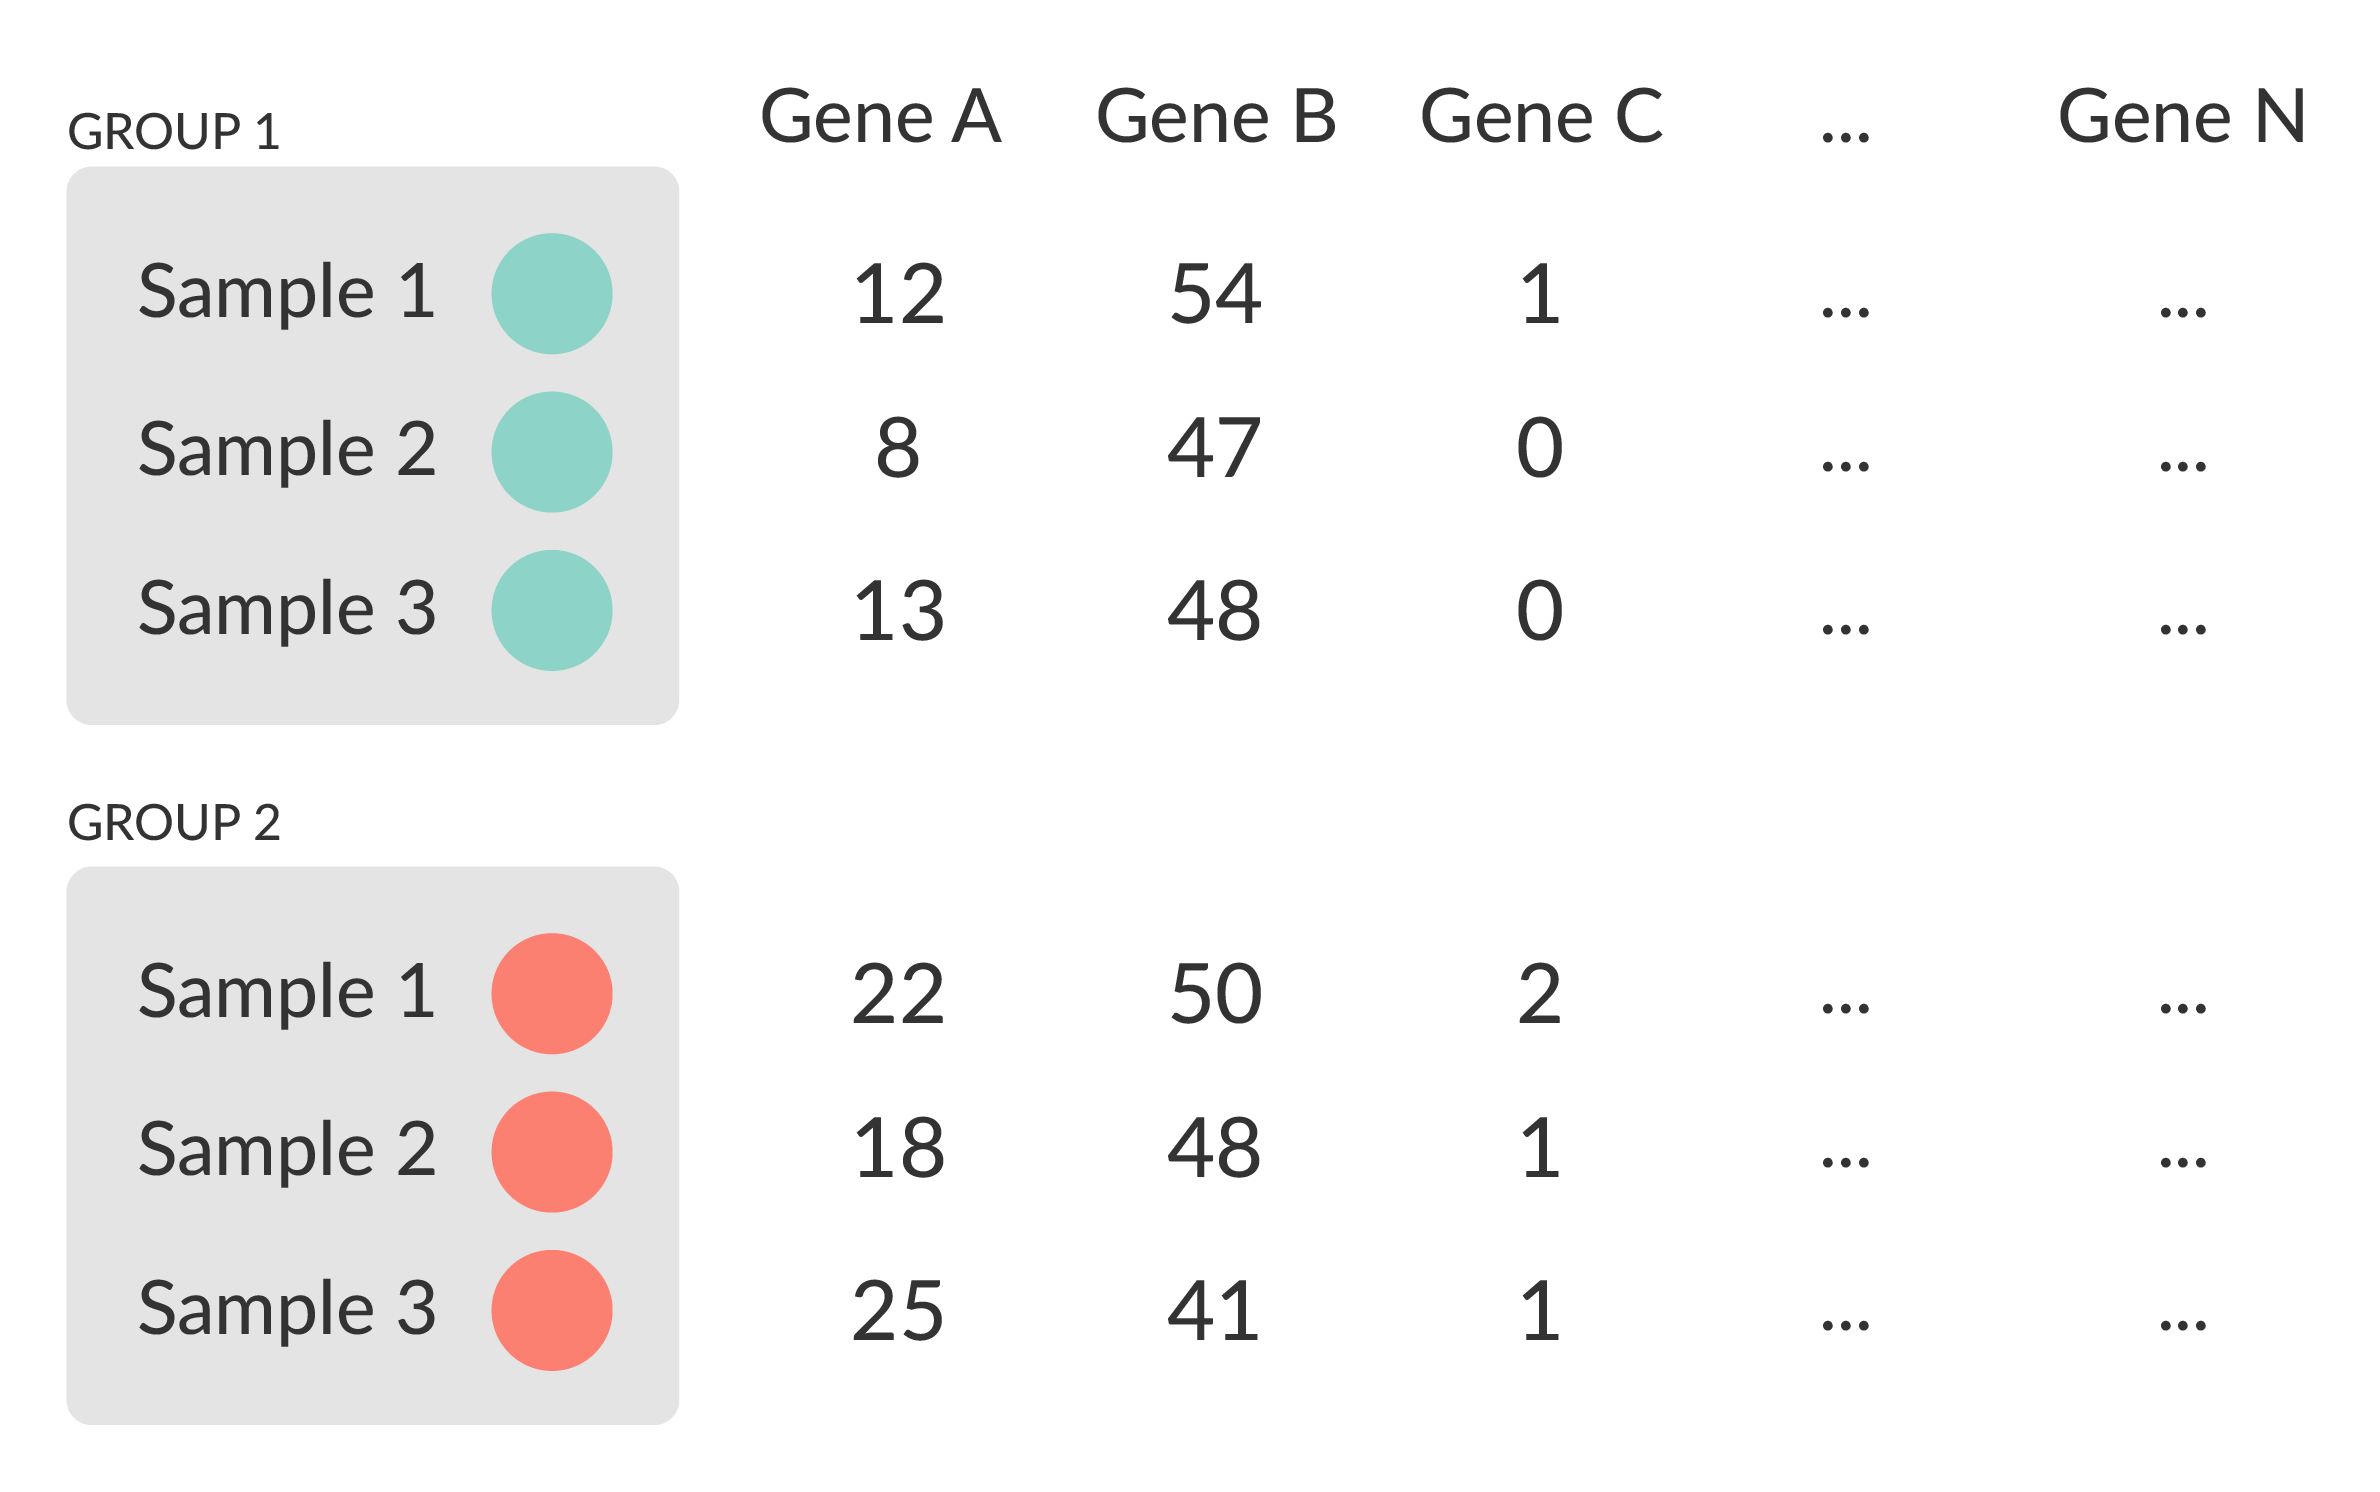
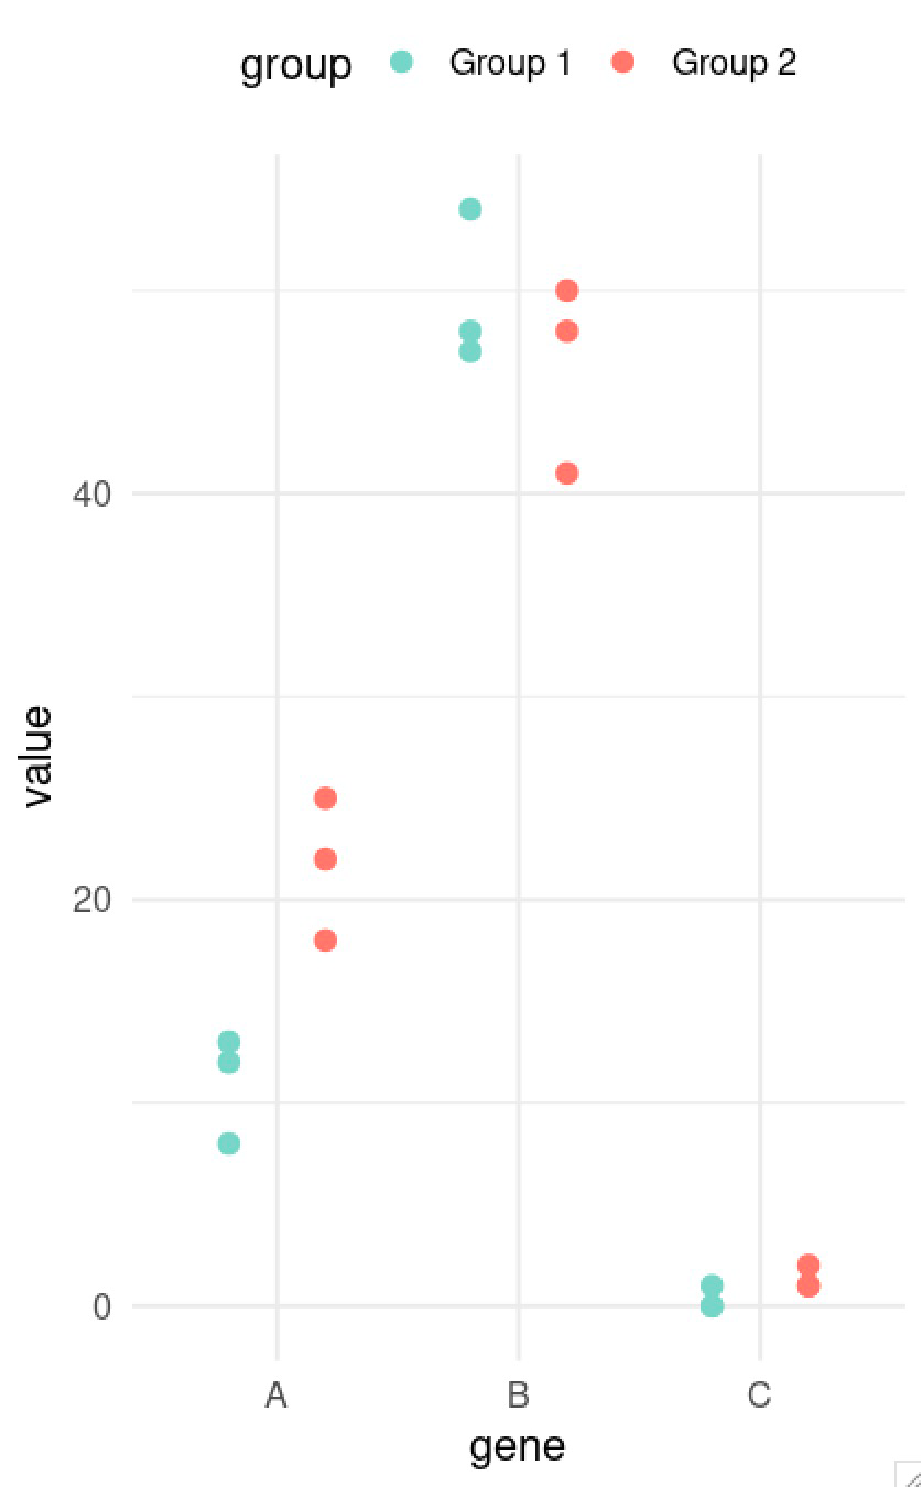
- Univariate testing gene-by-gene
- More descriptive, less predictive
Differential expression
- DESeq2, edgeR (Neg-binom > GLM > Test)
- Limma-Voom (Neg-binom > Voom-transform > LM > Test)
- DESeq2
~age+condition- Estimate size factors
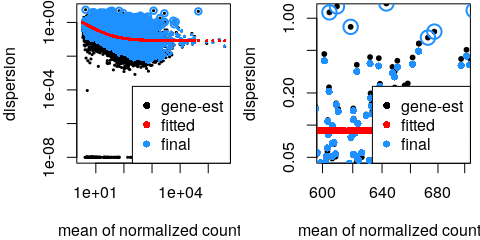
estimateSizeFactors() - Estimate gene-wise dispersion
estimateDispersions() - Fit curve to gene-wise dispersion estimates
- Shrink gene-wise dispersion estimates
- GLM fit for each gene
- Wald test
nbinomWaldTest()
- Estimate size factors
DGE
- Results
results()
log2 fold change (MLE): type type2 vs control
Wald test p-value: type type2 vs control
DataFrame with 1 row and 6 columns
                        baseMean     log2FoldChange             lfcSE
                       <numeric>          <numeric>         <numeric>
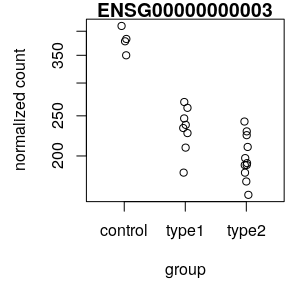
ENSG00000000003 242.307796723287 -0.932926089608546 0.114285150312285
                             stat               pvalue                 padj
                        <numeric>            <numeric>            <numeric>
ENSG00000000003 -8.16314356729037 3.26416150242775e-16 1.36240609998527e-14- Summary
summary()
out of 17889 with nonzero total read count
adjusted p-value < 0.1
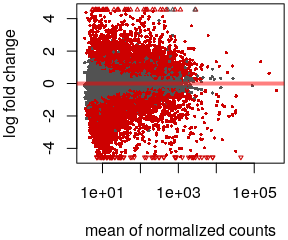
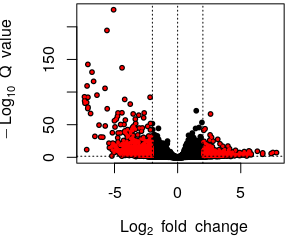
LFC > 0 (up)       : 4526, 25%
LFC < 0 (down)     : 5062, 28%
outliers [1]       : 25, 0.14%
low counts [2]     : 0, 0%
(mean count < 3)- MA plot
plotMA()
- Volcano plot
- Normalised counts
plotCounts()
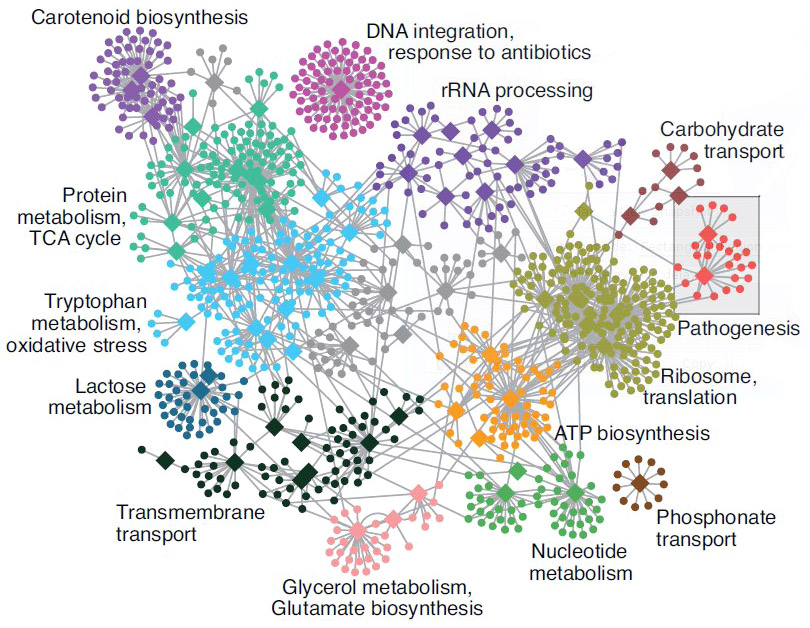
Functional analysis • Gene Ontology
- Gene set analysis (GSA)
- Gene set enrichment analysis (GSEA)
- Gene ontology / Reactome databases
Functional analysis • Kegg
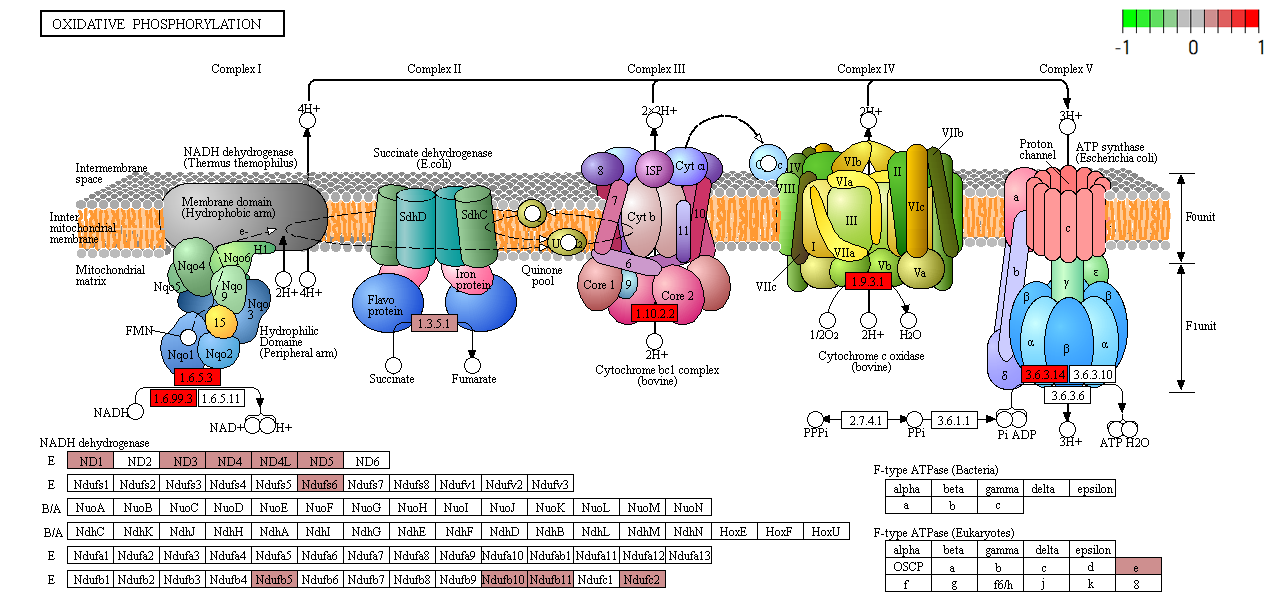
- Pathway analysis (Kegg)
Summary
- Sound experimental design to avoid confounding
- Plan carefully about lib prep, sequencing etc based on experimental objective
- For DGE, biological replicates may be more important than other considerations (paired-end, sequencing depth, long reads etc)
- Discard low quality bases, reads, genes and samples
- Verify that tools and methods align with data assumptions
- Experiment with multiple pipelines and tools
- QC! QC everything at every step
Conesa, A., Madrigal, P., Tarazona, S., Gomez-Cabrero, D., Cervera, A., McPherson, A., … & Mortazavi, A. (2016). A survey of best practices for RNA-seq data analysis. Genome biology, 17(1), 1-19.
Further learning
- Griffith lab RNA-Seq using HiSat & StringTie tutorial
- HBC Training DGE using DeSeq2 tutorial
- RNA-Seq Blog
- SciLifeLab courses

Thank you. Questions?
References
Hands-On tutorial
Main exercise
- 01 Check the quality of the raw reads with FastQC
- 02 Map the reads to the reference genome using HISAT2
- 03 Assess the post-alignment quality using QualiMap
- 04 Count the reads overlapping with genes using featureCounts
- 05 Find differentially expressed genes using DESeq2 in R
Bonus exercises
- 01 Functional annotation of DE genes using GO/Reactome/Kegg databases
- 02 RNA-Seq figures and plots using R
- 03 Visualisation of RNA-seq BAM files using IGV genome browser
Data: /sw/courses/ngsintro/rnaseq/dardel
Work: ~/ngsintro/rnaseq/
Hands-On tutorial
- Course data directory
/sw/courses/ngsintro/rnaseq/dardel
dardel/
├── bonus
│   ├── assembly
│   ├── exon
│   ├── funannot
│   └── plots
├── main
│   ├── 1_raw
│   ├── 2_fastqc
│   ├── 3_mapping
│   ├── 4_qorts
│   ├── 4_qualimap
│   ├── 5_dge
│   ├── 6_multiqc
│   ├── reference
│   │   └── mouse_chr19_hisat2
│   └── scripts
├── main_full
│   └── nextflow
├── r
└── README.md- Your work directory
~/ngsintro/rnaseq/
rnaseq/
├── 1_raw
├── 2_fastqc
├── 3_mapping
├── 4_picard
├── 4_qualimap
├── 5_dge
├── 6_multiqc
├── funannot
├── plots
├── reference
└── scripts