Interactive web apps with Shiny
RaukR 2024 • Advanced R for Bioinformatics
Roy Francis
21-Jun-2024
Contents
Shiny use cases, App structure, Code execution,
UI, Widgets, Dynamic UI,
Reactivity, Reactive dynamics,
Error validation, Observers, Reactive values,
Updating widgets, Action buttons, Download, Modules, Debugging,
Theming, Deploy,
Interactive documents, Extensions
What is Shiny?
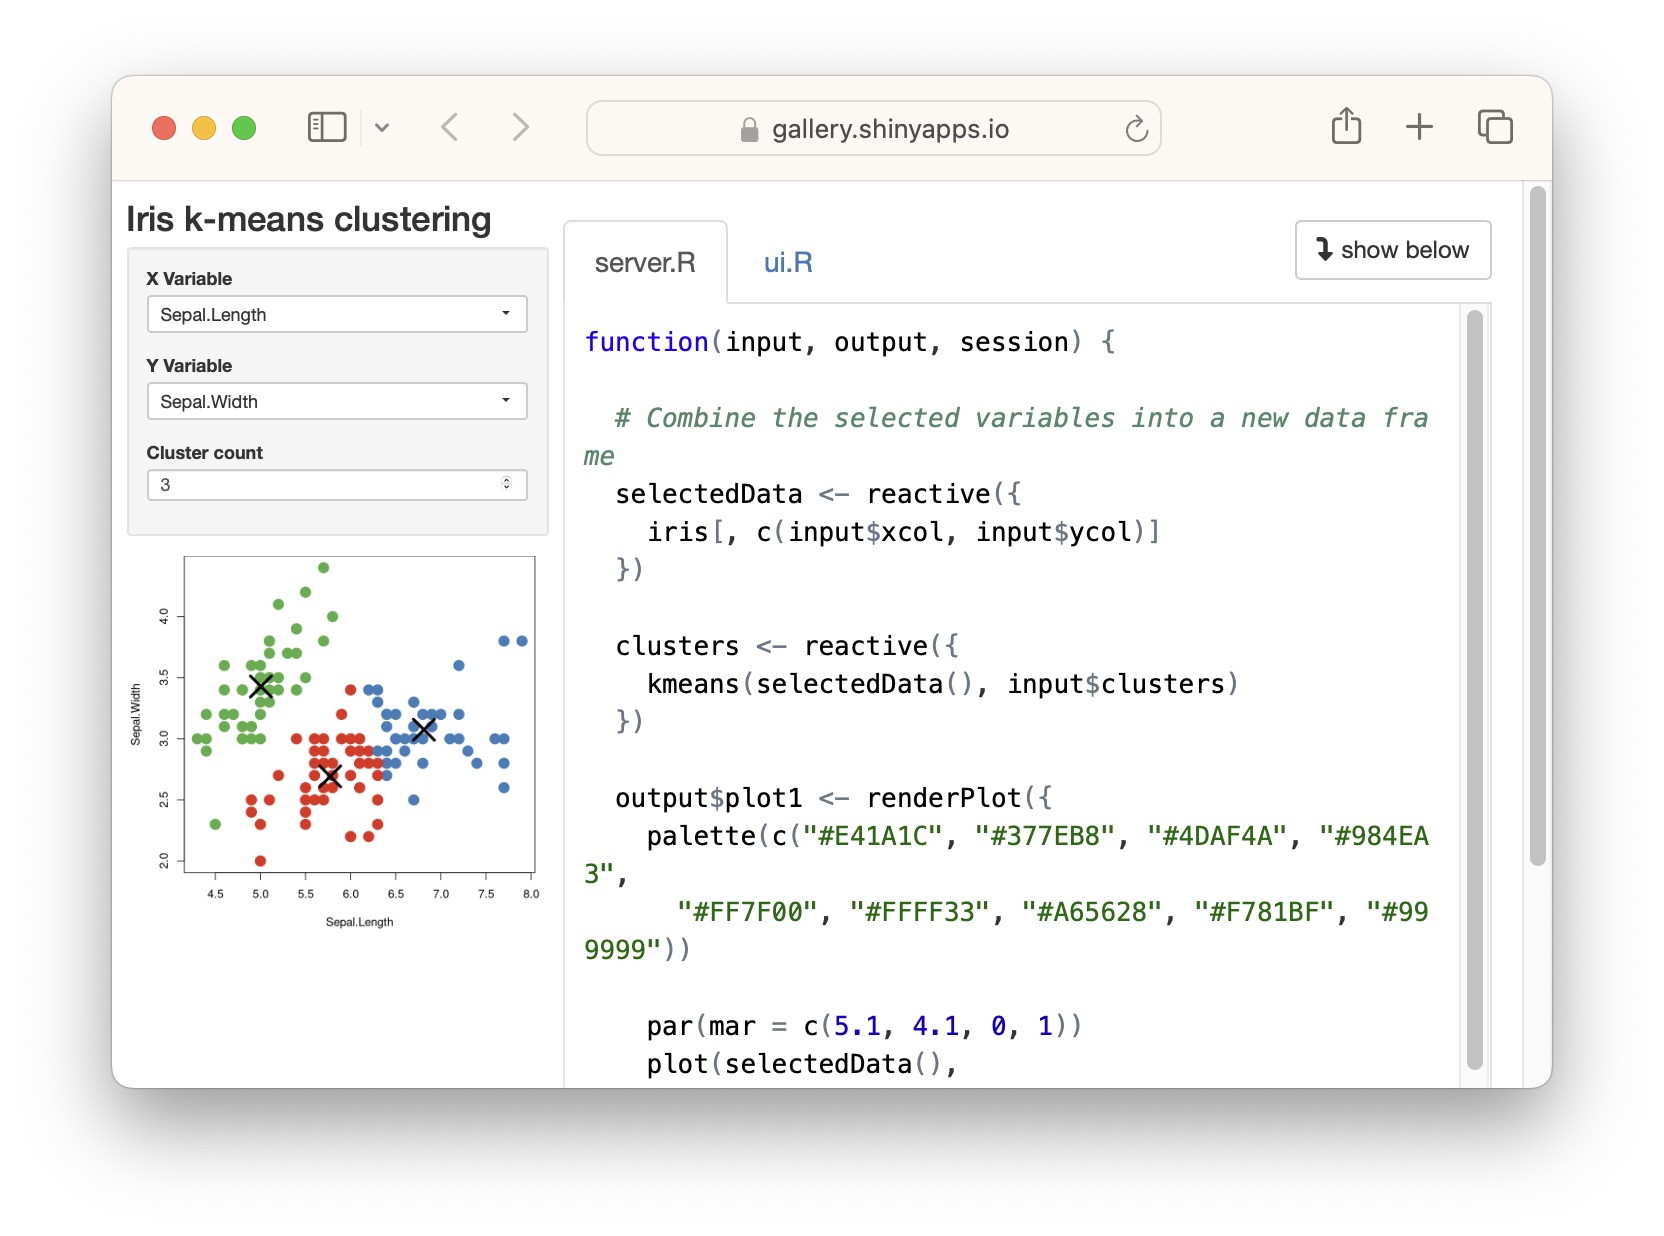
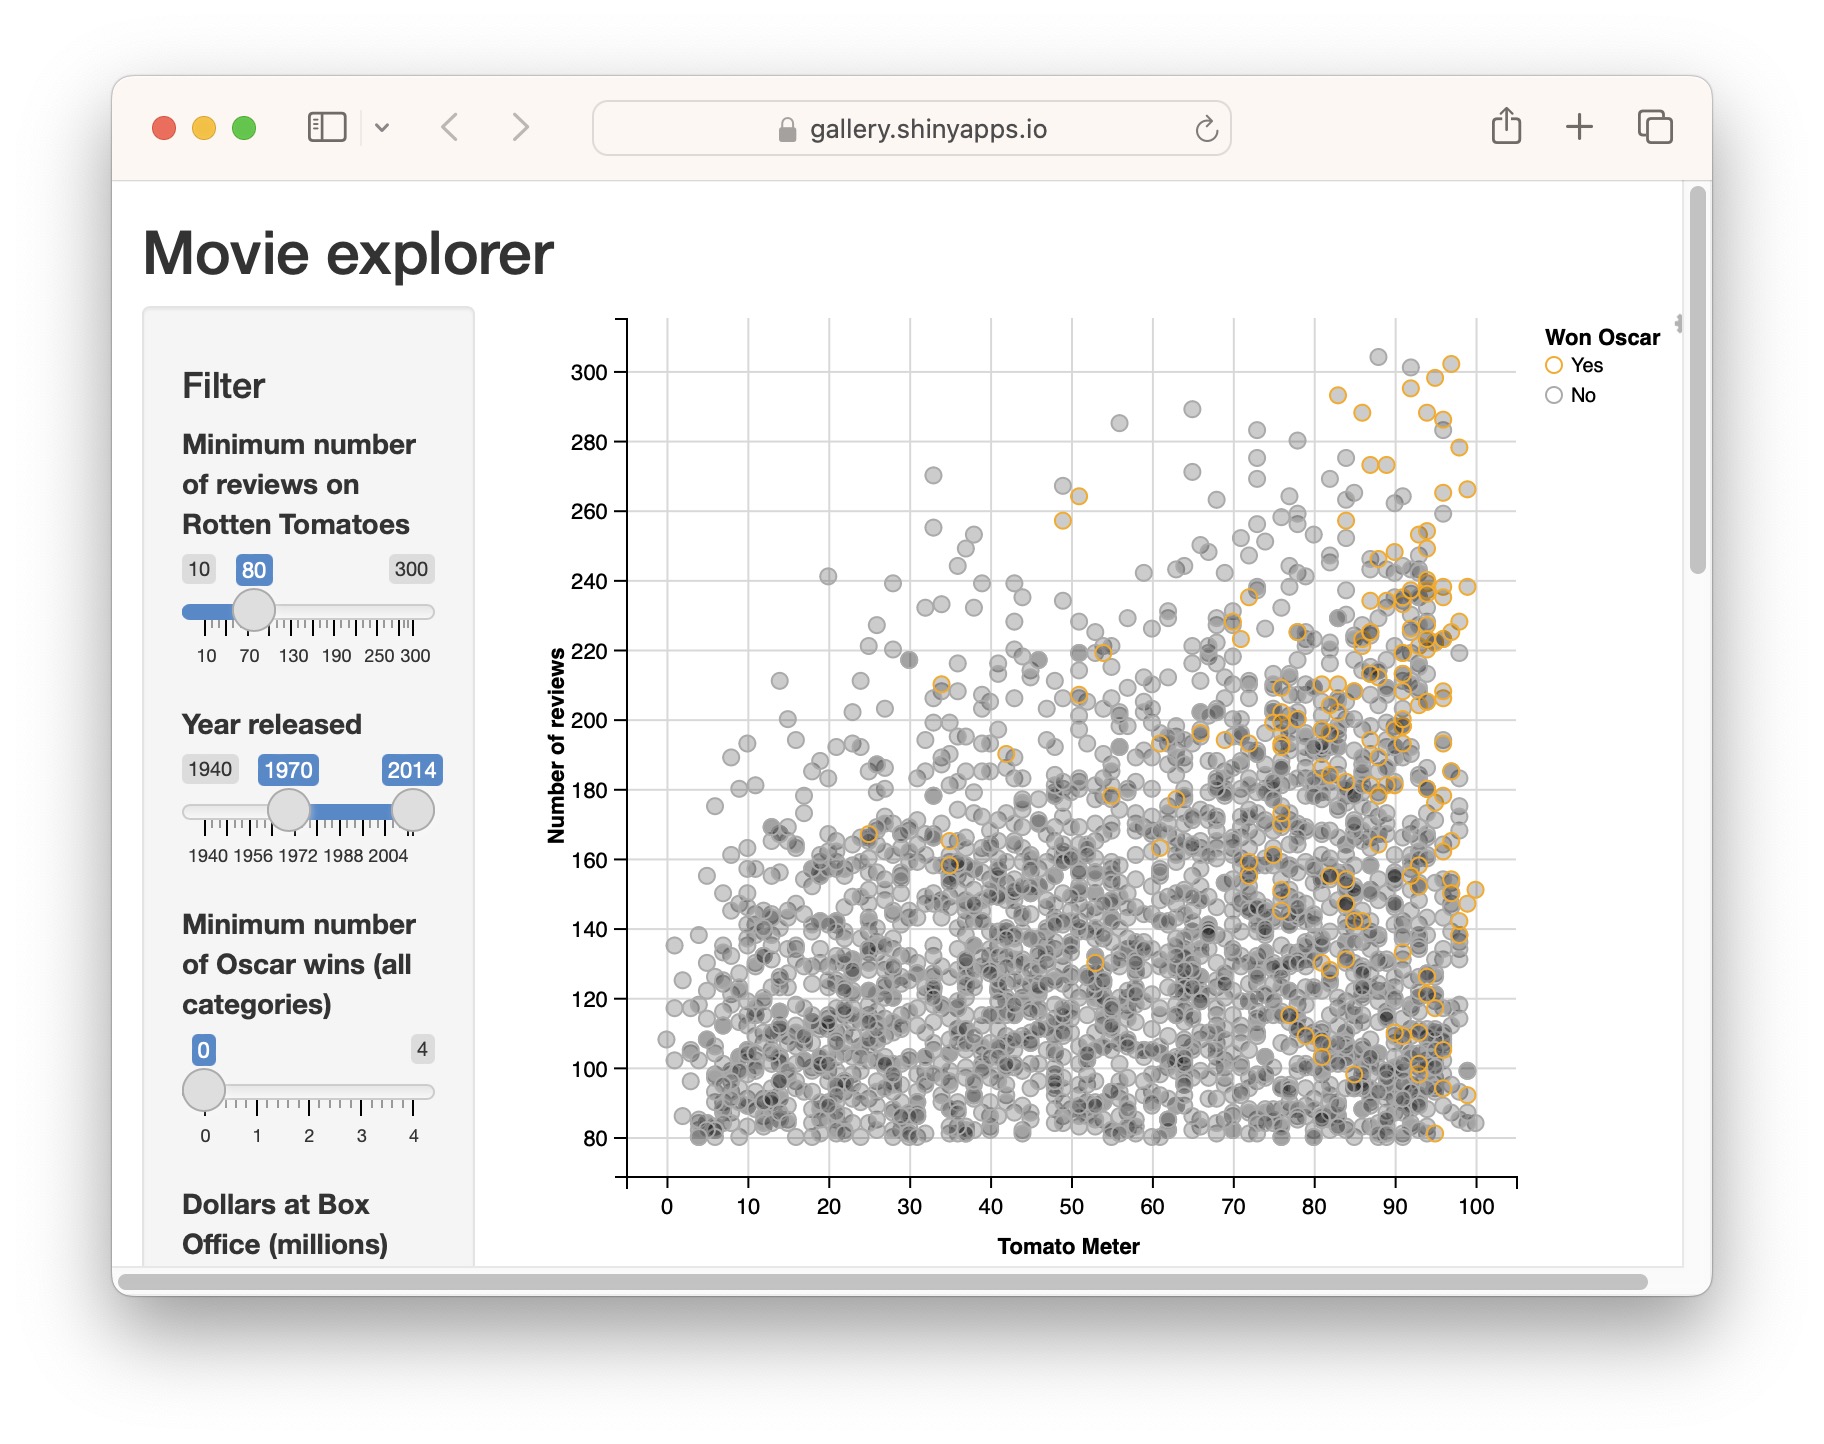

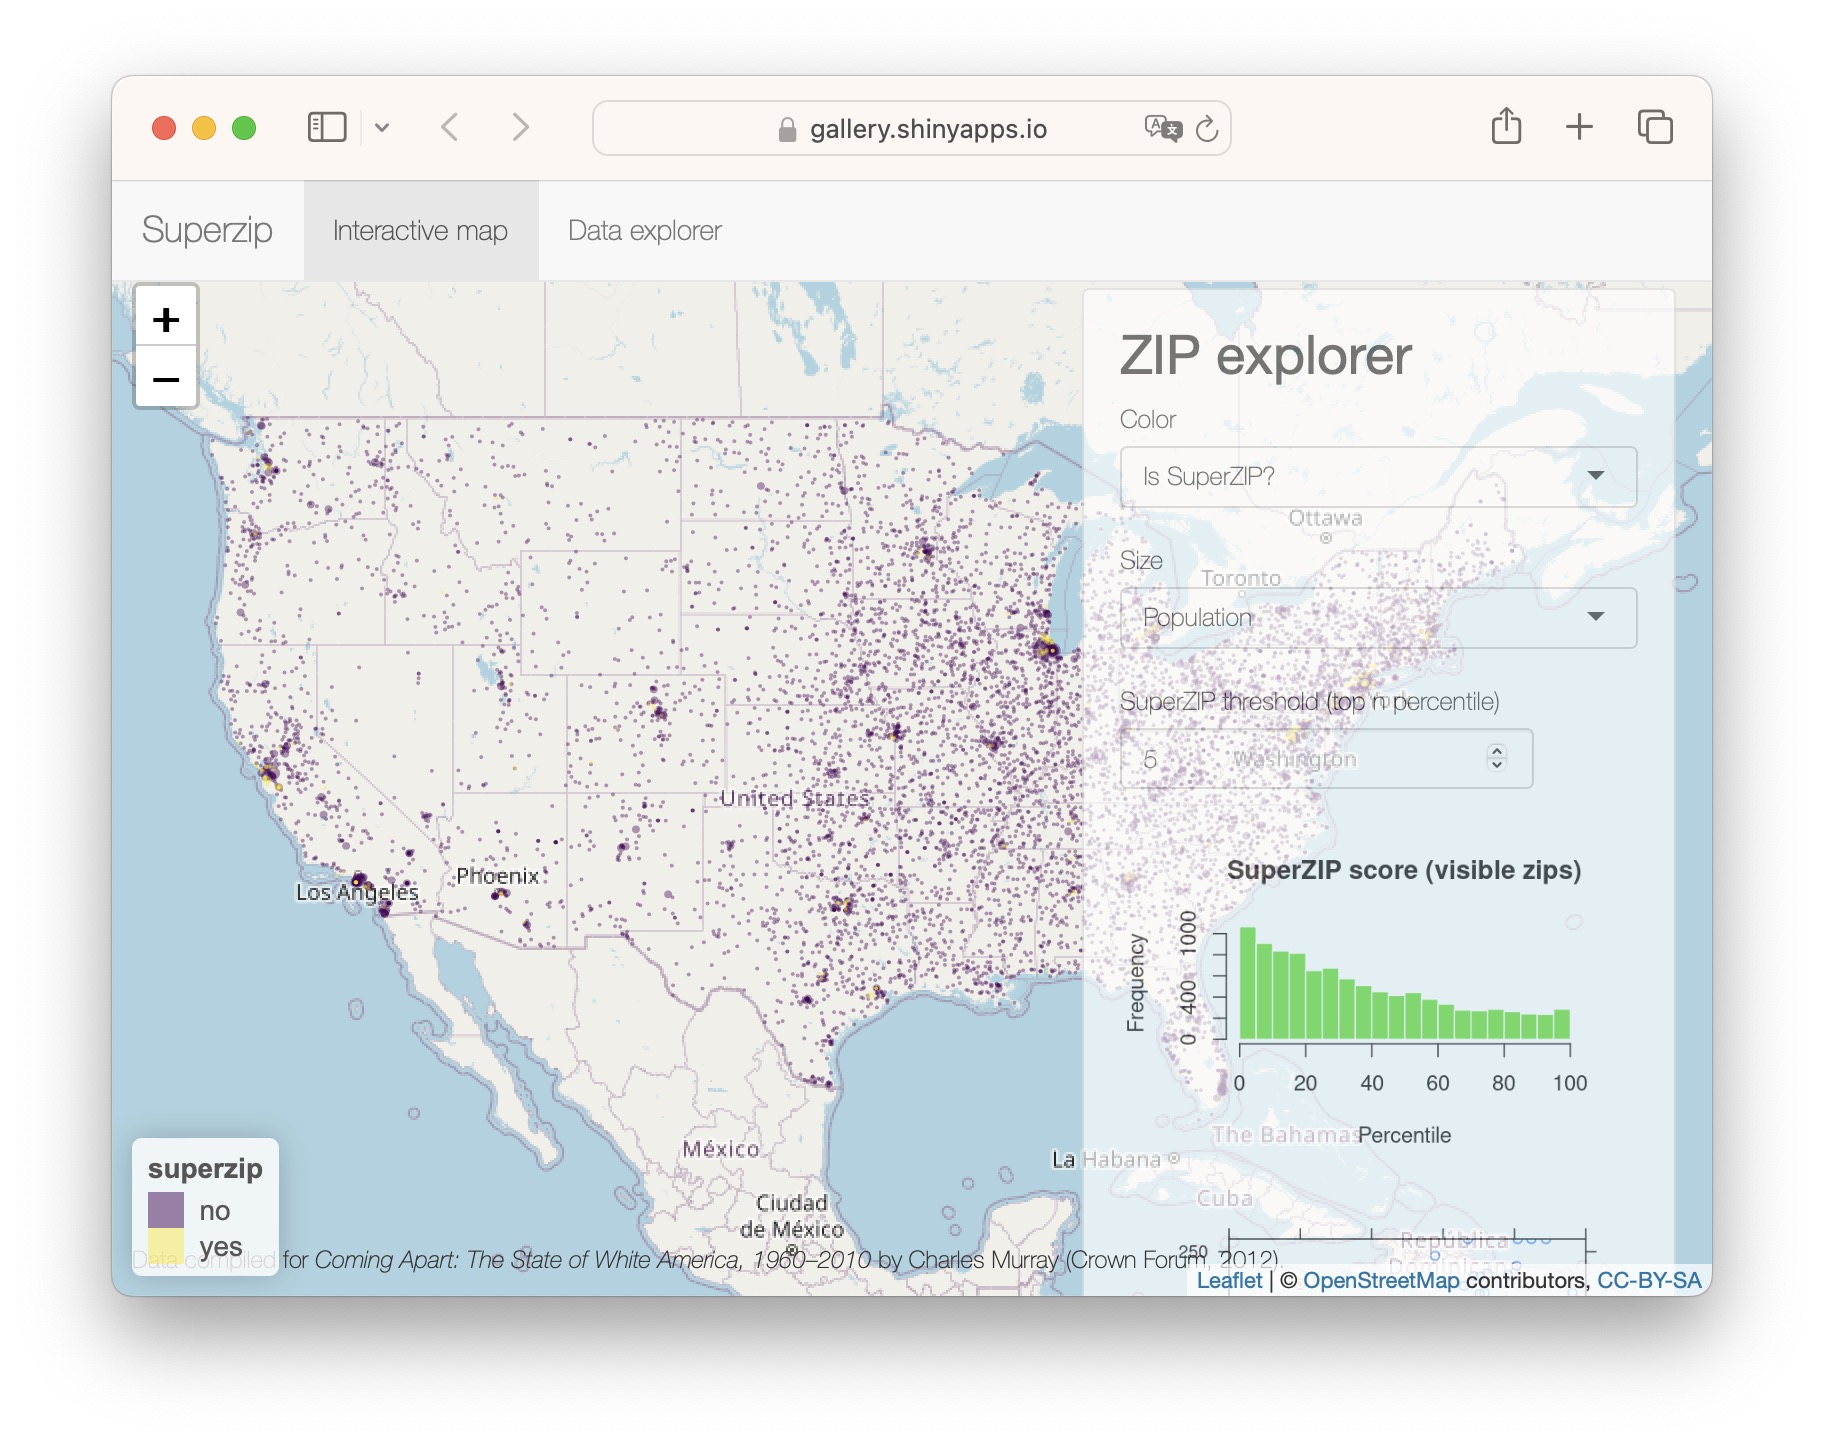

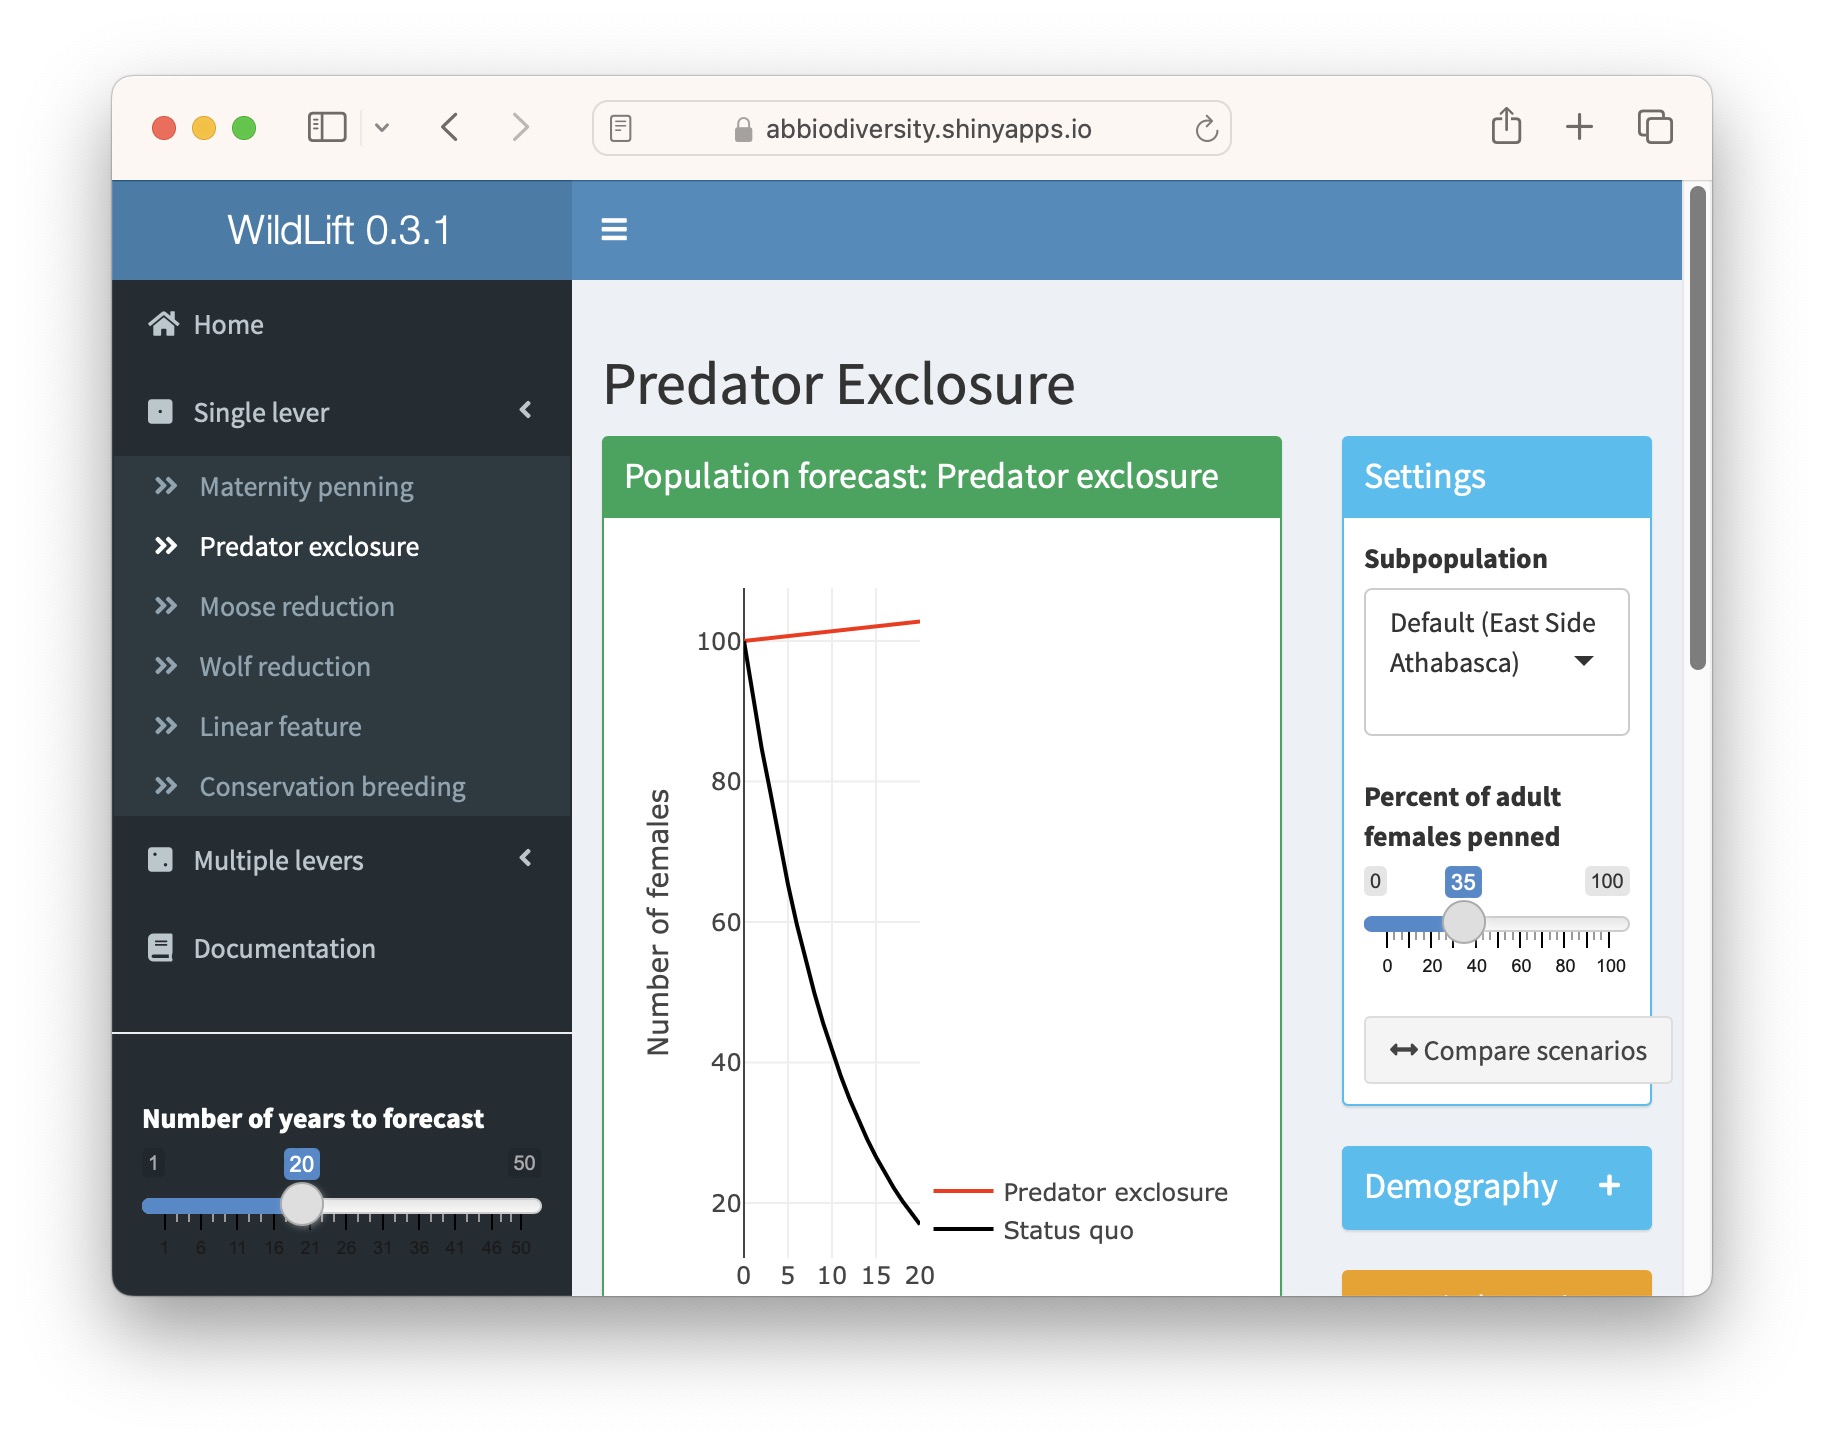
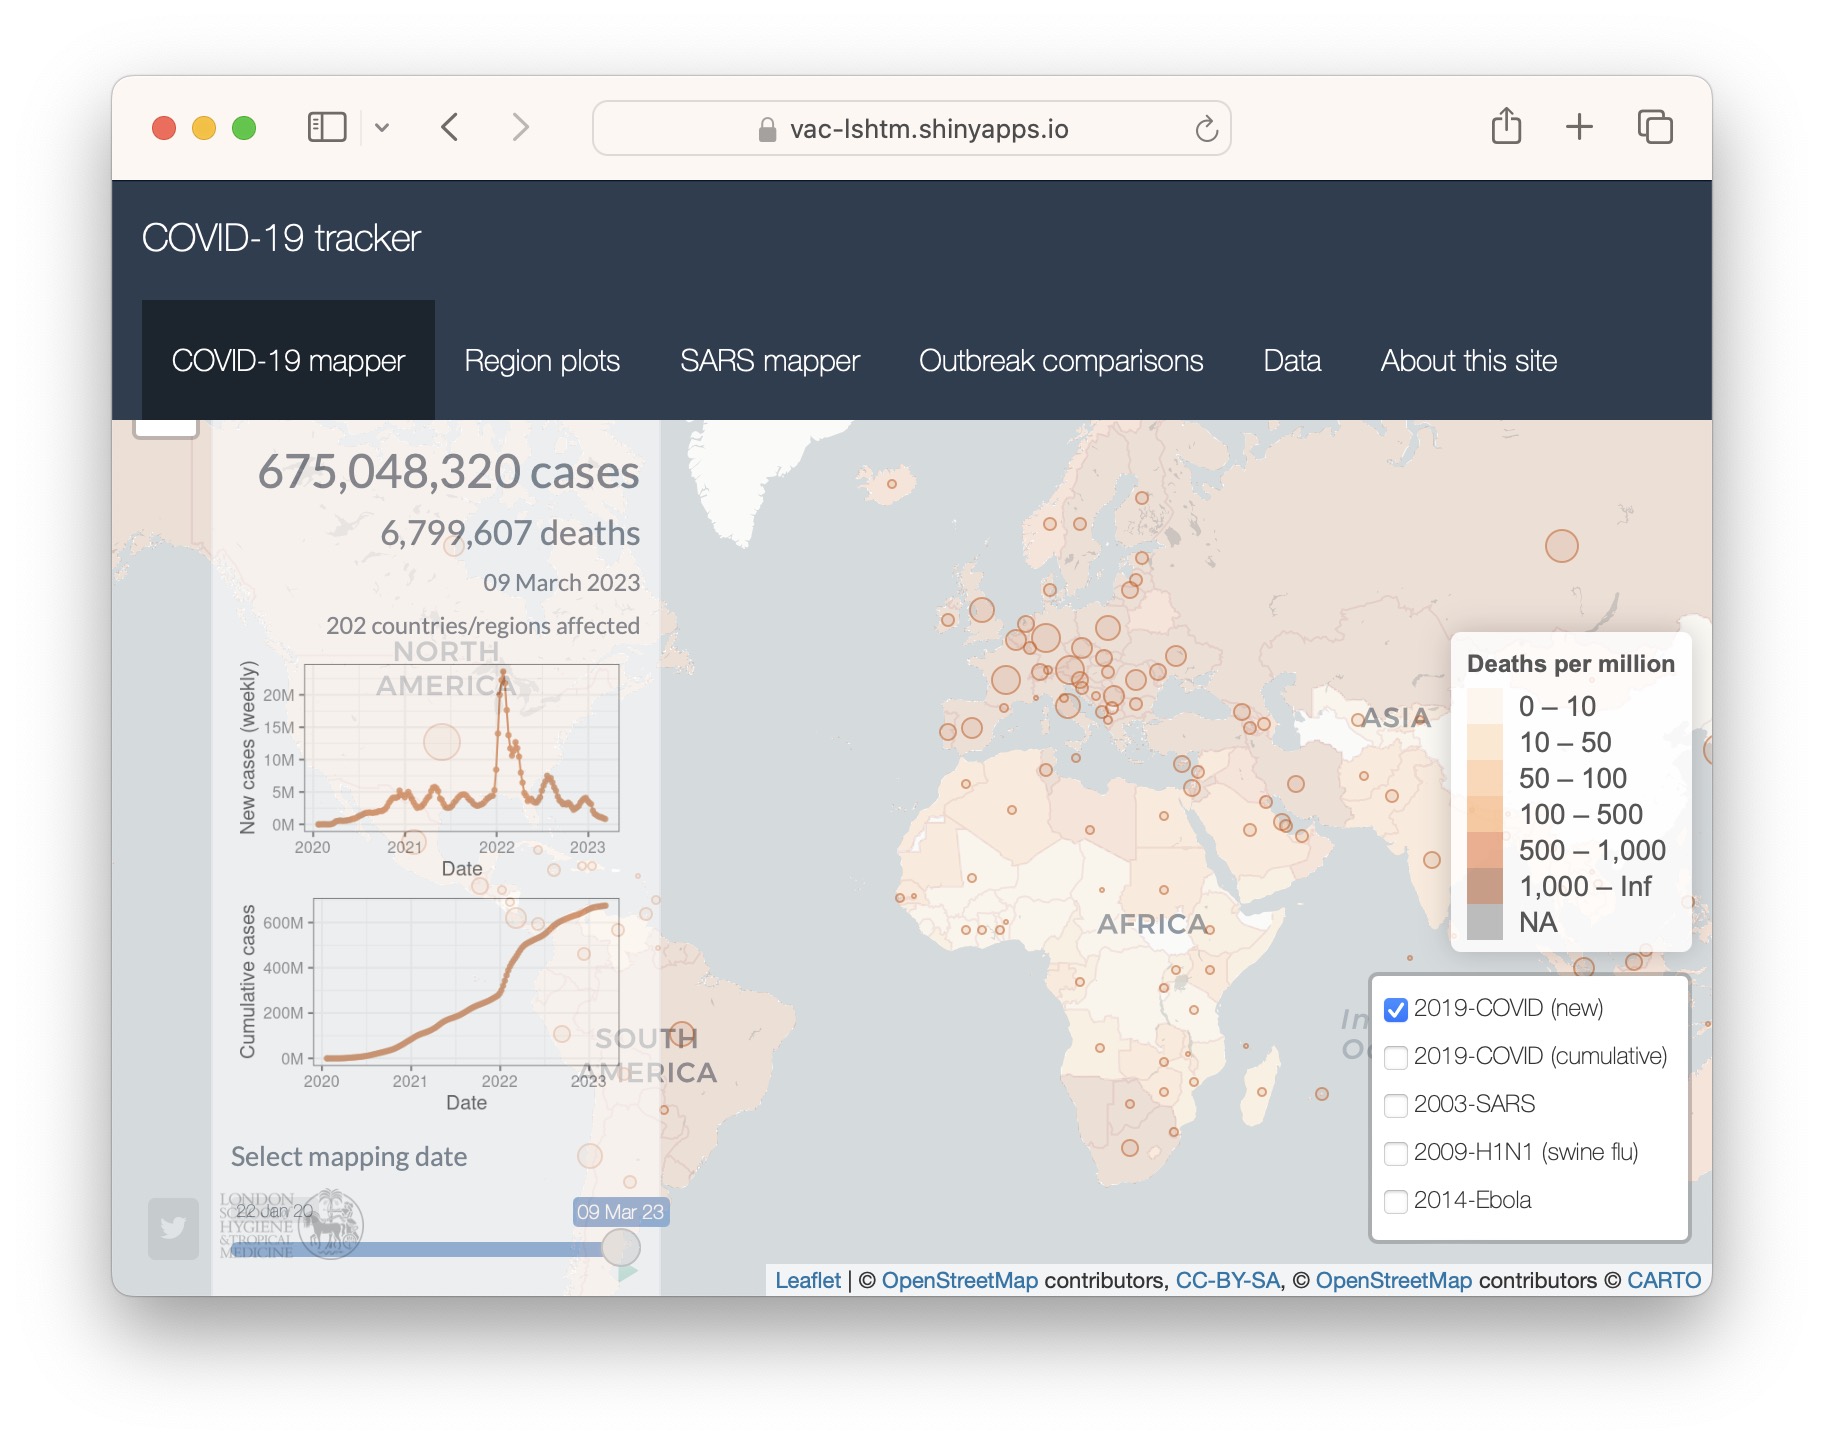
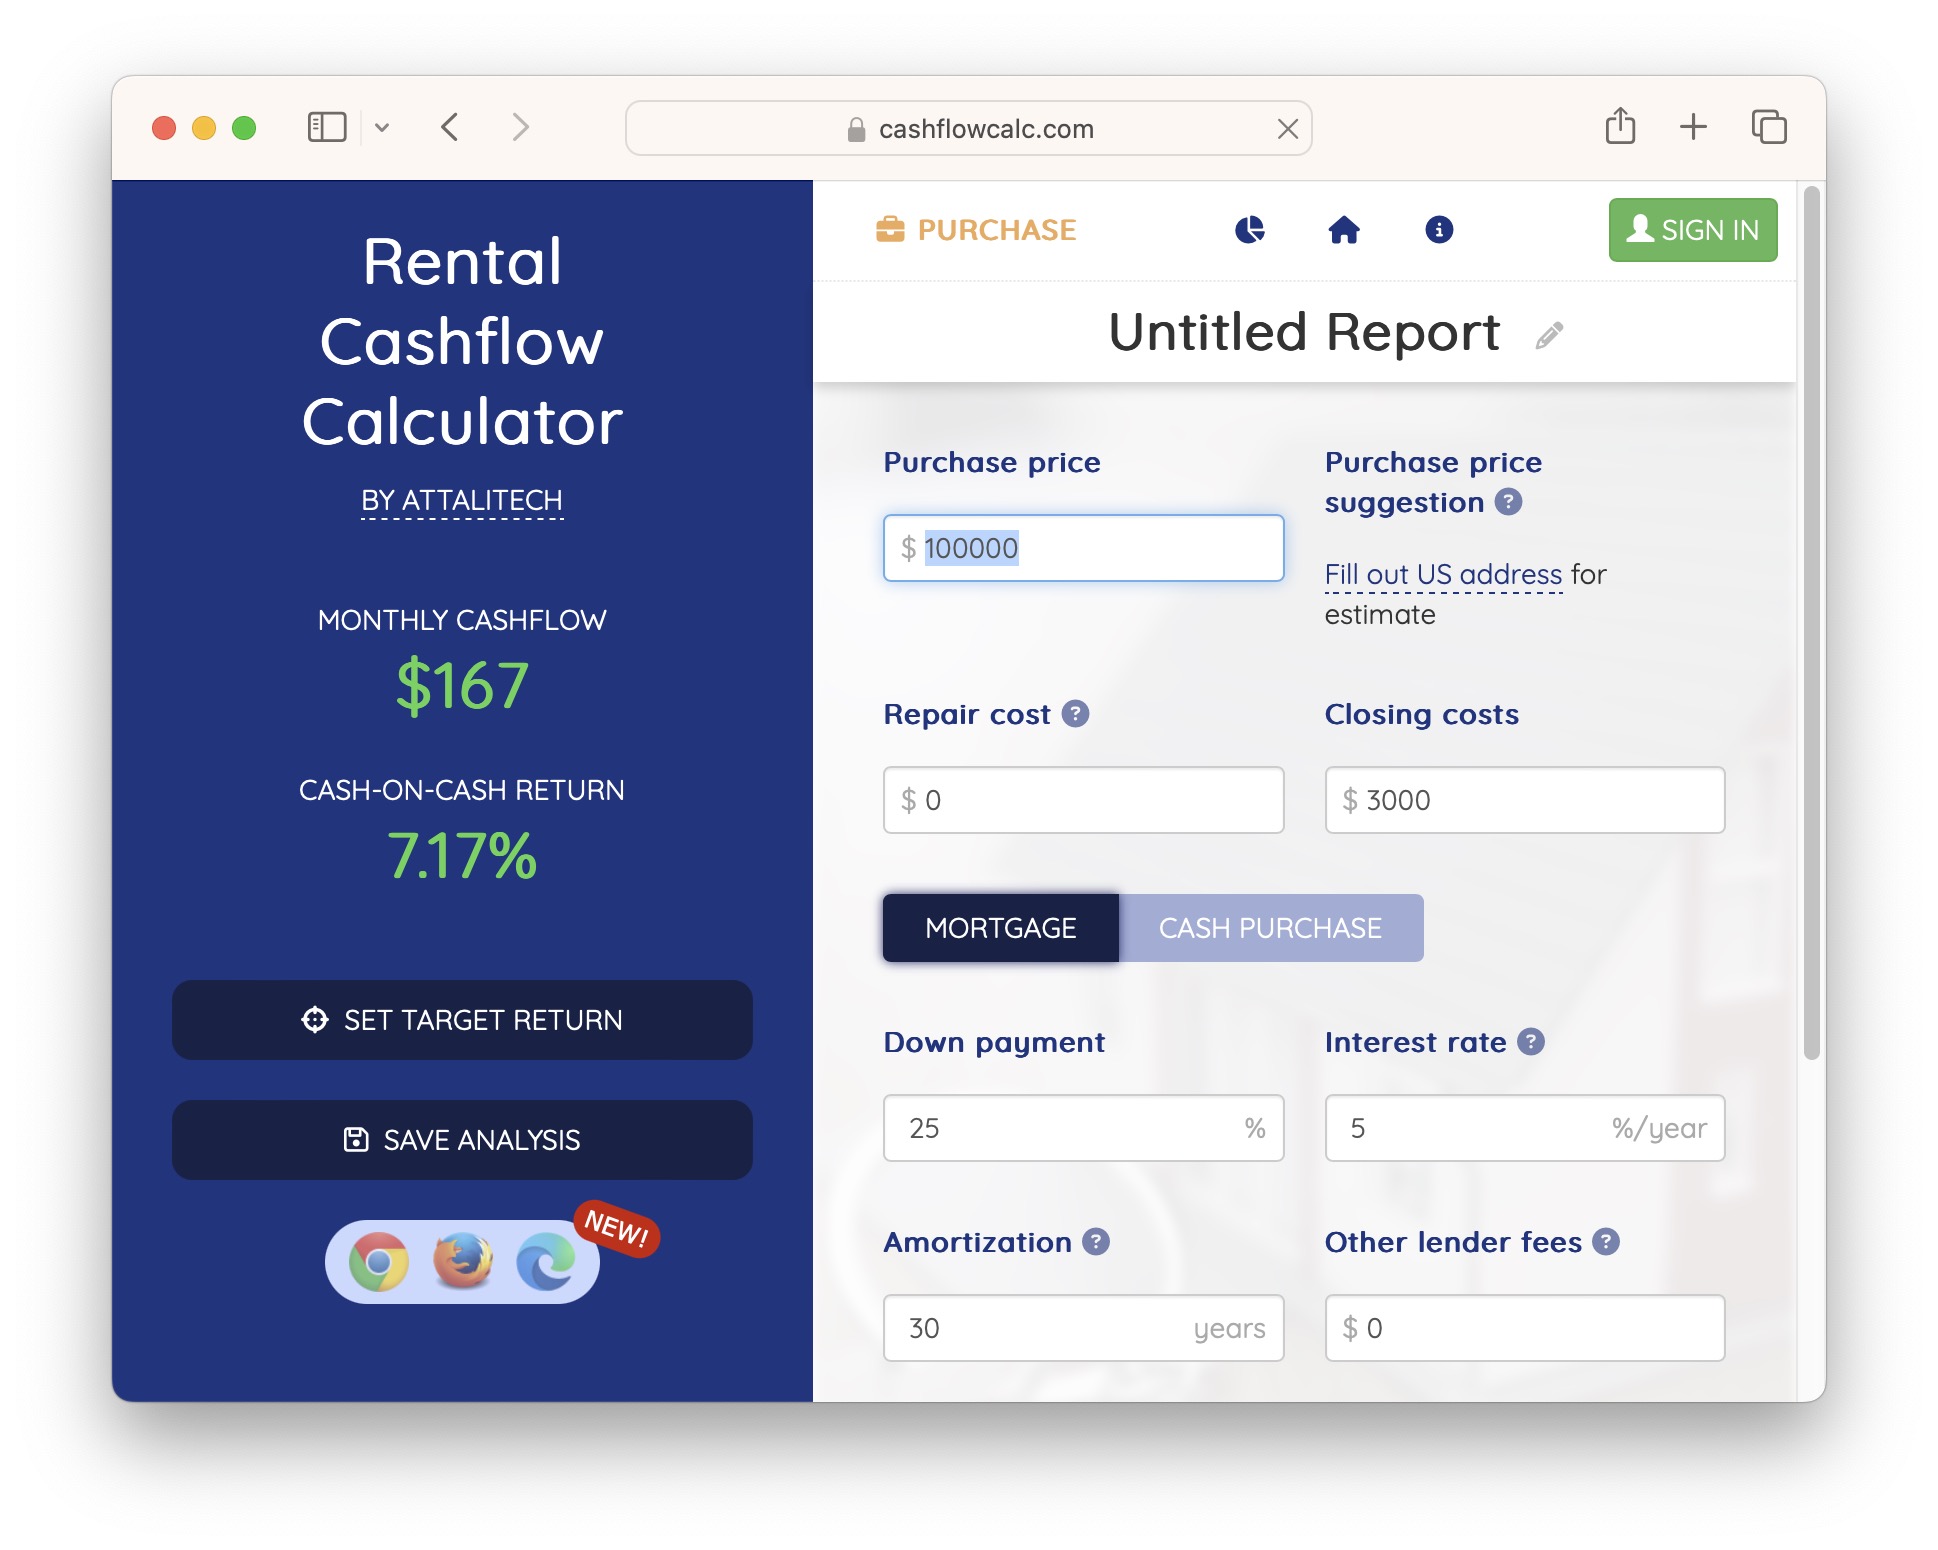

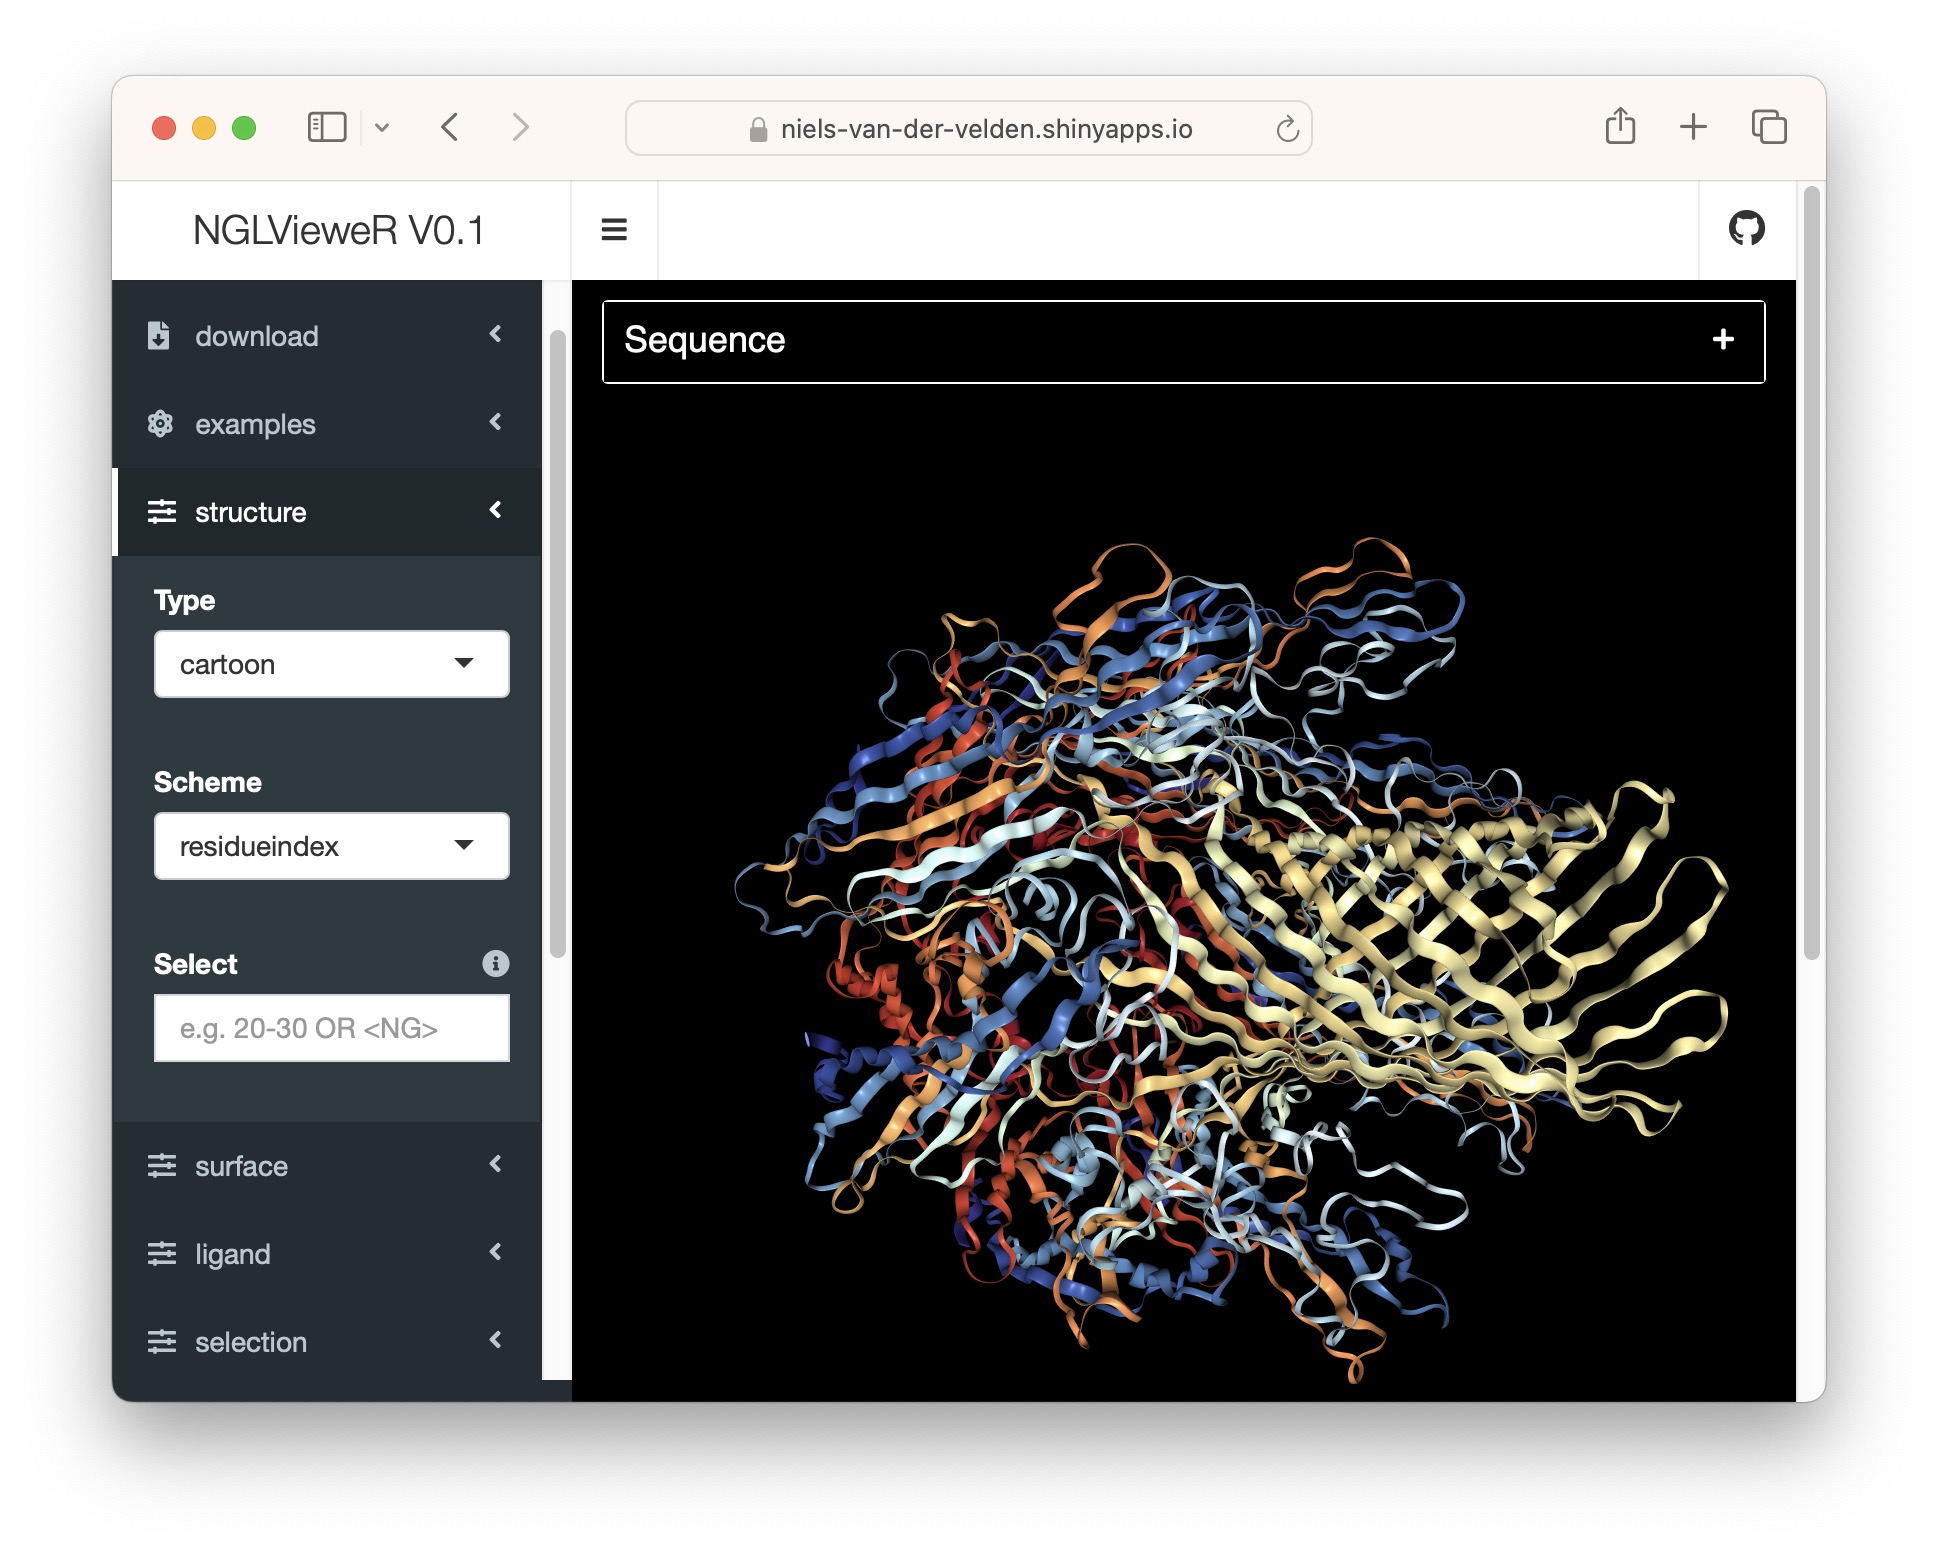
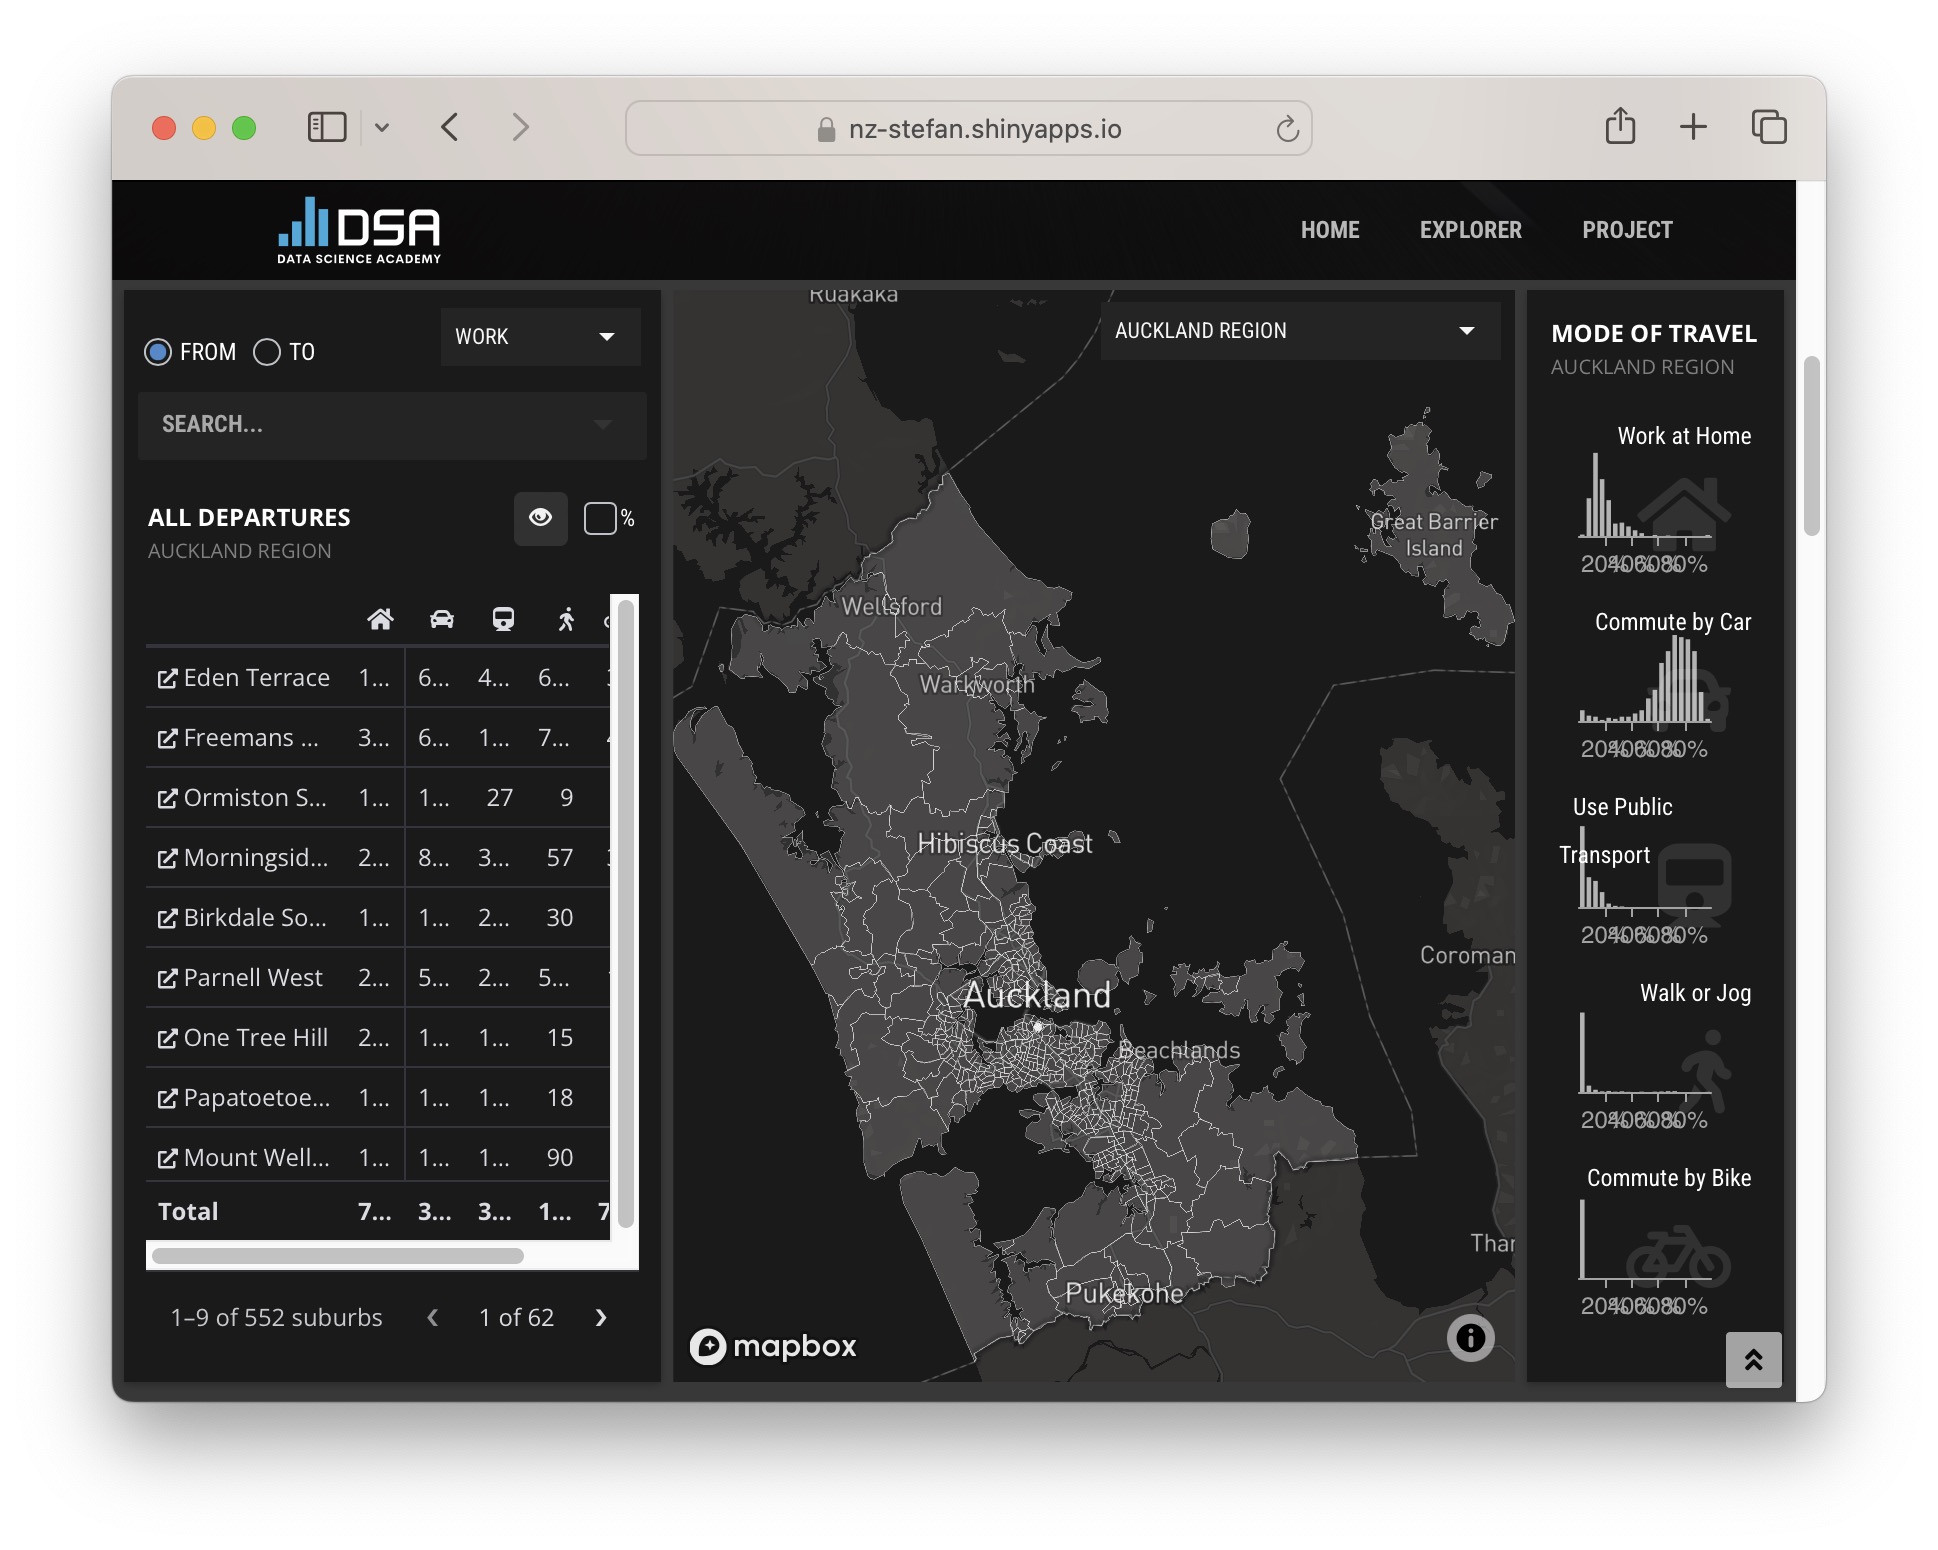
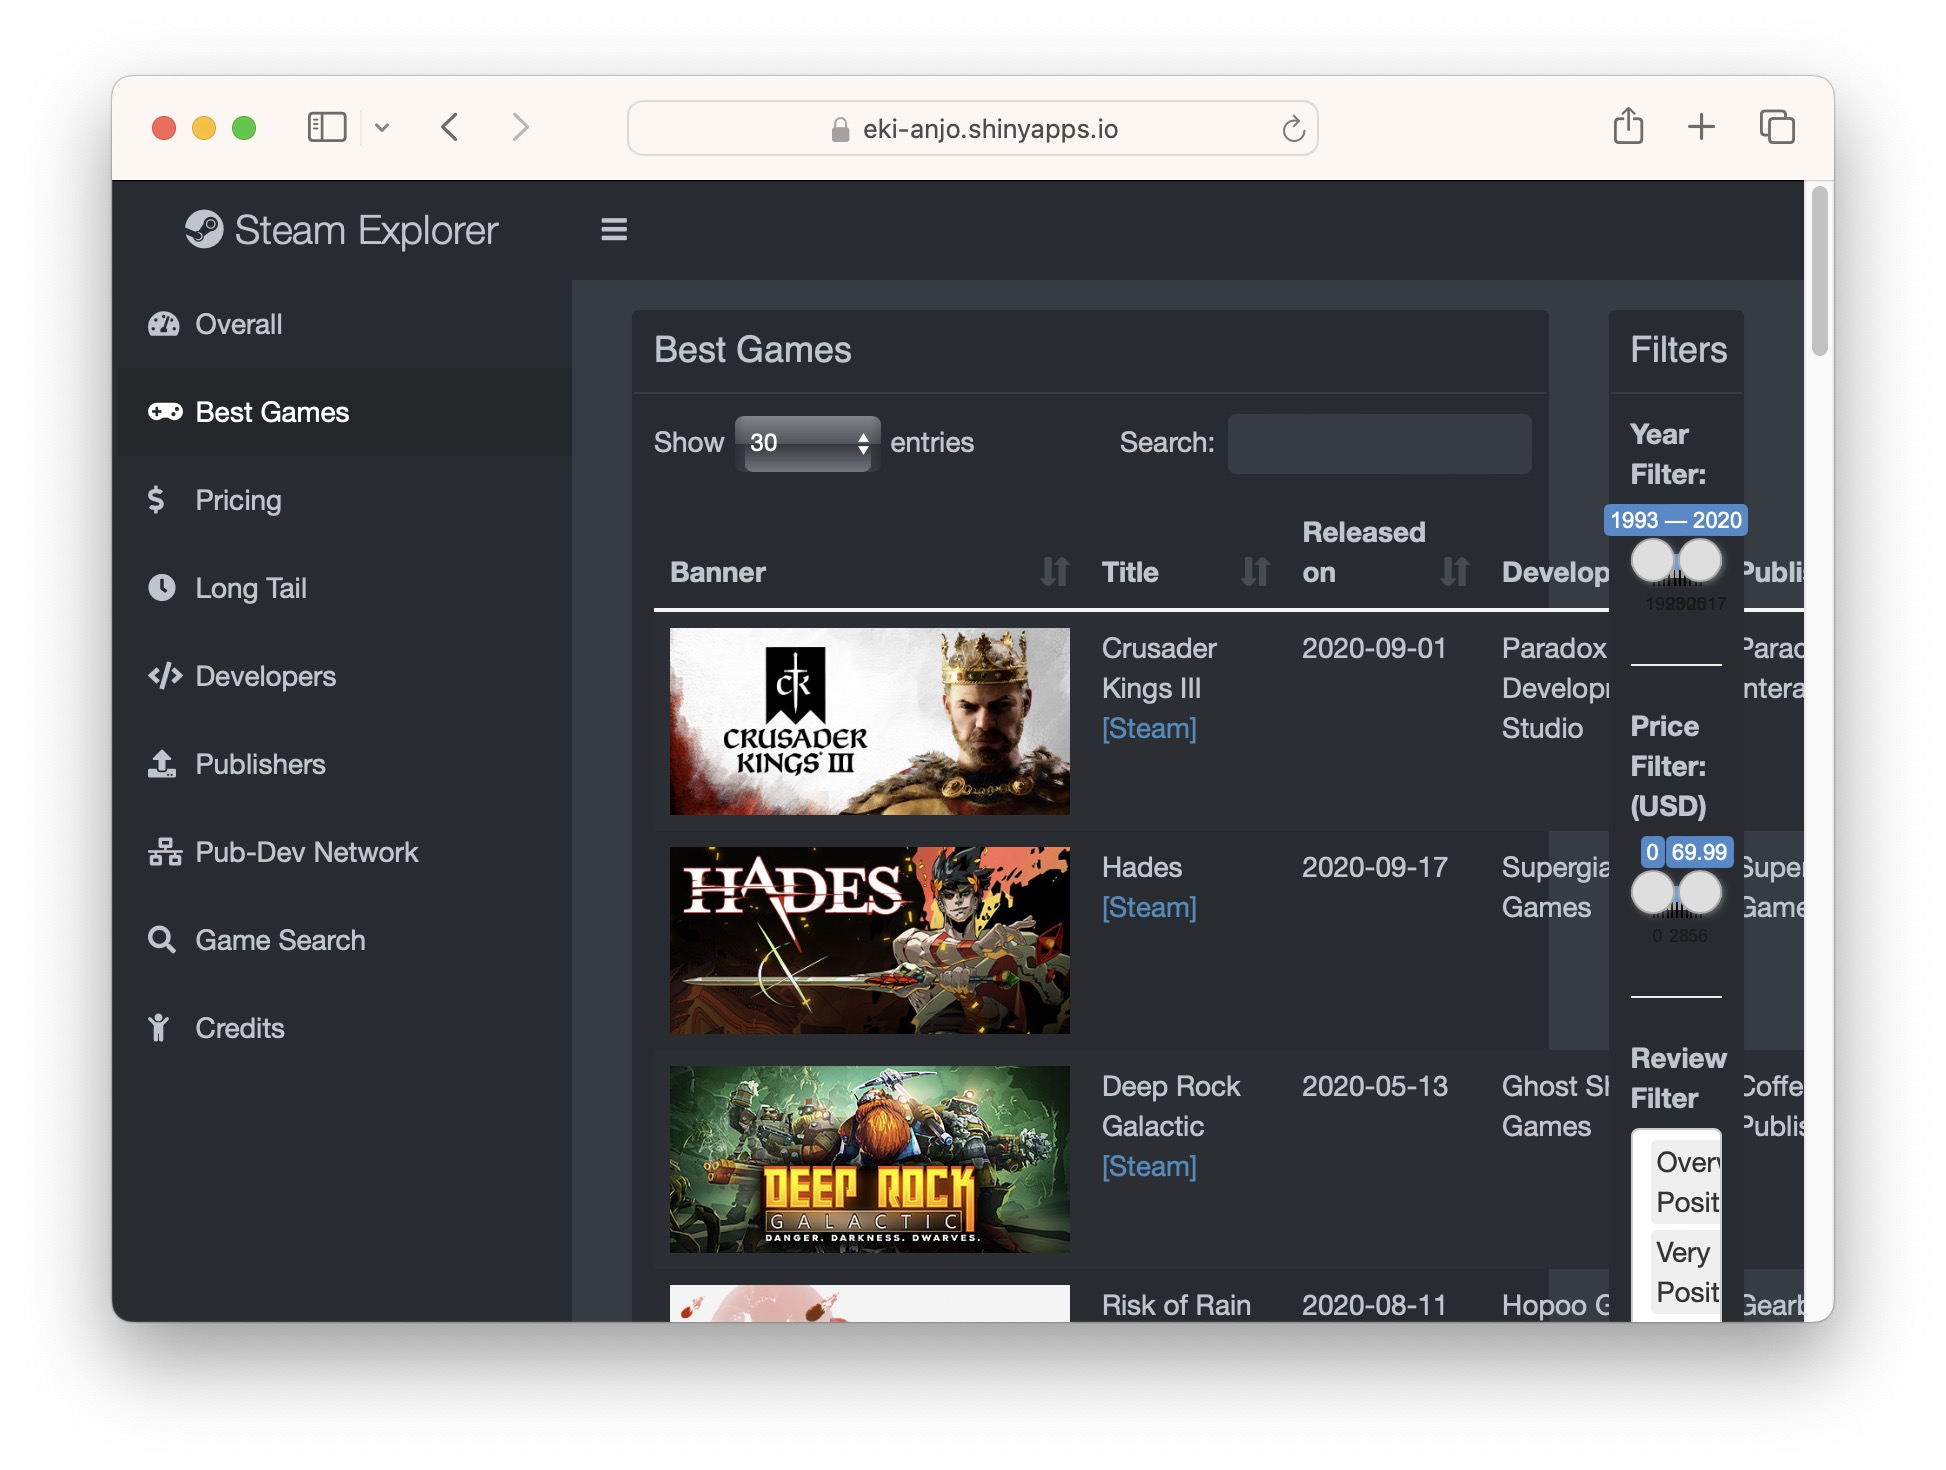

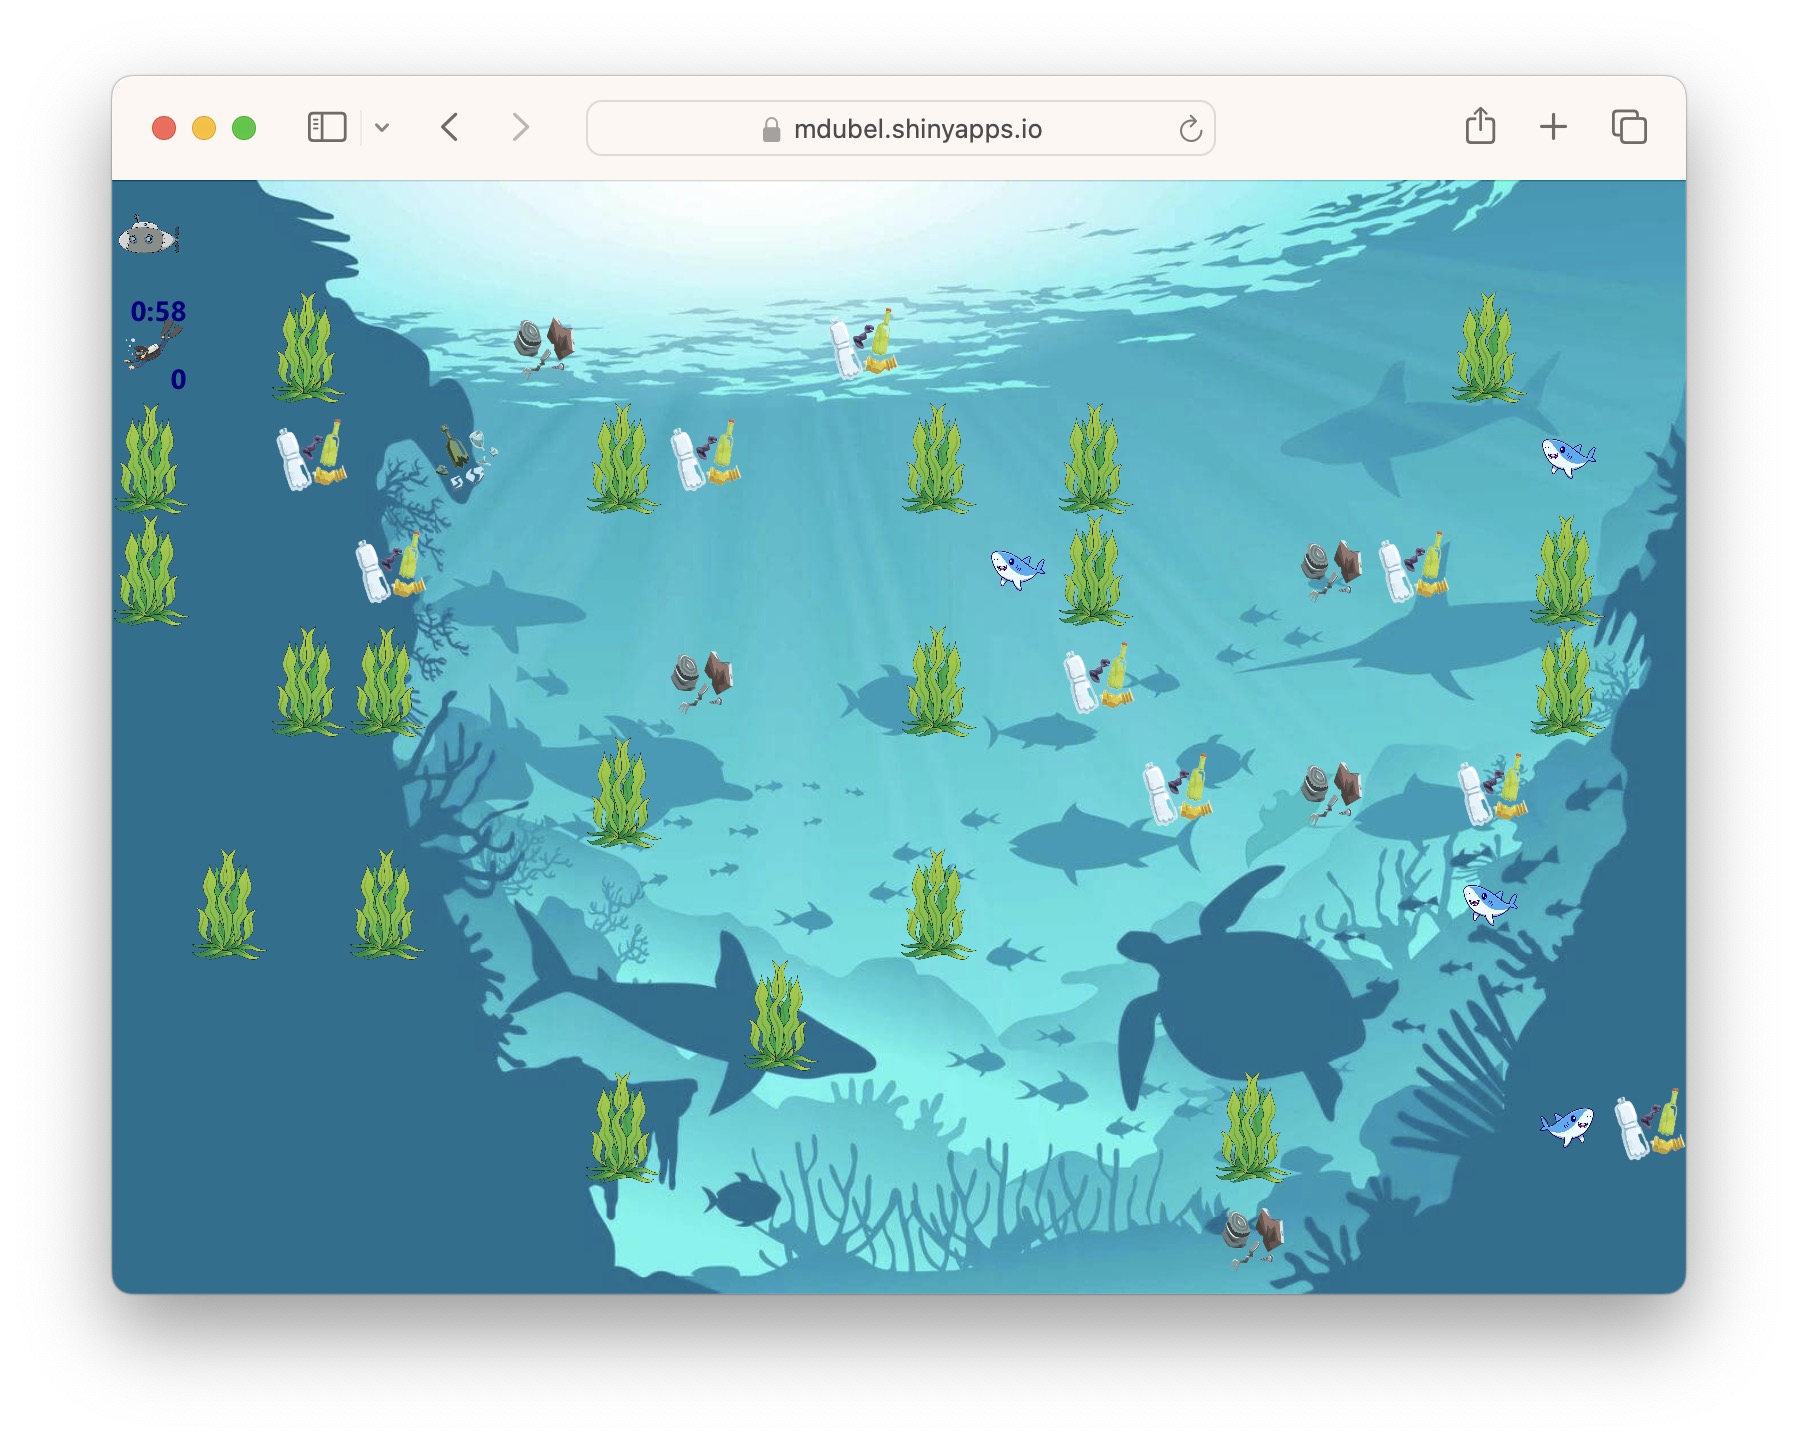
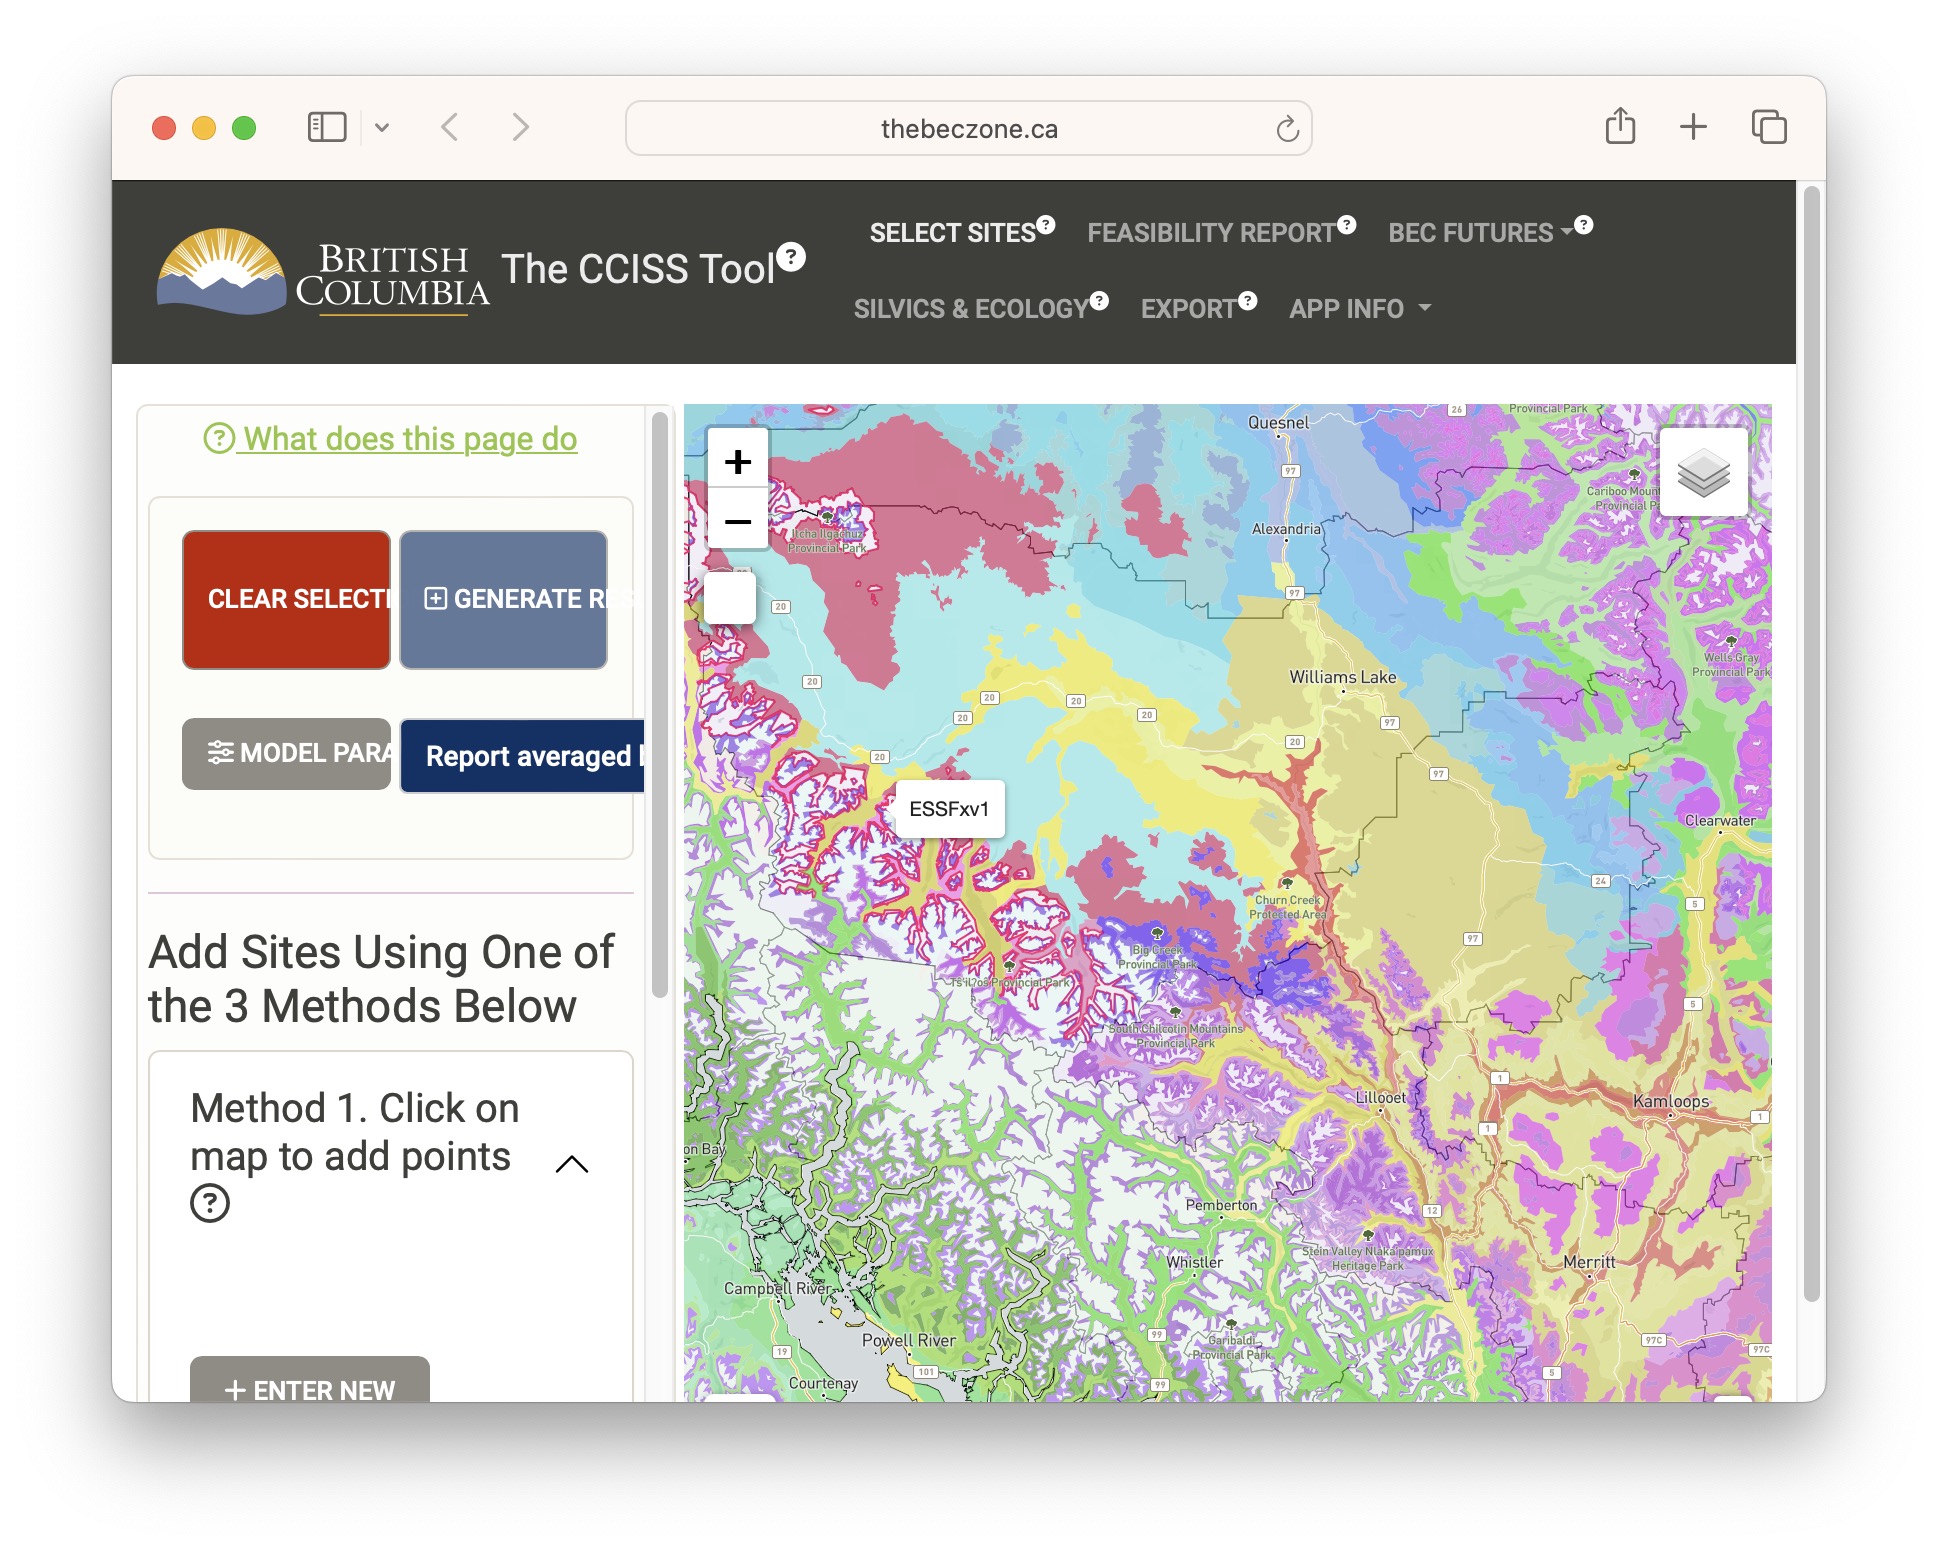
What is shiny?
- Standalone web applications
- Interactive RMarkdown/Quarto documents
- Gadgets/RStudio extensions
- Completely created using R
- Needs a server (live R environment)
App organization
One file format
Running the app
- Run
shiny::runApp("path/to/folder")
- Running as a separate process from terminal
R -e "shiny::runApp('~/shinyapp')"- From Rmd file using
rmarkdown::run()
User Interface (UI)
UI
Language of the web: HTML, CSS & Javascript
Hypertext Markup Language (HTML)
- All UI code is translated to HTML
- Inspect with browser
<div class="col-sm-4">
  <form class="well" role="complementary">
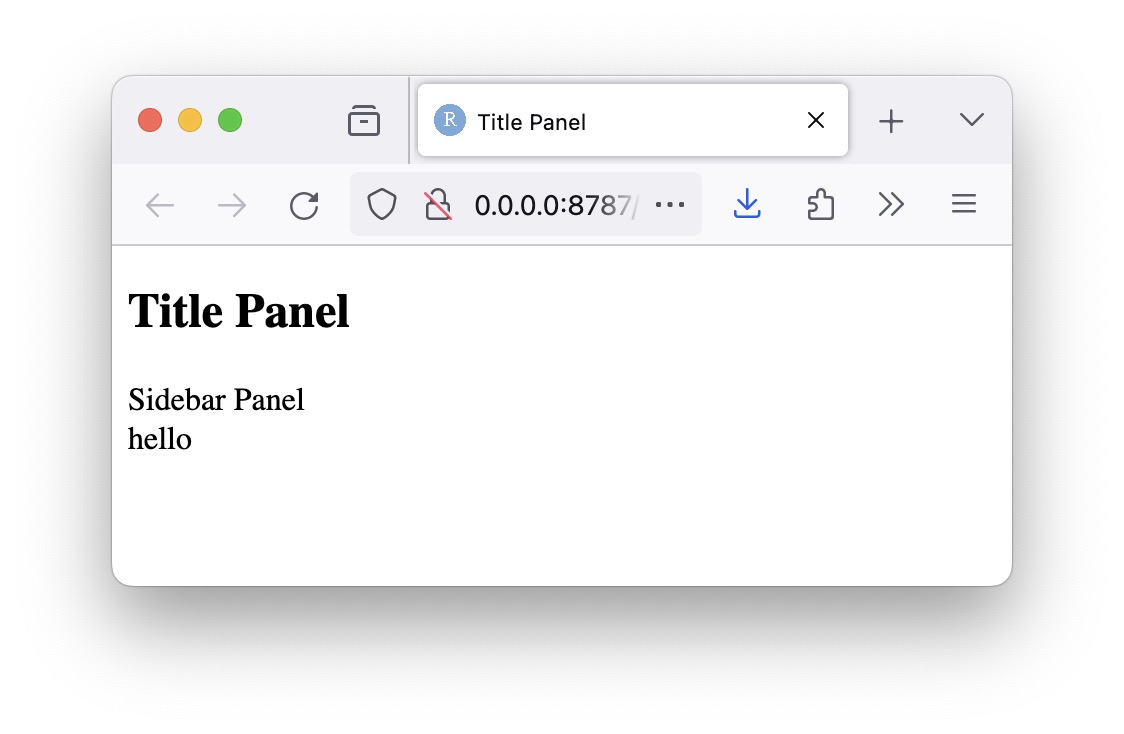
    <span class="help-block">Sidebar Panel</span>
  </form>
</div>#| standalone: true
#| components: [editor, viewer]
#| viewerHeight: 300
shinyApp(
ui=fluidPage(
titlePanel("Title Panel"),
sidebarLayout(sidebarPanel(helpText("Sidebar Panel")),
mainPanel(tabsetPanel(
tabPanel("tab1",
fluidRow(
column(6,helpText("Col1")),
column(6,
helpText("Col2"),
fluidRow(
column(4,style="background-color:#b0c6fb",helpText("Col1")),
column(4,style="background-color:#ffa153",helpText("Col2")),
column(4,style="background-color:#b1f6c6",helpText("Col3"))
)
)
)
),
tabPanel("tab2",
inputPanel(helpText("Input Panel"))
),
tabPanel("tab3",
wellPanel(helpText("Well Panel"))
)
)
)
)
),
server=function(input,output) {})UI • Widgets • Input
UI • Widgets • Input
#| standalone: true
#| components: [editor, viewer]

shinyApp(
ui=fluidPage(
  fluidRow(
    column(4,
           fileInput("file-input","fileInput:"),
           selectInput("select-input",label="selectInput",choices=c("A","B","C")),
           sliderInput("slider-input",label="sliderInput",value=5,min=1,max=10),
           numericInput("numeric-input",label="numericInput",value=5,min=1,max=10),
           textInput("text-input",label="textInput"),
           textAreaInput("text-area-input",label="textAreaInput"),
           dateInput("date-input",label="dateInput"),
           dateRangeInput("date-range-input",label="dateRangeInput"),
           radioButtons("radio-button",label="radioButtons",choices=c("A","B","C"),inline=T),
           checkboxInput("checkbox","checkboxInput",value=FALSE),
           actionButton("action-button","Action"),
           hr(),
           submitButton()
    )
  )
),
server=function(input,output) {
})
UI • Widgets • Input Functions
| Function | Description |
|---|---|
checkboxInput() |
Checkbox |
checkboxGroupInput() |
Checkbox group |
radioButtons() |
Radio buttons |
dateInput() |
Single date |
dateRangeInput() |
Date range |
fileInput() |
Upload file |
numericInput() |
Input number |
sliderInput() |
Input number |
| Function | Description |
|---|---|
textInput() |
Single line text input |
textAreaInput() |
Multi-line text input |
passwordInput() |
Password input |
selectInput() |
Dropdown selection |
actionButton() |
Action button |
submitButton() |
Submit button |
tabsetPanel() |
Tabset panel |
navbarPage() |
Page with navbar |
UI • Widgets • Outputs
UI • Widgets • Outputs
#| standalone: true
#| components: [editor, viewer]
shinyApp(
ui=fluidPage(fluidRow(column(5,
           textInput("text_input",label="textInput",value="<h3 style='color:red'>Red text</h3>"),
           hr(),
           htmlOutput("html_output"),
           textOutput("text_output"),
           verbatimTextOutput("verbatim_text_output"),
           tableOutput("table_output"),
           plotOutput("plot_output",width="300px",height="300px")
    ))),

server=function(input, output) {
  output$html_output <- renderText({input$text_input})
  output$text_output <- renderText({input$text_input})
  output$verbatim_text_output <- renderText({input$text_input})
  output$table_output <- renderTable({iris[1:3,1:3]})
  output$plot_output <- renderPlot({
    plot(iris[,1],iris[,2])
  })
})
UI • Widgets • Output Functions
| Output | Renderer | Description |
|---|---|---|
textOutput() |
renderText()/renderPrint() |
Standard text |
verbatimTextOutput() |
renderText()/renderPrint() |
Monospaced text |
htmlOutput() |
renderText()/renderPrint() |
HTML text output |
plotOutput() |
renderPlot() |
Create and display image |
imageOutput() |
renderImage() |
Display existing image |
tableOutput() |
renderTable() |
Table output |
uiOutput() |
renderUI() |
HTML components |
A complete app
#| standalone: true
#| components: [editor, viewer]
shinyApp(
ui = fluidPage(
  h3("Temperature Converter"),
  numericInput("celsius", "Degrees Celsius:", value = 0),
  textOutput("fahrenheit")
),

server = function(input, output) {
  output$fahrenheit <- renderText({
    paste(input$celsius, "°C is ", (input$celsius * 9/5) + 32, " °F")
  })
})
Rendering UI
- UI elements are created conditionally using
uiOutput()/renderUI()
shinyApp(
ui=fluidPage(
  selectInput("type",label="Select input type", choices=c("Text","Number")),
  uiOutput("ui"),
  textOutput("text_output"),
),

server=function(input, output) {

 output$ui <- renderUI({
    if(input$type=="Text") {
      textInput("input_text","Enter text")
    }else{
      sliderInput("input_number", "Select number", value=5, min=1, max=10)
    }
  })

  output$text_output <- renderText({
    if(input$type=="Text") {
      input$input_text
    }else{
      input$input_number
    }
  })
})- Other options include
conditionalPanel(),insertUI()andremoveUI()
Rendering UI
#| standalone: true
#| components: [editor, viewer]
shinyApp(
ui=fluidPage(
  selectInput("type", label="Select input type", choices=c("Text","Number")),
  uiOutput("ui"),
  textOutput("text_output"),
),

server=function(input, output) {

 output$ui <- renderUI({
    if(input$type=="Text") {
      textInput("input_text", "Enter text", value="hello")
    }else{
      sliderInput("input_number", "Select number", value=5, min=1, max=10)
    }
  })

  output$text_output <- renderText({
    if(input$type=="Text") {
      input$input_text
    }else{
      input$input_number
    }
  })
})
Rendering UI
#| standalone: true
#| components: [editor, viewer]

shinyApp(
ui=fluidPage(
  selectInput("data",label="Select data",
              choices=c("mtcars","faithful","iris")),
  tableOutput("table"),
  uiOutput("ui")
),

server=function(input, output) {

  data <- reactive({ get(input$data, 'package:datasets') })

 output$ui <- renderUI({
  if(input$data=="iris") plotOutput("plot",width="400px")
  })

  output$plot <- renderPlot({hist(data()[, 1])})
  output$table <- renderTable({head(data())})
})
Rendering UI
#| standalone: true
#| components: [editor, viewer]

shinyApp(
ui=fluidPage(
  sliderInput("persons",label="Select number of persons", value=1, min=1,max=4),
  uiOutput("ui")
),

server=function(input, output) {
  output$ui <- renderUI({
    lapply(1:input$persons, function(i) {
         div(
           textInput(paste0("name",i),"Enter name:",paste0("Person ",i)),
           textInput(paste0("tel",i),"Enter phone number:",value = "0773921562"),
           hr()
         )
    })
  })
})
Reactive programming
Reactivity
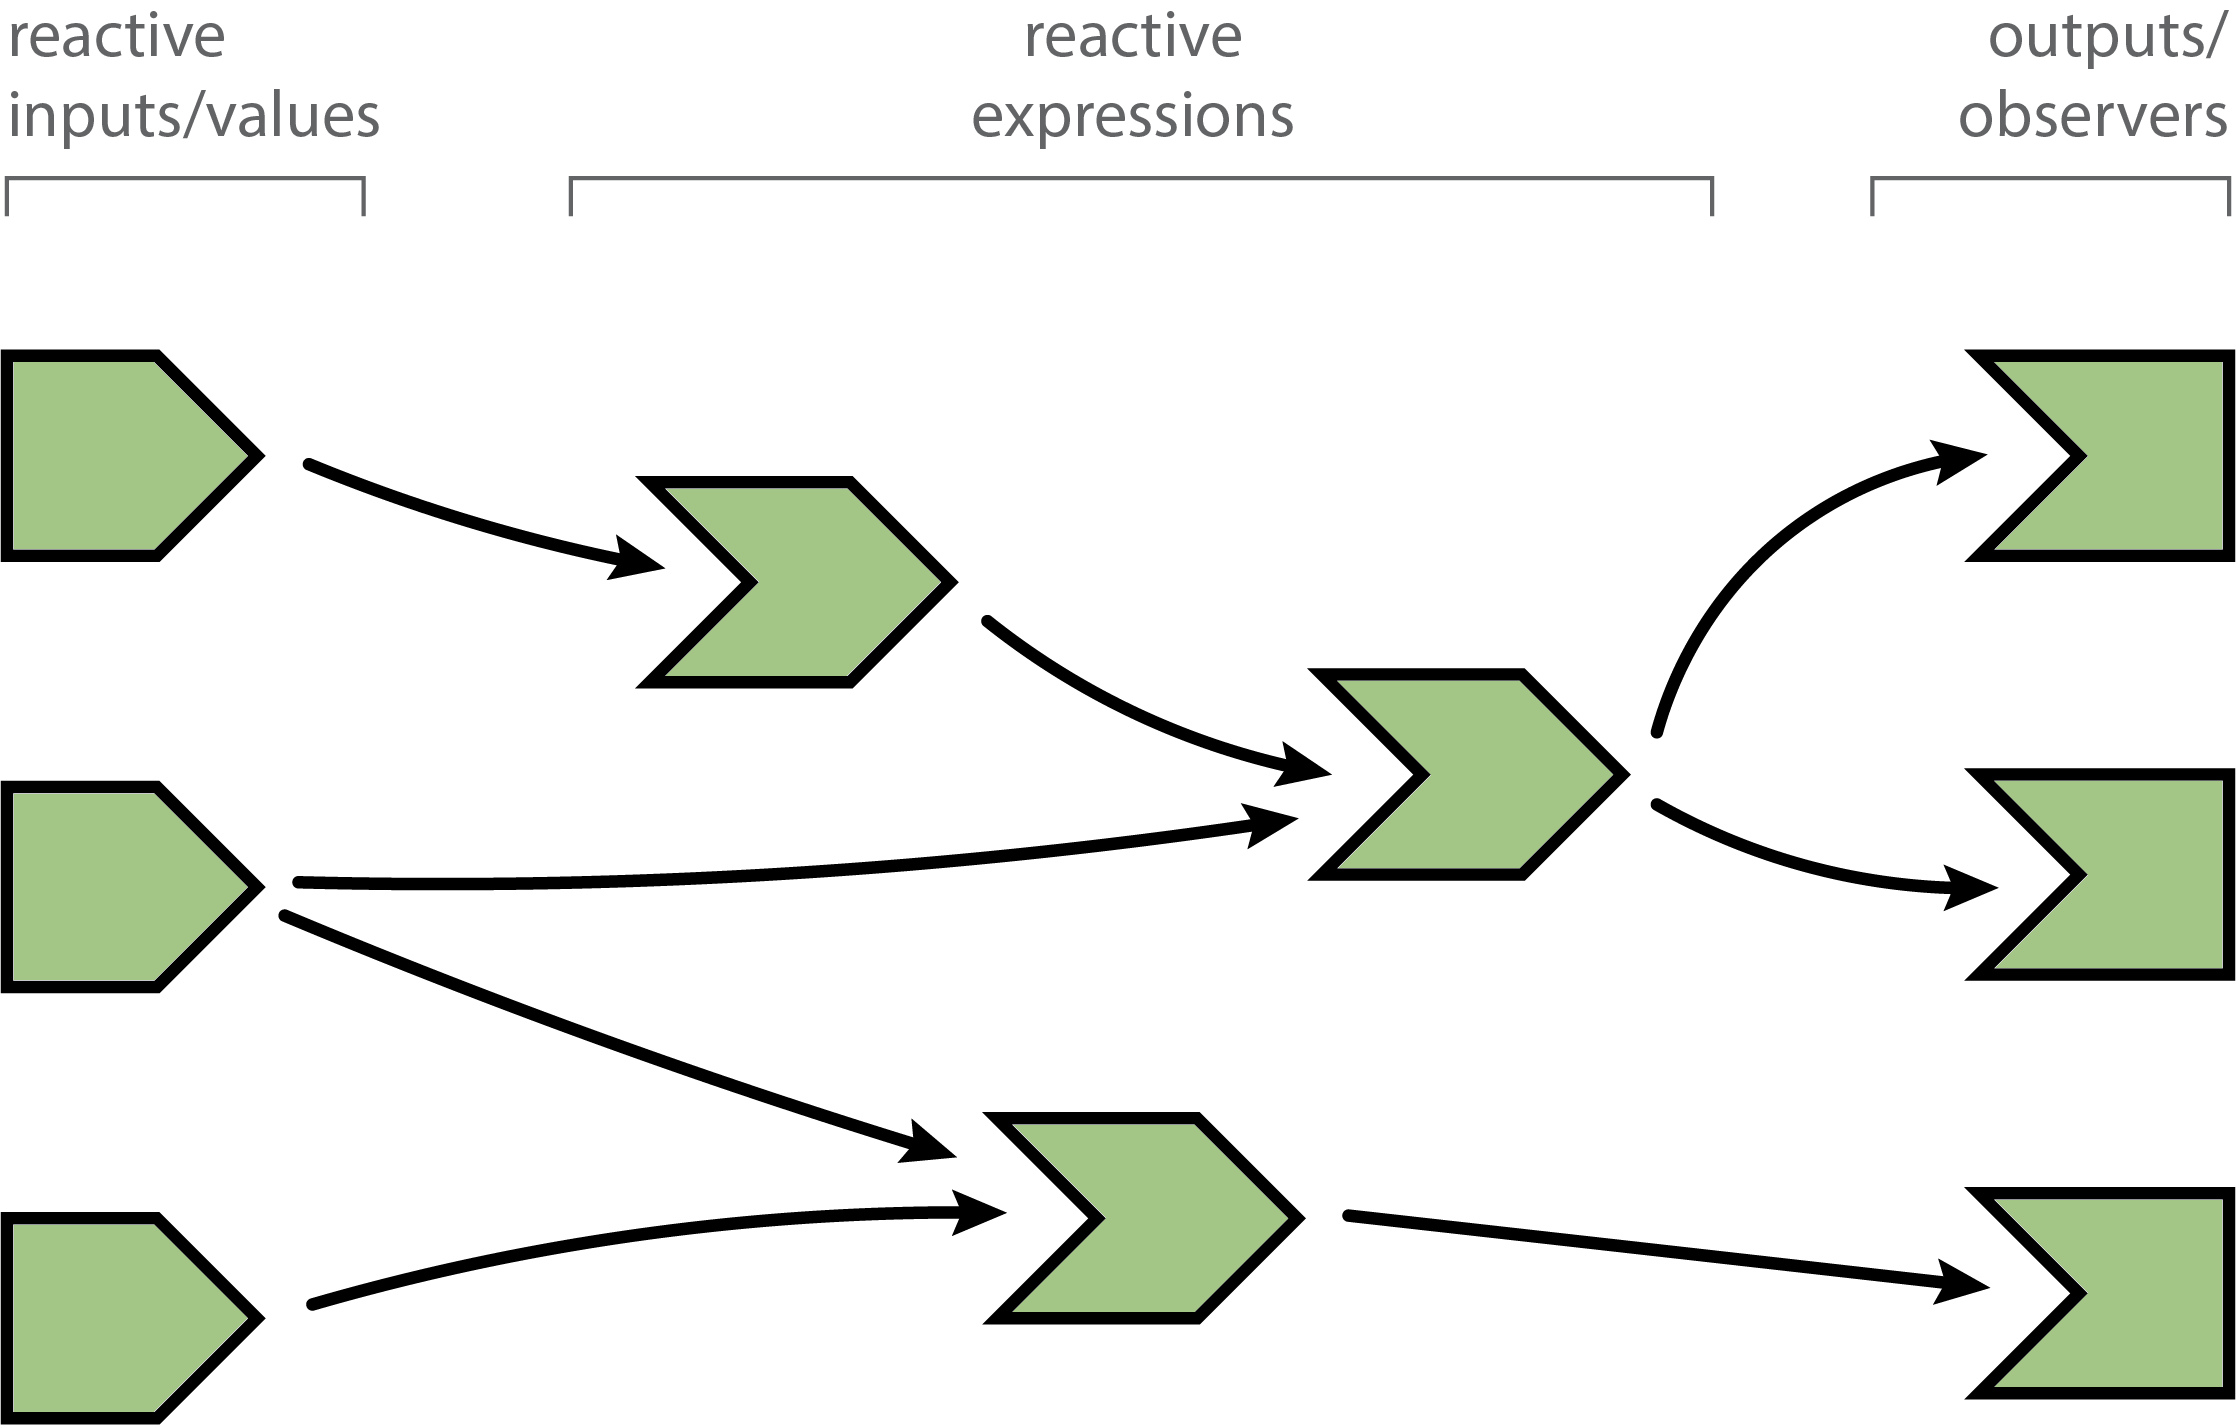
- Code doesn’t always run line-by-line (Non-linear execution)
- Code executes when dependencies change
Reactives
Functions with reactive context
reactive(): Defines an expressionreactiveVal(): Defines single valuereactiveValues(): Defines a list of values
Regular function fn <- function(): Runs wherever it is is used
Reactive function fn <- reactive(): Runs only when input changes
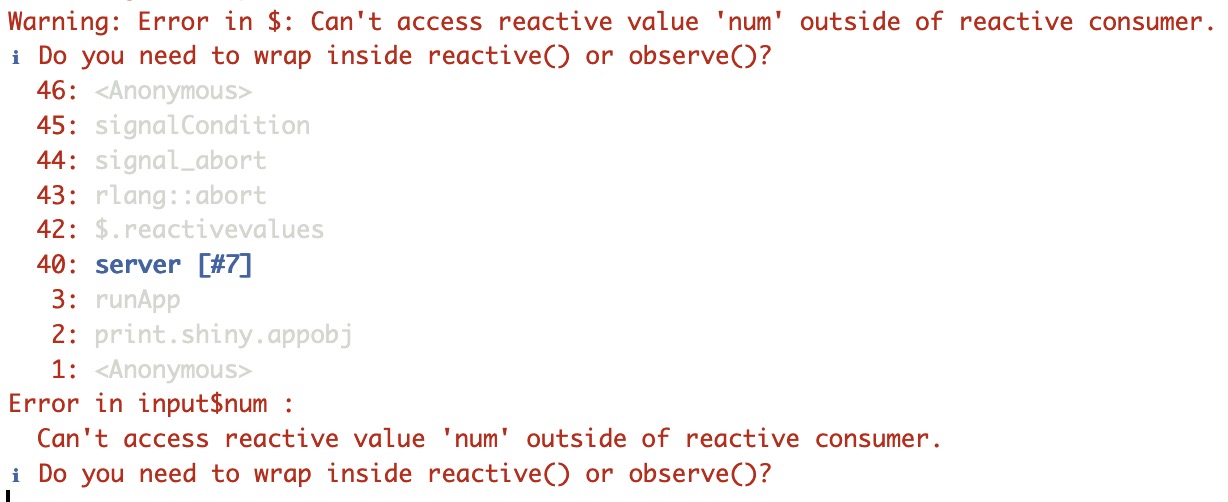
Reactive context
Reactive values cannot be accessed outside a reactive context
Reactive dynamics
#| standalone: true
#| components: [editor, viewer]
shinyApp(
  ui=fluidPage(
    numericInput("num_input",label="Observations",value=50),
    textOutput("text_output")),
  server=function(input,output) {
    output$text_output <- renderText({
        mean(rnorm(input$num_input))
    })
  })


Reactive dynamics
#| standalone: true
#| components: [editor, viewer]
shinyApp(
  ui=fluidPage(
    numericInput("num_input",label="Observations",value=50),
    textOutput("text_output1"), textOutput("text_output2")),
  server=function(input,output) {
    output$text_output1 <- renderText({
      mean(rnorm(input$num_input))
    })
    output$text_output2 <- renderText({
      mean(rnorm(input$num_input))
    })
  })


Reactive dynamics
#| standalone: true
#| components: [editor, viewer]
shinyApp(
  ui=fluidPage(
    numericInput("num_input",label="Observations",value=50),
    textOutput("text_output1"), textOutput("text_output2")),
  server=function(input,output) {
    rand <- function(x) rnorm(x)
    output$text_output1 <- renderText({
      mean(rand(input$num_input))
    })
    output$text_output2 <- renderText({
      mean(rand(input$num_input))
    })
  })
Reactive dynamics
#| standalone: true
#| components: [editor, viewer]
shinyApp(
  ui=fluidPage(
    numericInput("num_input",label="Observations",value=50),
    textOutput("text_output1"), textOutput("text_output2")
    ),
  server=function(input,output) {
    rand <- reactive({ rnorm(input$num_input) })
    output$text_output1 <- renderText({
      mean(rand())
    })
    output$text_output2 <- renderText({
      mean(rand())
    })
  })


Error validation
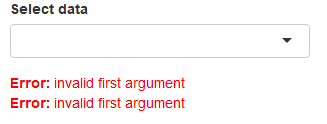
- Shiny returns an error with missing or incorrect values
Error validation
- Errors can be handled in a controlled manner
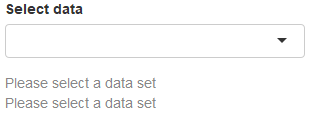
validate()can be used to check inputvalidate()usingneed()
shinyApp(
ui=fluidPage(
  selectInput("data_input",label="Select data",
              choices=c("","unknown","mtcars","faithful","iris")),
  tableOutput("table_output")
),

server=function(input, output) {
  getdata <- reactive({
  validate(need(try(input$data_input),"Please select a data set"))
    get(input$data_input,'package:datasets')
    })
  output$table_output <- renderTable({head(getdata())})
})
Error validation
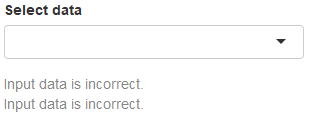
validate()using custom function
valfn <- function(x) if(is.null(x) | is.na(x) | x=="") return("Input data is incorrect.")

shinyApp(
ui=fluidPage(
  selectInput("data_input",label="Select data",
              choices=c("","unknown","mtcars","faithful","iris")),
  tableOutput("table_output")
),

server=function(input,output) {
  getdata <- reactive({
  validate(valfn(try(input$data_input)))
    get(input$data_input,'package:datasets')
    })
  output$table_output <- renderTable({head(getdata())})
})
shiny::req()checks input variable and silently stops execution
Observers
Reactive functions that automatically re-executes whenever its dependencies change. Usually used for side-effects rather than returning a value.
observe()
Doesn’t return a value. Constantly runs as long as the app is alive.
observeEvent()
Similar to observe(), but only re-executes on specific event (like a button click). Doesn’t return a value.
eventReactive()
Similar to observeEvent(), but returns a value.
bindEvent()
Bind an action to a specific event. Similar to observeEvent(), but allows for the event to be determined dynamically. Links an input (like a button) to an output and ensures that reactive expressions are only updated when bound event is triggered.
Updating widgets
- Widgets can be updated once initialized
- Example of a typical UI
- Add third argument session to server function
- Update functions can be used to update input widgets
observe({})monitors for a conditional change
Updating widgets
#| standalone: true
#| components: [editor, viewer]
shinyApp(
  ui = fluidPage(
    selectInput("data", "Choose a dataset:", choices = c("mtcars", "iris", "faithful")),
    selectInput("variable", "Choose a variable:", choices = names(mtcars))
  ),

  server = function(input, output, session) {

    dataset <- reactive({
      switch(input$data,
             "mtcars" = mtcars,
             "iris" = iris,
             "faithful" = faithful)
    })

    observe({
      updateSelectInput(session,"variable",choices=names(dataset()))
    })
  }
)
Updating widgets
| Input function | Update function |
|---|---|
checkboxInput() |
updateCheckboxInput() |
checkboxGroupInput() |
updateCheckboxGroupInput() |
radioButtons() |
updateRadioButtons() |
dateInput() |
updateDateInput() |
dateRangeInput() |
updateDateRangeInput() |
fileInput() |
|
numericInput() |
updateNumericInput() |
sliderInput() |
updateSliderInput() |
textInput() |
updateTextInput() |
textAreaInput() |
updateTextAreaInput() |
passwordInput() |
|
selectInput() |
updateSelectInput() |
actionButton() |
|
submitButton() |
|
tabsetPanel() |
updateTabsetPanel() |
navbarPage() |
updateNavbarPage() |
Reactive values
reactVal()reactValues()- Store reactive values that can be accessed from any reactive context
#| standalone: true
#| components: [editor, viewer]
shinyApp(
  ui = fluidPage(
    actionButton("add","Add"),
    actionButton("subtract","Subtract"),
    textOutput("counter")
  ),
  server = function(input, output) {
    reactive_values <- reactiveValues(counter = 0)

    observeEvent(input$add, {
      reactive_values$counter <- reactive_values$counter + 1
    })
    observeEvent(input$subtract, {
      reactive_values$counter <- reactive_values$counter - 1
    })

    output$counter <- renderText({
      reactive_values$counter
    })
  }
)
Controlling reactivity using action buttons
#| standalone: true
#| components: [editor, viewer]
shinyApp(
ui = fluidPage(
  h3("Temperature Converter"),
  numericInput("celsius", "Degrees Celsius:", value = 0),
  actionButton("btn_go", "Go!"),
  textOutput("fahrenheit")
),

server = function(input, output) {
  evr <- eventReactive(input$btn_go, {
    paste(input$celsius, "°C is ", (input$celsius * 9/5) + 32, " °F")
  })

  output$fahrenheit <- renderText({
    evr()
  })

  #output$fahrenheit <- renderText({
  #    paste(input$celsius, "°C is ", (input$celsius * 9/5) + 32, " °F")
  #  }) |>
  #  bindEvent(input$btn_go)
})
Download • Data
- Add button and
downloadHandler()function
shinyApp(
ui=fluidPage(
  selectInput("data_input",label="Select data", choices=c("mtcars","faithful","iris")),
  textOutput("text_output"),
  downloadButton("button_download","Download")),
server=function(input, output) {
  getdata <- reactive({ get(input$data_input, 'package:datasets') })
  output$text_output <- renderText(paste0("Selected dataset: ",input$data_input))

  output$button_download <- downloadHandler(
  filename = function() {
     paste0(input$data_input,".csv")
   },
  content = function(file) {
     write.csv(getdata(),file,row.names=FALSE,quote=F)
   })
})- Run in system browser if Rstudio browser doesn’t work
Download • Plots
shinyApp(
ui=fluidPage(
  selectInput("data_input",label="Select data",
              choices=c("mtcars","faithful","iris")),
  textOutput("text_output"),
  plotOutput("plot_output",width="400px"),
  downloadButton("button_download", "Download")
),

server=function(input, output) {
  getdata <- reactive({ get(input$data_input, 'package:datasets') })
  output$text_output <- renderText(paste0("Selected dataset: ",input$data_input))
  output$plot_output <- renderPlot({hist(getdata()[, 1])})

output$button_download <- downloadHandler(
  filename = function() {
    paste0(input$data_input,".png")
  },
  content = function(file) {
    png(file)
    hist(getdata()[, 1])
    dev.off()
  })
})- Run in system browser if Rstudio browser doesn’t work
- See usage of download buttons
Modules
- Parts of an app can be modularized and reused like mini apps
- They can be used where needed like functions
- Modules have their own namespace
- A module has a UI part and a server part
- Define namespace using
NS() - Modules can be nested
Modules
#| standalone: true
#| components: [editor, viewer]
counter_ui <- function(id) {
  ns <- NS(id)
  div(
    actionButton(ns("btn"), label = "Counter"),
    textOutput(ns("txt"))
  )
}

counter_server <- function(id) {
  moduleServer(id, function(input, output, session) {
    count <- reactiveVal(0)
    output$txt <- renderText({
      count(count() + 1)
      paste0("Counter ", id, ":", count())
    }) |> bindEvent(input$btn)
  })
}

shinyApp(
  ui = fluidPage(
    counter_ui(id = "1"),
    counter_ui(id = "2")
  ),

  server = function(input, output, session) {
    counter_server("1")
    counter_server("2")
  }
)
Debugging & Optimizing
print()statementsInterrupt execution and inspect environment
browser()Visualize relationships using reactlog
![]()
Debugging & Optimizing
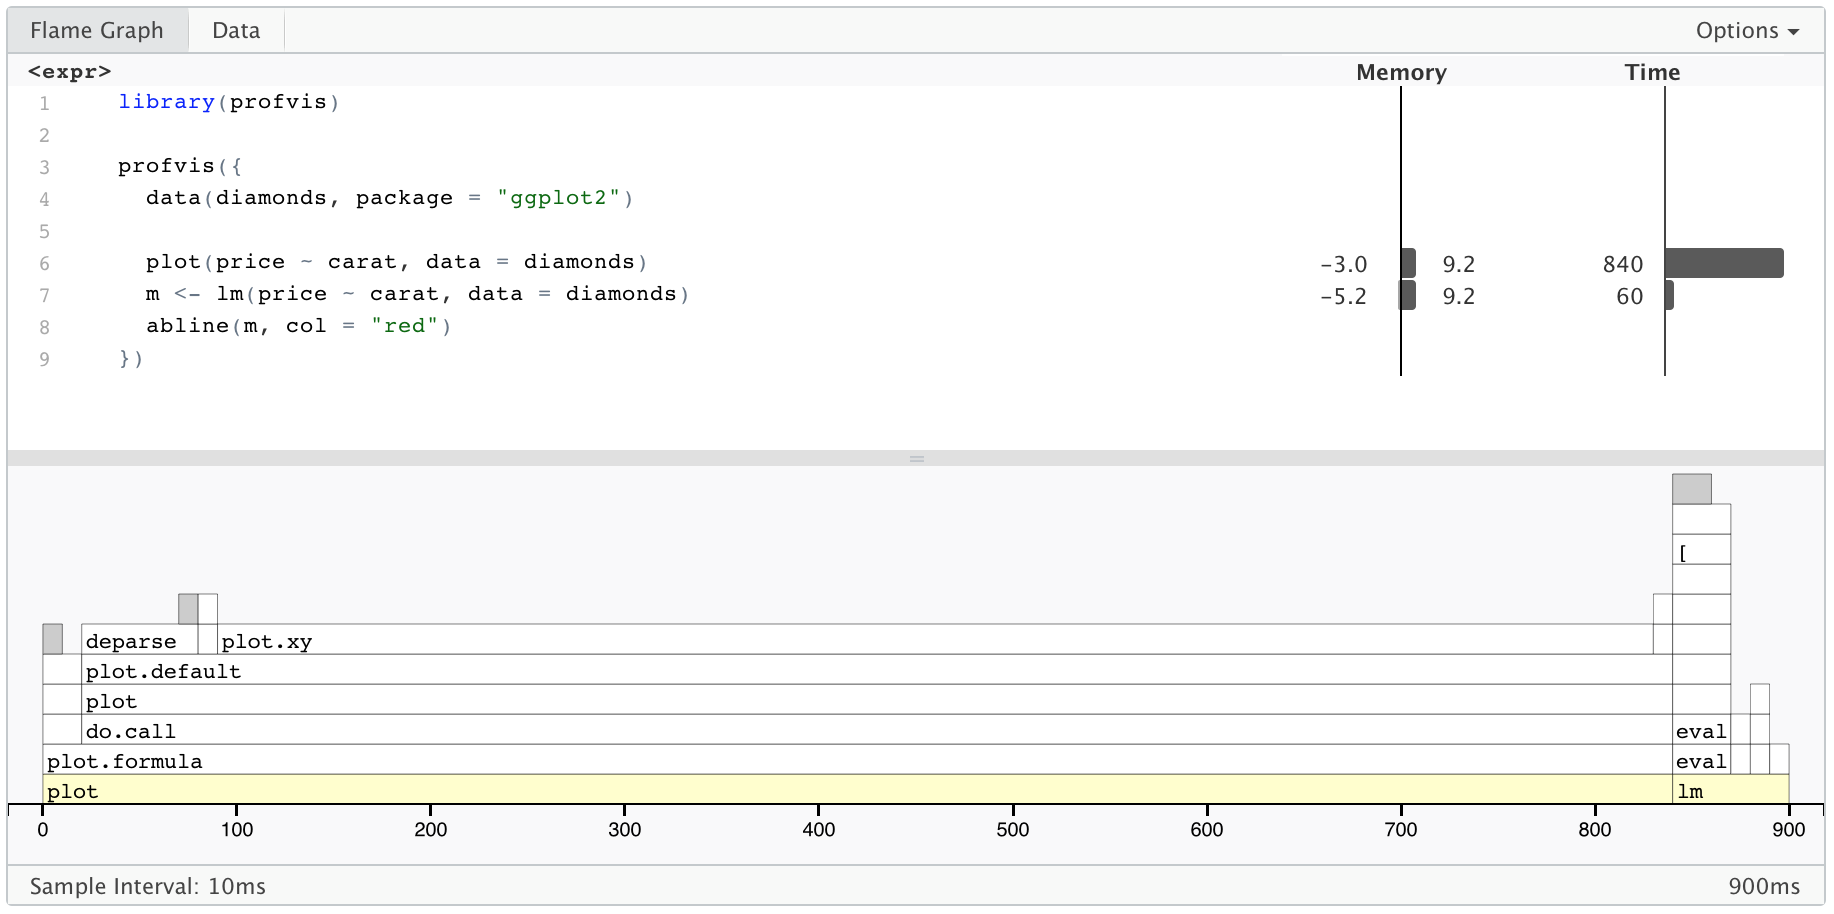
Assess compute and RAM usage using profvis
![]()
Simple profiling using shiny.tictoc
Code execution
App launch
New user
Theming
- Use shinythemes
- Live theme selector
#| standalone: true
#| viewerHeight: 650
webr::install("shinythemes")

shinyApp(
  ui = fluidPage(
    shinythemes::themeSelector(),
    sidebarPanel(
      textInput("txt", "Text input:", "text here"),
      sliderInput("slider", "Slider input:", 1, 100, 30),
      actionButton("action", "Button"),
      actionButton("action2", "Button2", class = "btn-primary")
    ),
    mainPanel(
      tabsetPanel(
        tabPanel("Tab 1"),
        tabPanel("Tab 2")
      )
    )
  ),
  server = function(input, output) {}
)
Theming
- Use bslib
- Live theme selector
Theming using custom CSS
- Insert in the head
- Add styles directly
- Load custom CSS file placed in
www/
Deployment
- R scripts
- GitHub
- R Package
- Container (Docker …)
- Hosting
- Shinyapps.io
- Shiny Server (Free)
- Shiny Server Pro
- Automatically deploying to shinyapps.io
Interactive documents • Quarto
---
title: "Interactive scatterplot"
format: html
server: shiny
---

```{r}
library(shiny)
library(ggplot2)

selectInput("x_var", "X-axis Variable:", choices=names(mtcars), selected = "hp"),
selectInput("y_var", "Y-axis Variable:", choices=names(mtcars), selected = "mpg"),
plotOutput("plot")
```

```{r}
#| context: server
output$plot <- renderPlot({
  ggplot(mtcars, aes_string(x = input$x_var, y = input$y_var)) +
    geom_point() +
    labs(title = "Interactive mtcars scatterplot",
         x = input$x_var,
         y = input$y_var)
})
```
Interactive documents • Rmarkdown
- Shiny can run in RMarkdown documents. Set YAML
runtime: shiny.
---
title: Interactive document
output: html_document
runtime: shiny
---- Shiny widgets can be included directly
Interactive documents
- Whole shiny apps can be included directly
- Hosted shiny apps can be embedded using
<iframe>
<iframe src="https://user.shinyapps.io/app"></iframe>Other topics
Extensions
- Naxstats: Repo collection of shiny extensions
- bslib: Bootswatch themes for shiny
- shinyurl: using URLs to recreate state of an app
- shinypod: Reusable modules
- shinyjs: Custom javascript functionality
- shinyWidgets: Bootstrap 3 custom widgets
- shinyBS: Bootstrap 3 widgets
- shinymanager: Authentication for shiny apps
- …
Learning & community
Documentation
Books


Conferences
Blogs & Podcasts
Thank you! Questions?
         _
platform x86_64-pc-linux-gnu
os       linux-gnu
major    4
minor    3.2
2024 • SciLifeLab • NBIS • RaukR
