class: center, middle, inverse, title-slide # Meta analyses for Omics integration ## Workshop - Omics Integration and Systems Biology ### <b>Ashfaq Ali</b> ### NBIS, SciLife lab, Lund University, Sweden ### updated: 2021-07-23 --- class: left, middle, top ## Meta analyses and its components An example comparing effect of increased dosage of statins on mycardial infarction. In conclusive evidence. .pull-left-60[ 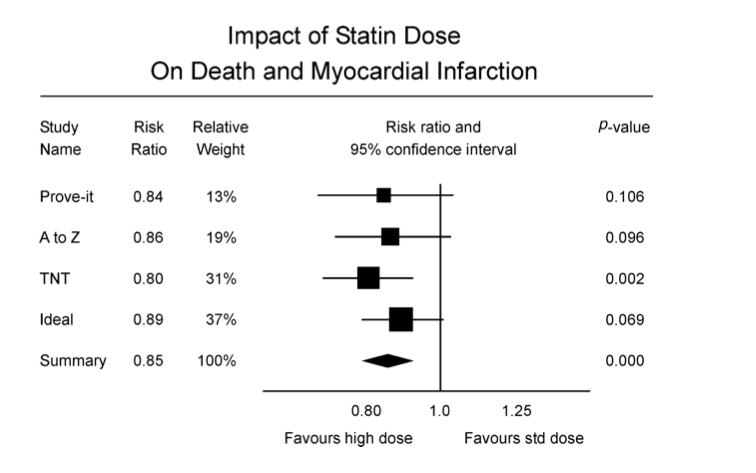 Cannon _et al_ 2006 ] .pull-right-40[ - Individual studies - Effect Sizes - Precision and Weights - P value and confidence intervals - Summary - Effect Size - P Value - Precision - Heterogeneity of effect size - A measure of consistency (later) ] --- class: left, left, top ## Meta analyses relevant Example from Genetic Epidemiology .pull-left-40[ - Hypothesis: Genetic risk score for obesity has more effect on inactive people $$ GRS =\sum_{i = 1}^{n}{risk \ alleles} $$ 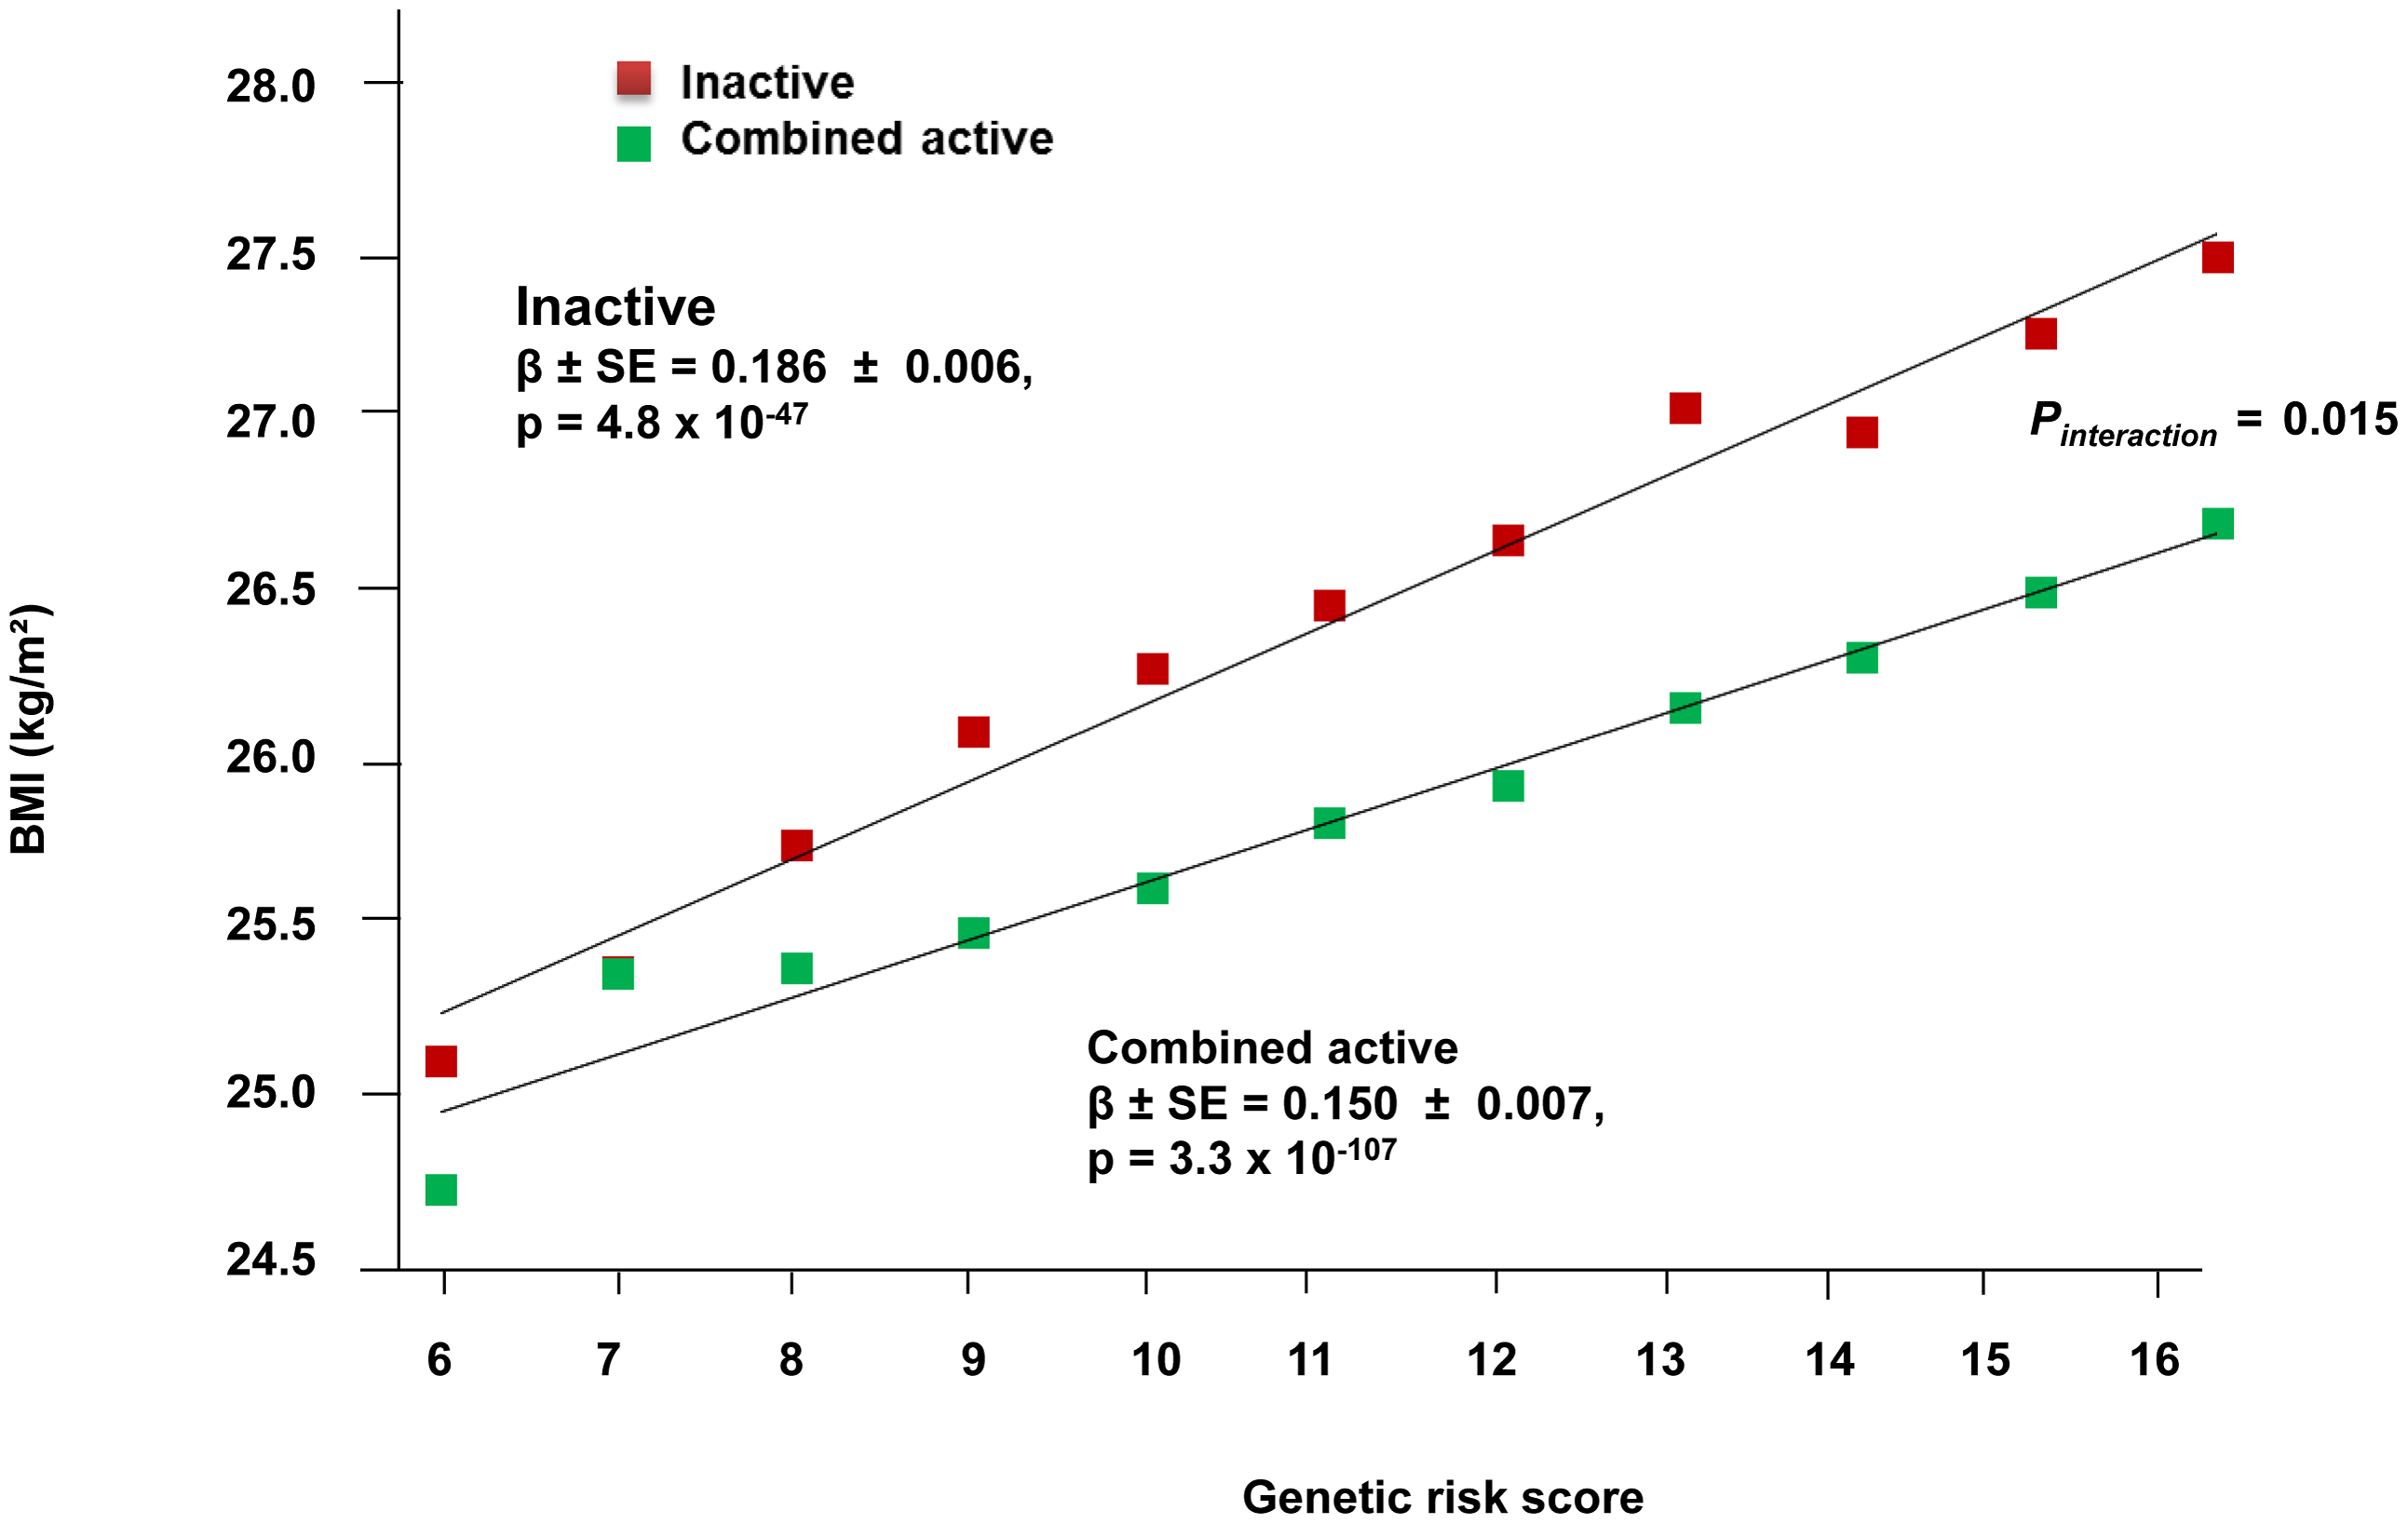 ] .pull-right-40[ - Met Analyses gives non significant results 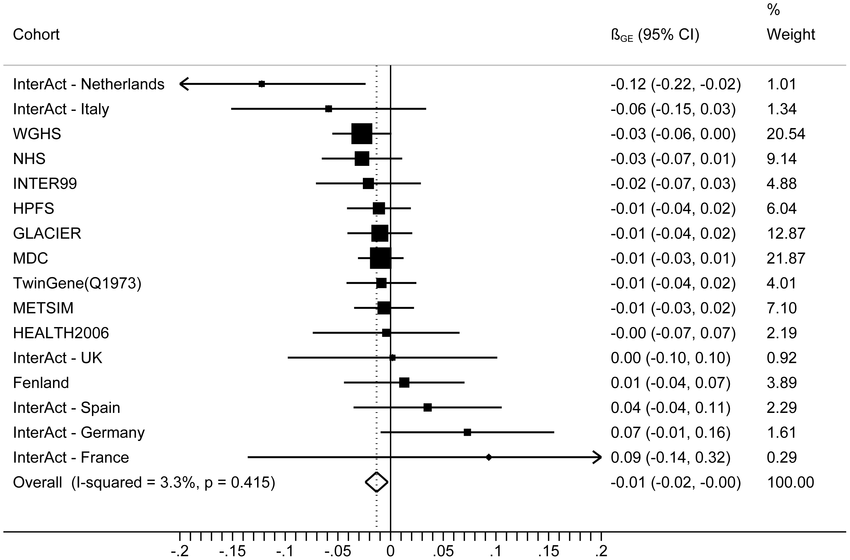 [Ahmed _et al_ 2013](https://www.ncbi.nlm.nih.gov/pmc/articles/PMC3723486/) ] --- class: left, top, top ## Why do meta analyses **The goal of meta analyses is to contextualize the results of any study in the context of all the other studies** - **Statistical Significance** - Is there a significant association? - **Clinical importance of the effect** - estimate the effect size as accurately as possible - quantify the extent of the variance and consider the implications - **Consistency of effects** - whether or not the effect size is consistent across the body of data --- ## Implications of dimentionality in genome wide omics studies - **Winners Curse** "When statistical power is low, estimates of the odds ratio from a genome-wide association study, or any large-scale association study, will be upwardly biased" - The problem is widely known in [GWAS](https://pubmed.ncbi.nlm.nih.gov/17266119/) and [eQTL](https://www.biorxiv.org/content/10.1101/209171v1.full) studies. Consider **[Ahmed _et al_.](https://www.ncbi.nlm.nih.gov/pmc/articles/PMC3723486/)** .pull-left-50[ <img src="images/Gene_physcical_activity_interaction.png" class="fancyimage size-85"> ### Effect size = 0.186 ] .pull-right-40[ <img src="images/Ahmed_power.png" class="fancyimage size-85"> X- axis : Sample size Y- axis :statistical power ] --- # Meta analyses techniques 1. Combining P- values, 2. Combining effects. 2. Combining rank statistics --- ## p values Fisher's method: Sum of minus log-transformed *P*-values where larger Fisher score reflects stronger aggregated differential expression evidence. \begin{equation} p = -2\times \sum_{i=1}^k\ {\ln}\ \left({p}_i\right) \end{equation} - Pearson's method \begin{equation} p = -2\times \sum_{i=1}^k\ \mathit{\ln}\ \left(1-{p}_i\right) \end{equation} - Stouffer's Method \begin{equation} {Z}_i={\varPhi}^{-1}\left(1-{p}_i\right) \end{equation} Φ is the standard normal cumulative distribution function. \begin{equation} \frac{\sum_{i=1}^k\ {Z}_i}{\sqrt{k}} \end{equation} *it allows including weights for the studies. In this case, the statistic is* - minP: `\(\begin{equation} \mathit{\min}\ \left({p}_1,{p}_2,\dots, {p}_i,\dots, {p}_k\right) \end{equation}\)` - maxP: `\(\begin{equation} \mathit{\max}\ \left({p}_1,{p}_2,\dots, {p}_i,\dots, {p}_k\right) \end{equation}\)` --- class: left, top, top ## 2. Effect size based analyses ### Fixed effect models FEM combines the effect size across *K* studies by assuming a simple linear model with an underlying true effect size plus a random error in each study \begin{equation} \overline{T_{.}}=\frac{\varSigma{\omega}_i{T}_i}{\varSigma{\omega}_i} \end{equation} ### Random effect model REM extends FEM by allowing random effects for the inter-study heterogeneity in the model. `$$\begin{equation} {\overline{T_{.}}}^{\ast }=\frac{\sum_{i=1}^k\ {\omega}_i^{\ast }{T}_i}{\sum_{i=1}^k\ {\omega}_i^{\ast }} \end{equation}$$` `\(\omega\)` are the different weights assigned to each study, that is, the inverse within-study variance `\(V\Big({T}_i\Big)\)` and `\(\begin{equation} {\omega}_i=\frac{1}{V\left({T}_i\right)} \end{equation}\)` --- ## Heterogeneity of effect sizes The statistic that represents the total variance, Q, is defined as (Cochran's Q) which is computed by summing the squared deviations of each study's estimate from the overall meta-analytic estimate `$$\begin{equation} Q=\sum_{i=1}^k\ {\omega}_i\left({T}_i-\overline{T_{.}}\right) \end{equation}$$` where `\(T_i\)` is the observed effect, ωi is the calculated weights for the FEM and `\(T_i⎯ \widehat{T}\)`.is the combined effect calculated for the FEM A test for heterogeneity examines the null hypothesis that all studies are evaluating the same effect. The usual test statistic , weighting each study's contribution in the same manner as in the meta-analysis. P values are obtained by comparing the statistic with a `\(\chi^2\)` distribution with k-1 degrees of freedom (where k is the number of studies). `$$I2 = 100×(Q - df)/Q$$`, where Q is Cochran's heterogeneity statistic and df the degrees of freedom$ --- ## Ranks based meta analyses - rankProducs `$$\begin{equation} {RP}_g=\prod_i^k r_{ig} \end{equation}$$` - Rank Sums `$$\begin{equation} {RS}_g=\sum_i^K {r}_{ig} \end{equation}$$` --- ## Meta analyses of Expression based Omics (Motivation) - Vertical Integration - Perform analysis of omics data either across experiments on the same samples - Very rare in clinical setting - Require data from same individuals - Horizontal integration techniques cross studies on the same variables - Meta analyses is one of the techniques - Sample sizes small - Study specific biases - Batch effects --- class: left, top, top ## Data integration using meta analyses for Omics 1. Detect/validate deferentially expressed genes - Drug targets - Disease Biomarkers 2. Detect/validate deferentially regulated pathways 3. Detect/ co-expression network --- # Workflow for Meta analyses for Differential Expression .pull-left-50[ 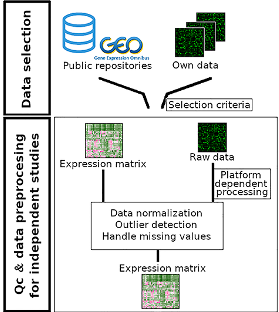 ] .pull-left-50[ 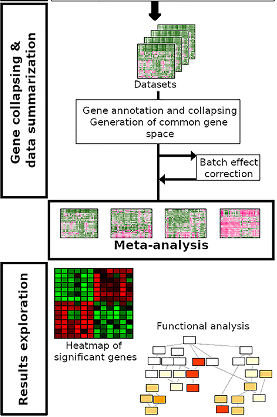 ] --- ## Methods - MetaDE: meta analyses based on differential expression - Meta analyses based on pathways - Effect size(Fixed effect, Random effect) - P Value - Vote counting - MetaPath: Meta analyses based on pathways - At gene level - Pathway level - Hybrid - MetaDCN: Meta analyses based on networks - Systematically identify co-expression modules and build based on across study consensus. --- ## Meta-Analysis for Pathway Enrichment (MAPE) - Usual: compare the number of deferentially expressed (DE) genes in and outside a pathway using [Fisher's exact test](https://pubmed.ncbi.nlm.nih.gov/14519205/) - Or [Gene Set Enrichment Analysis (GSEA)](https://pubmed.ncbi.nlm.nih.gov/16199517/) [MetaPath](https://www.ncbi.nlm.nih.gov/pmc/articles/PMC2865865/) and [CPI](https://www.biorxiv.org/content/10.1101/444604v1.full.pdf) Workflow. Gene level, Pathway level or a hybrid approach. .pull-left-50[ <img src="images/MetaPath_step1.png" class="fancyimage size-70"> ] .pull-right-40[ <img src="images/MetaPathStep2.png" class="fancyimage size-85"> <img src="images/MetaPathStep3.png" class="fancyimage size-85"> ] <br/> <br/> --- ## Meta-analyses Co-expression networks using [MetaDCN](https://www.ncbi.nlm.nih.gov/pmc/articles/PMC6041767/) - Differential co-expression (DC) refers to the change in gene–gene correlations between two conditions (e.g. cases and controls). - The differential correlation relationship could arise from meaningful biological sources as well as uncorrected technical biases - Unwanted batch effect, or mixture of tissues could potentially contribute to co-expression relationships - Differential co-expression may be confirmed across multiple datasets via meta-analyses to increase the detection power and stability. - DC networks that are significant in one dataset may become more convincing if the DC patterns are preserved across multiple datasets. <br/> **Disambiguation** _Here we are not discussing Network meta-analysis (NMA) which extends principles of meta-analysis to the evaluation of multiple treatments in a single analysis._ --- ## Steps 1. *Basic DC module detection - Search for initial DC modules by calculating pair-wise gene–gene Spearman’s correlations for robust comparisons - Optimization by simulated annealing combined basic DC modules that share common pathway annotation into more interportable DC supe-rmodules - Control of false discovery rate 2. Differential Coexpression based on phenotype 3. DC supermodule assembly 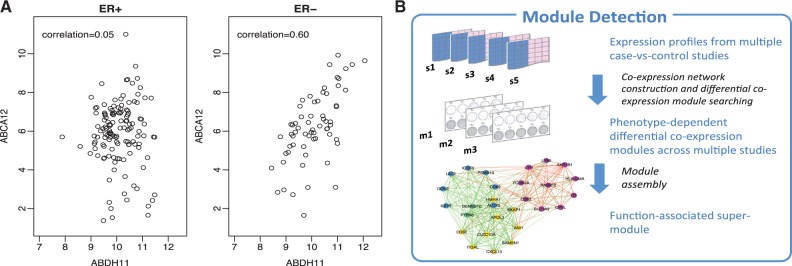 Bioinformatics. 2017 Apr 15; 33(8): 1121–1129. --- ## End of lecture