Network diffusion based methods in integrating 'omics data
Sergiu Netotea, PhD, NBIS, Chalmers
- Network fusion
- Similarity network fusion, explained in detail
- Applications
Classification of graph based integration methods
Network-Based Approaches: - Graph Construction, Multi-Modal Networks: Integrating multiple omics datasets into one comprehensive graph that allows for the analysis of cross-layer interactions. - Node/Edge Weighting: Some methods apply weighting strategies to nodes and edges to emphasize biological relevance, which can assist in identifying key components within the network.
Algorithmic Methods:
- Network Diffusion/Propagation: Methods that allow information (e.g., signals or perturbations) to propagate through the network to detect influential nodes or subnetworks. Examples: Similarity network fusion, Graph autoencoders
- Causal Inference: Algorithms that attempt to infer causality between nodes based on their interactions and the multi-omics data layers. Example: Graphical models based on statistical learning, Recurrent Graph Learning
Machine Learning Approaches:
- Integration with Network-Based Approaches: Machine learning models are sometimes used in tandem with network approaches to enhance predictive power and biological insight. These methods are characterized by the existence of a fittness function. Examples: Graph embedding, Graph Neural Networks
Read mode:
Agamah FE, Bayjanov JR, Niehues A, Njoku KF, Skelton M, Mazandu GK, Ederveen THA, Mulder N, Chimusa ER, 't Hoen PAC. Computational approaches for network-based integrative multi-omics analysis. Front Mol Biosci. 2022 Nov 14;9:967205. doi: 10.3389/fmolb.2022.967205. PMID: 36452456; PMCID: PMC9703081.
Network based models in biology
Network models are a very complex representation of data:
- Power law sophistication: for every n vertices there are up to n(n-1) possible edges
- This fits biological complexity, and draws a paralel to the "curse of dimensionality"
- I like to see graphs as yet another data representation format, along with tabular data, multi channel signal intensities or spatial microscopy..
- Networks too can handle differences in scale, collection bias and noise in each data set
- They can also handle the complementary nature of the information provided by different types of data
- the potential for feature cleaning and data transformation using a network structure are great
- one important tradeoff: losing a weak signal due to a poorly made network model
- ...one important benefit: recovering a weak signal due to the cummulative power of weak links
Common network (graph) representation
Typical dataset:
- features: samples, patients, genes, metabolites, clinical descriptors etc
- instances: any repeated measurements of the above!
Via network modelling, all instances are turned into feature relationships
- Nodes (vertices): features
- Links (edges): numerical relationship between nodes (directional, boolean, discrete, continuous)
Via network fusion, the feature relationships (links) are described based on multiple datasets.

How can networks be fused?
Simple rule: average edge values by summing up adjacency matrices!
Pitfalls:
- Most omics networks are sparse: some feature relationships eh .. are prevalent only on certain 'omics levels!
- Guilt of association is not captured: features similar to pan-omics features should not the treated equally.
Complex rule: take in consideration the infomation difussivity in each network when fusing them!
- in graph computing this is called "message passing".
- pitfalls: model parametrization
(Perceived) advantages of network fusion
Very useful when:
- data is incomplete
- dataset quality is not uniform
- data from multiple sources is used
- networks can be built in complex ways, taking into account additional, annotated information.
- easy to transfer knowledge from alternative models
It is a generative model!
- example: generate data from similarity matrix
- the generated networks can be used for graph clustering, regression, classification.
SNF: Similarity Network Fusion
Wang, Bo et al. “Similarity network fusion for aggregating data types on a genomic scale.” Nature methods vol. 11,3 (2014): 333-7.
https://doi.org/10.1038/nmeth.2810
- mRNA expression, DNA methylation and microRNA (miRNA) expression data for five cancer data sets.
- clustering cancer subtypes and predicting survival
- uses networks of samples (patient networks) as a basis for integration.
- at the time patient-similarity networks have not been used specifically for integrating biological data
Similarity networks
- At every 'omics level, there are multiple ways to compute a network.
- Similarity networks are only investigating the similarity of one feature to another, with regards to a distance measure.
- Every similarity distance is different. See https://en.wikipedia.org/wiki/Metric_space TODO: similarity tables
SNF Method
Similarity distance:
- contininuous data: euclidean distance, weighted using an exponential kernel function $f(x) = \exp{\left( -\frac{\sum_{i=1}^{n}(x_i-y_j)^2}{2\sigma^2} \right)}$
- discrete data: chi squared distance $\sum_{i=1}^{n} \cfrac{(x_i - y_i)^2} {(x_i + y_i)}$
- boolean data: agreement based distances (Jaccard, Hamming)
SNF Method - the similarity matrix
- P measures a given patient's similarity to all other patients
- In order to fuse the supplied m simmilarity (affinity) matrices, each must be normalized.
- A traditional normalization on an affinity matrix would suffer from numerical instabilities due to the self-similarity along the diagonal; thus, a modified normalization is used:
$$ \mathbf{P}(i,j) = \left\{\begin{array}{rr} \frac{\mathbf{W}_(i,j)} {2 \sum_{k\neq i}^{} \mathbf{W}_(i,k)} ,& j \neq i \\ 1/2 ,& j = i \end{array}\right. $$
SNF Method - the kernel matrix
- Under the assumption that local similarities are more important than distant ones, a more sparse weight matrix is calculated based on a KNN framework:
- S measures a given patient's similarity to the K most similar patients.
$$ \mathbf{S}(i,j) = \left\{\begin{array}{rr} \frac{\mathbf{W}_(i,j)} {\sum_{k\in N_{i}}^{}\mathbf{W}_(i,k)} ,& j \in N_{i} \\ 0 ,& \text{otherwise} \end{array}\right. $$
SNF Method - Inductive network fusion
- The two weight matrices P and S thus provide information about a given patient's similarity to all other patients and the K most similar patients, respectively.
- These m matrices are then iteratively fused. At each iteration, the matrices are made more similar to each other via message passing:
$$ \mathbf{P}^{(v)} = \mathbf{S}^{(v)} \times \frac{\sum_{k\neq v}^{}\mathbf{P}^{(k)}}{m-1} \times (\mathbf{S}^{(v)})^{T}, v = 1, 2, ..., m $$
Obs:
- After each iteration, the resultant P matrices are normalized via the equation above.
- Fusion stops after
titerations, or when the matrices $\mathbf{P}^{(v)}, v = 1, 2, ..., m$ converge. - The output fused matrix is full rank and can be subjected to clustering and classification.
Different usage of the fused matrix:
- clustering: spectral clustering, consensus clustering
- network model based subtype prediction: label propagation
- network model based feature selection: measuring the change in consistence brought by SNF on a single feature
Post-fusion analysis - Spectral clustering
The fitted model is a similarity network (an affinity matrix). Thus to cluster one must use graph algorithms such as spectral clustering. Other popular graph clustering methods are: K-neighbors clustering, MCL clustering
Spectral clustering:
- eigenvalues, eigenvectors $A x = \lambda x$
- graph laplacian: degree matrix - adjacency matrix
- the increasing ordered eigenvalues of the graph laplacian matrix are describing the clusters in their increased network effect
SNF usage examples
Paper study:
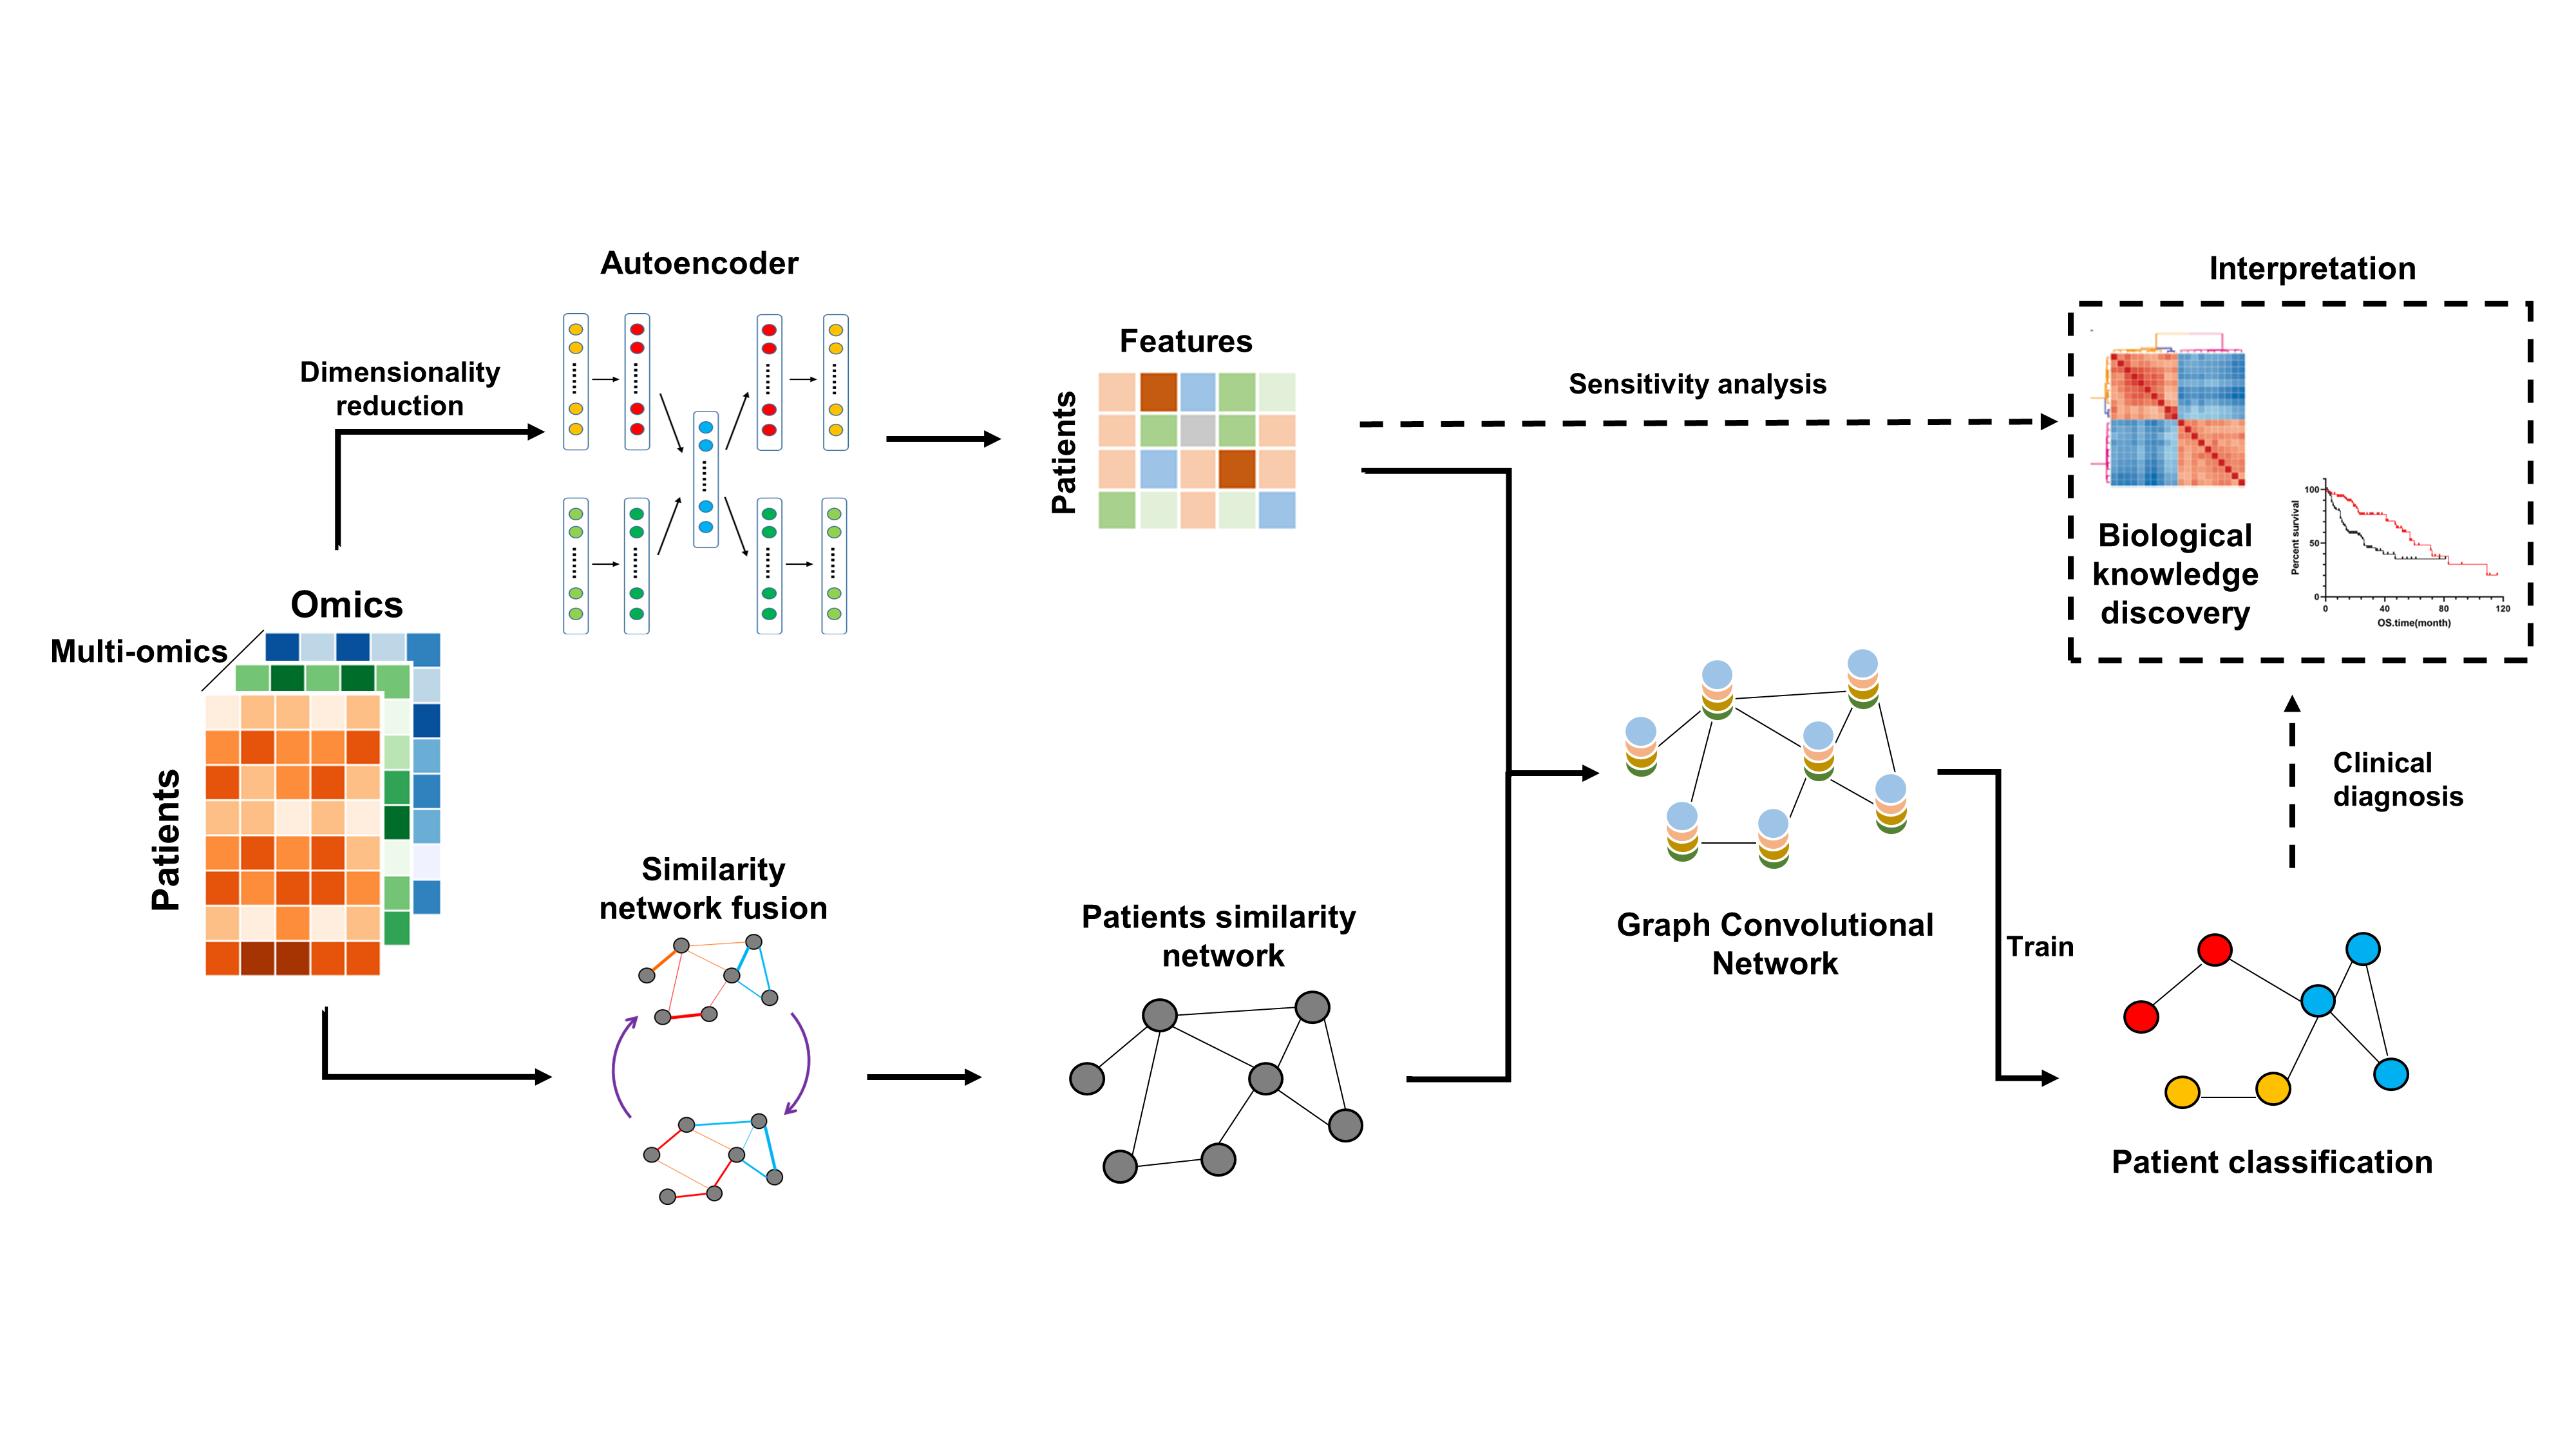
MoGCN, a multi-omics integration model based on graph convolutional network (GCN) - https://github.com/Lifoof/MoGCN - Li X, Ma J, Leng L, Han M, Li M, He F, Zhu Y. MoGCN: A Multi-Omics Integration Method Based on Graph Convolutional Network for Cancer Subtype Analysis. Front Genet. 2022 Feb 2;13:806842. doi: 10.3389/fgene.2022.806842. PMID: 35186034; PMCID: PMC8847688
- Cancer subtype classification and analysis. Genomics, transcriptomics and proteomics datasets for 511 breast invasive carcinoma (BRCA) samples were downloaded from the Cancer Genome Atlas (TCGA).
- The autoencoder (AE) and the similarity network fusion (SNF) methods were used to reduce dimensionality and construct the patient similarity network (PSN), respectively
- Then the vector features and the PSN were input into the GCN for training and testing. Feature extraction and network visualization were used for further biological knowledge discovery and subtype classification.
Paper study:
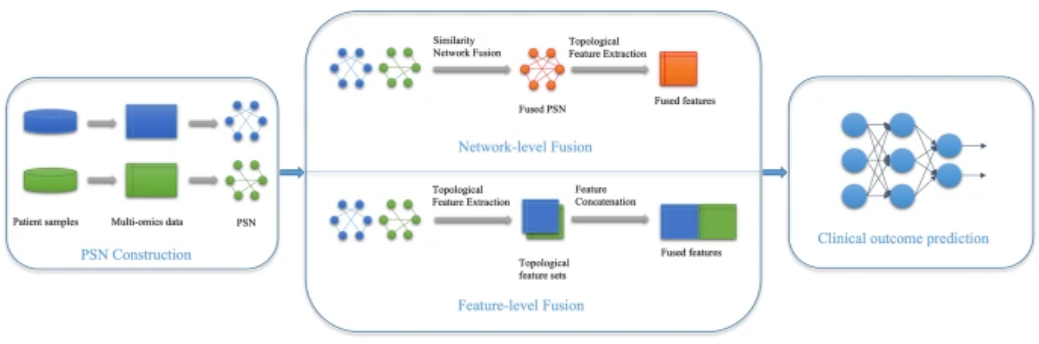
Wang, C., Lue, W., Kaalia, R. et al. Network-based integration of multi-omics data for clinical outcome prediction in neuroblastoma. Sci Rep 12, 15425 (2022). https://doi.org/10.1038/s41598-022-19019-5
Aim: integrate multi-omics data (like gene expression and DNA methylation) for predicting clinical outcomes in neuroblastoma, a pediatric cancer.
Using Patient Similarity Networks (PSNs) derived from omics features, they create networks where patients are nodes and edges represent their similarity based on omics data. They apply two methods for data fusion: at feature level and at network level
Their results show that network-level fusion generally outperforms feature-level fusion for integrating diverse omics datasets, while feature-level fusion is effective when combining different features within the same omics dataset.
Feature-level fusion: Combines features derived from each omics dataset into a single feature set by concatenating or averaging features like centrality and modularity from PSNs. For each omics dataset m, a Patient Similarity Network (PSN) is constructed. Let x_m represent the feature vector of the m-th omics dataset for a subject. The feature-level fusion is performed as follows:
- Extract centrality and modularity features from each PSN.
- Compute the mean of centrality features and concatenate the modularity features from each omics dataset: $$ x_{\text{fused}} = \frac{1}{M} \sum_{m=1}^{M} x_m $$ , where M is the total number of omics datasets.
The fused feature vector $x_{\text{fused}}$ is used as input to machine learning classifiers for clinical outcome prediction.
- Network-level fusion: PSNs from individual omics datasets are combined to form a single multi-omics PSN. The fusion is performed using the Similarity Network Fusion (SNF) algorithm, which combines the similarity matrices (A_m) of individual PSNs: $$ A_{\text{fused}} = \text{SNF}(A_1, A_2, \ldots, A_M) $$ The fused similarity matrix $ A_{\text{fused}} $ represents the multi-omics PSN, which is then used for downstream prediction tasks.
Paper study:
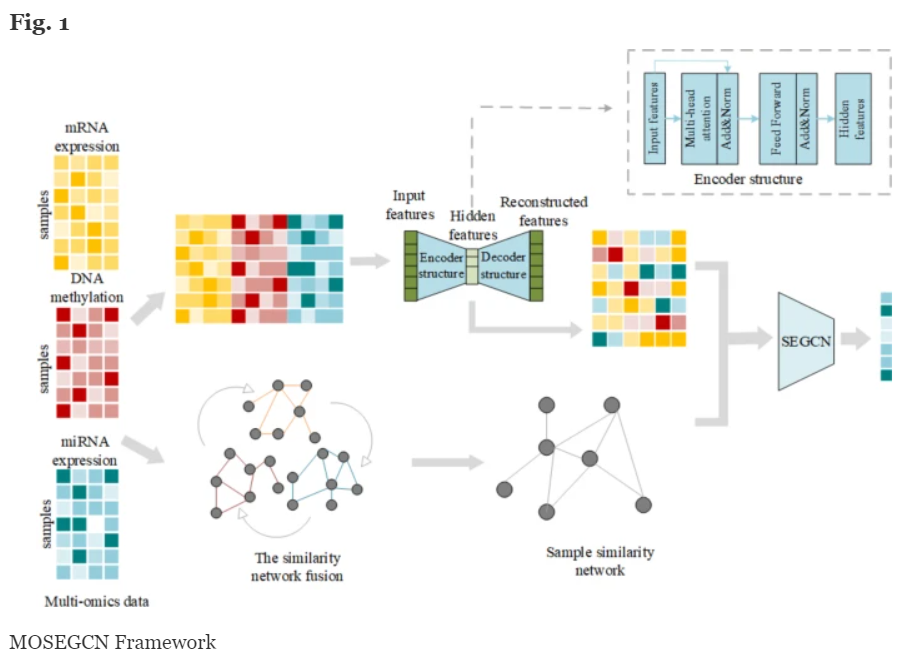
Wang, J., Liao, N., Du, X. et al. A semi-supervised approach for the integration of multi-omics data based on transformer multi-head self-attention mechanism and graph convolutional networks. BMC Genomics 25, 86 (2024). https://doi.org/10.1186/s12864-024-09985-7 Searched 2 sites
- Uses a semi-supervised learning framework for disease classification, combining transformer multi-head self-attention mechanisms with graph convolutional networks (GCNs) to extract meaningful relationships between samples. The model integrates labeled and unlabeled omics data, using the attention mechanism to capture dependencies across features and GCNs to capture graph-based relationships.
- Omics used: mRNA expression, microRNA expression, and DNA methylation. These data types are integrated to improve the prediction accuracy of disease classifications, such as Alzheimer's disease and breast cancer.
- Self-Attention Mechanism: Captures intra- and inter-modality feature dependencies.
- Graph Convolutional Networks (GCNs): Extract structural information from the multi-omics graph, enabling better representation of relationships between data points.
- Semi-Supervised Learning: Utilizes both labeled and unlabeled data to improve model training, mitigating the limitations of small labeled datasets often found in multi-omics studies.
Latest trends - single cell integration
- Using SNF and autoencoders for single cell clustering
- Tran, B., Tran, D., Nguyen, H. et al. scCAN: single-cell clustering using autoencoder and network fusion. Sci Rep 12, 10267 (2022). https://doi.org/10.1038/s41598-022-14218-6
Consensus clustering
- Monti, S., Tamayo, P., Mesirov, J. et al. Consensus Clustering: A Resampling-Based Method for Class Discovery and Visualization of Gene Expression Microarray Data. Machine Learning 52, 91–118 (2003). https://doi.org/10.1023/A:1023949509487
- Implementation: http://www.bioconductor.org/packages/release/bioc/html/CancerSubtypes.html
SNF drawbacks:
- the unstable nature of kernel-based clustering
- sensitive to small changes in molecular measurements
- need for hyper-parametrization
Details:
- The data are first partitioned with different values of k (number of clusters).
- For each value of k, we construct the pair-wise connectivity matrix.
- To identify the number of clusters we add noise to the data and then build the pairwise connectivity for the perturbed data.
- We calculate the discrepancy in pairwise connectivity before and after data perturbation. We choose opt_k as the optimal number of clusters for which the pair-wise connectivity is the most stable.
Integrative SNF-CC example:
- Nguyen, Tin et al. “A novel approach for data integration and disease subtyping.” Genome research vol. 27,12 (2017): 2025-2039.
- https://www.ncbi.nlm.nih.gov/pmc/articles/PMC5741060/
Stages:
- construct the combined similarity matrix between patients using the connectivity information from individual data types.
- partition the patients using the integrated similarity matrix.
- further split each discovered group of patients into subgroups if possible.
Weighted similarity network fusion
Links:
- Xu T, Le TD, Liu L, Wang R, Sun B, et al. (2016) Identifying Cancer Subtypes from miRNA-TF-mRNA Regulatory Networks and Expression Data. PLOS ONE 11(4): e0152792. https://doi.org/10.1371/journal.pone.0152792
- Implementation:
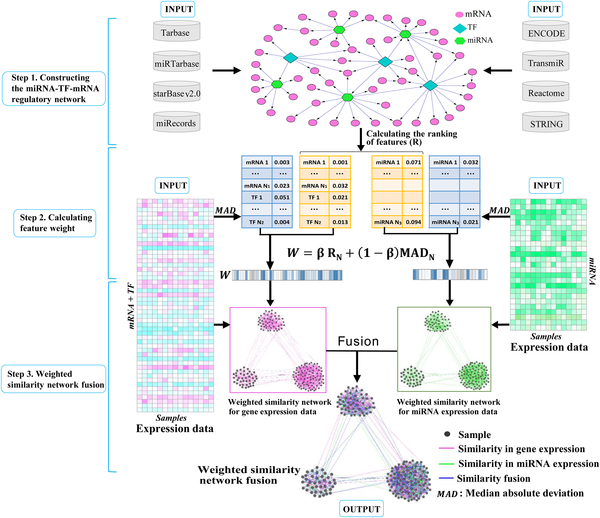
WSNF - Method (1)
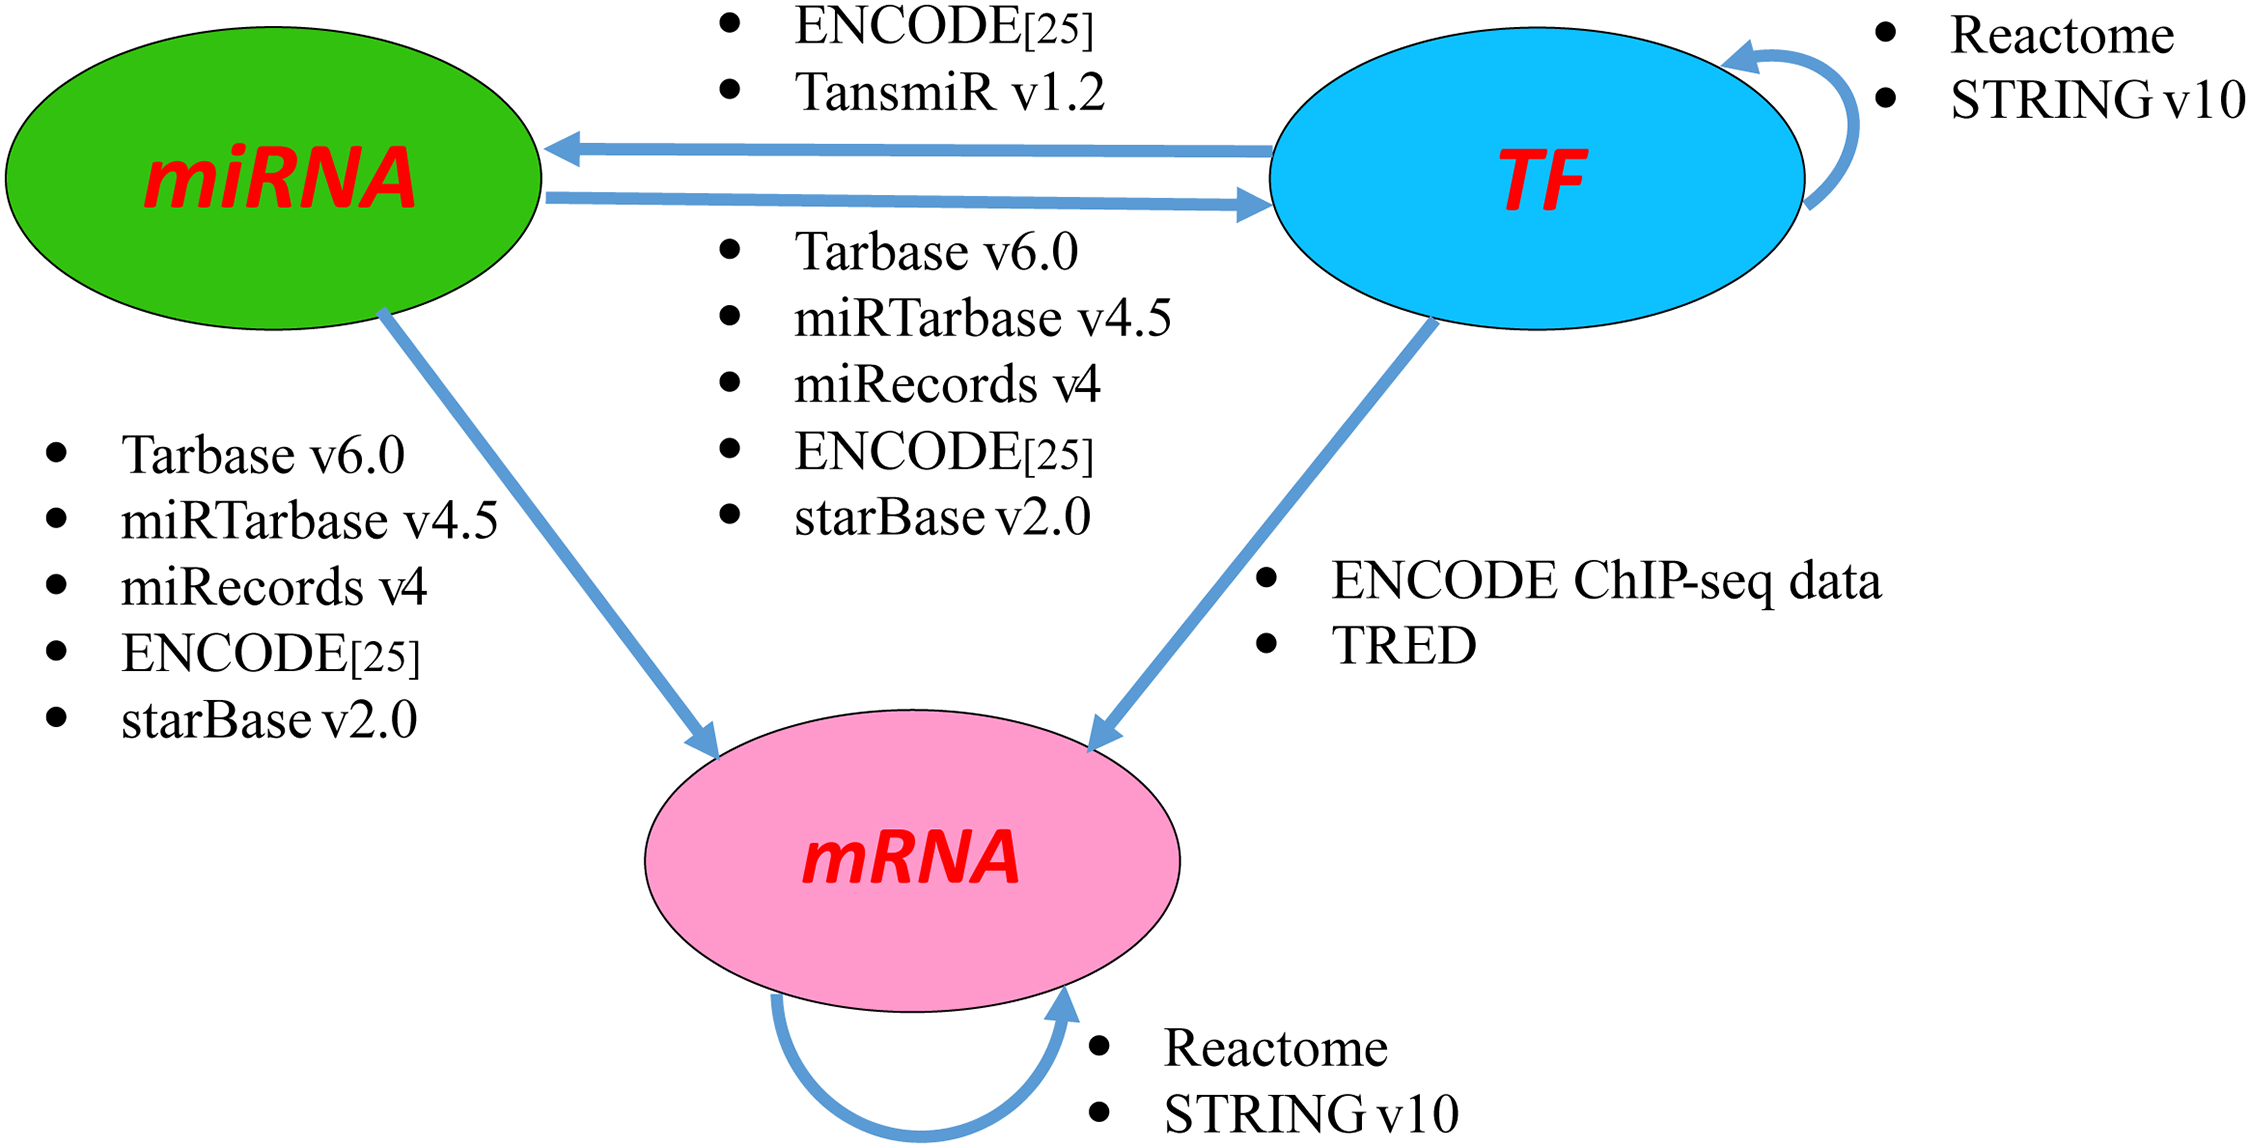
- Compute PageRank based ranking of features. Important features are ranked based on the in-number of TFs.
- Build the regulatory network where the nodes represent the features, i.e. the microRNAs (miRNAs), transcription factors (TFs) and messenger RNAs (mRNAs) and the edges indicate the interactions between the features.
- The interactions are retrieved from various interatomic databases.
WSNF - Method (2)
- Integrate feature ranking with feature variation. Gene expression based.
- Use knn based kernels and the expression data of the miRNAs, TFs and mRNAs to calculate the weight of the features, representing the level of importance of the features.
- Weighted SNF
- The feature weight is then integrated into a network fusion approach to cluster the samples (patients) and thus to identify cancer subtypes.
- $D(s_i, s_j) = \sqrt{\sum_{m=1}^p{W(f_m)*(f_m^{s_i}-f_m^{s_j})^2}}$
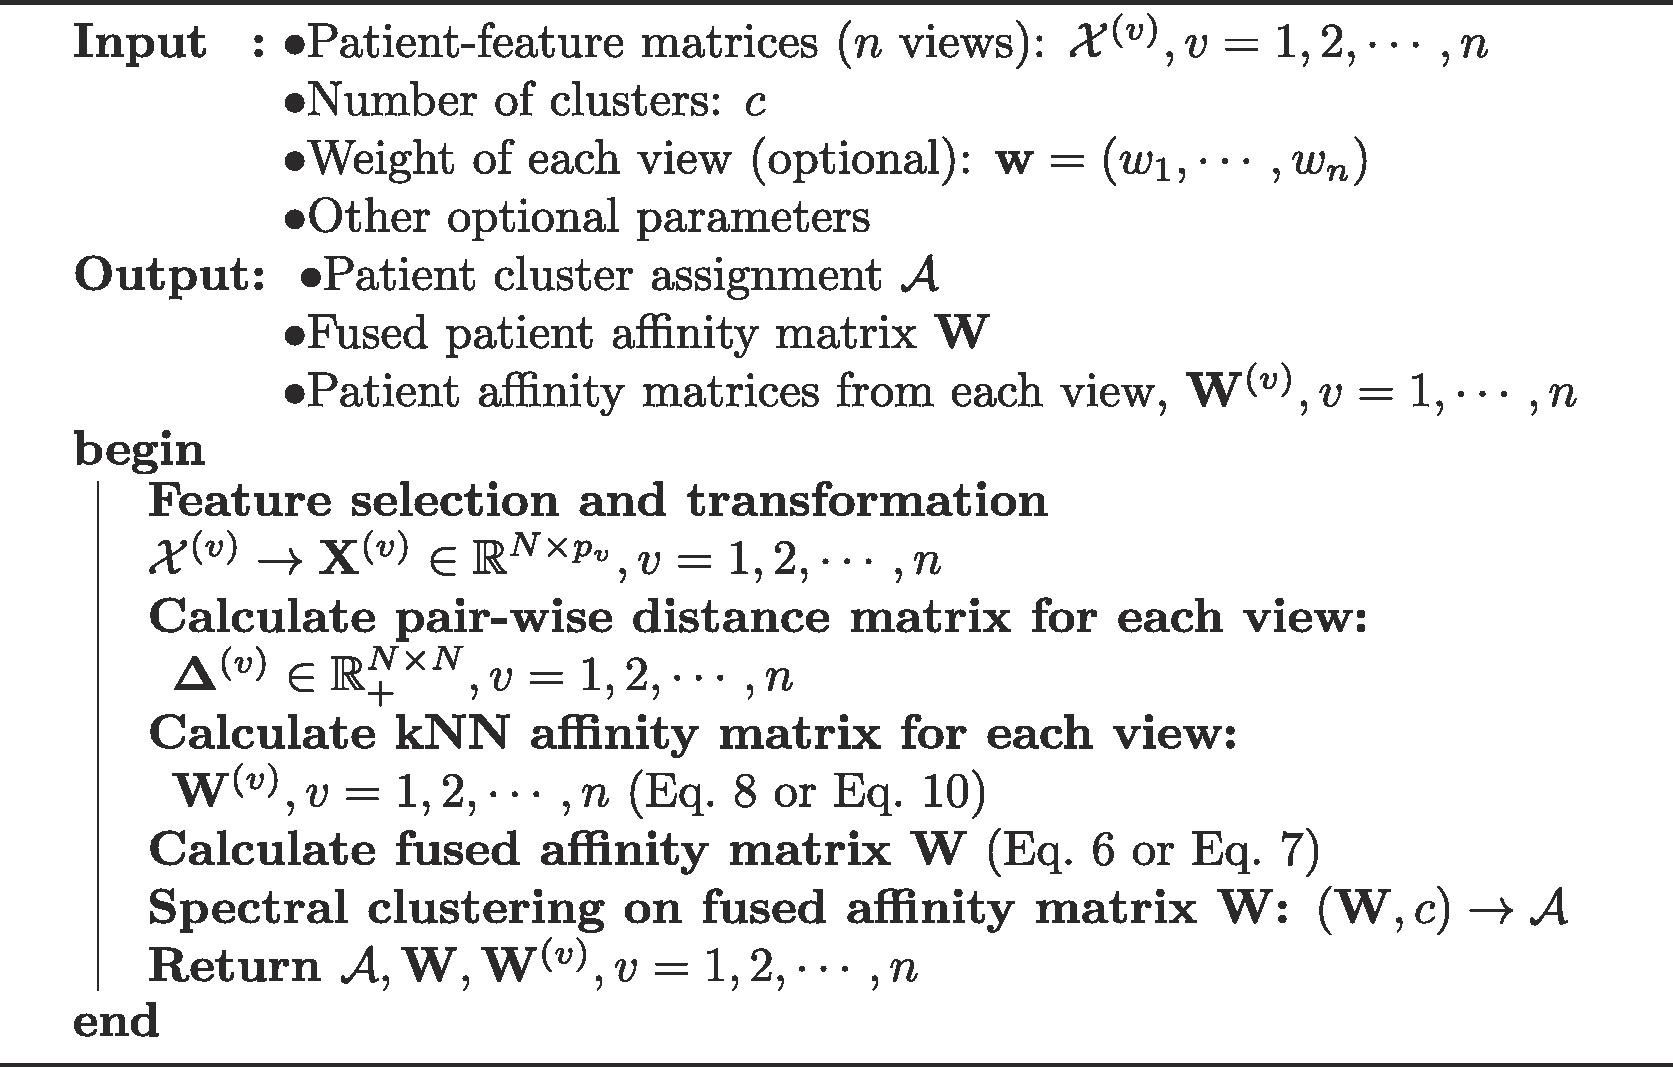
ANF - Affinity network fusion
- Tianle Ma, Aidong Zhang, Affinity Network Fusion and Semi-supervised Learning for Cancer Patient Clustering, 2019, https://doi.org/10.1016/j.ymeth.2018.05.020
- Software: https://www.bioconductor.org/packages/release/bioc/html/ANF.html
- Data: gene expression, miRNA expression and DNA methylation
- Overall, the methodology is similar to SNF. Weak edges derived from a similarity distance are pruned using a kNN based kernel. The same is acomplished using the message passing kernel in SNF.
- The matrix fusion process is random-walk based, and it is a bit more clear, although it parametrizes feature importance with a set of omics-specific weights:
- $ W = \sum_{v=1}^n{w_v * W^{(v)}}$, $\sum_{v=1}^n{w_v}=1$
- W regarded as a "state transition matrix", and multiplying it r times is a random walk in its generated graph. $W = W^r$
- this step is similar to the inductive message passing in SNF
- r parameter must be small (2, 3), or W becomes a rank one matrix
- a more complex random walk was also explored, that uses some of the knn pruned weaker edges.
Obs. While the SNF fitting process might look long, the patient matrix is usually a small network (most clinical datasets are in the order of tens - hundreds)!
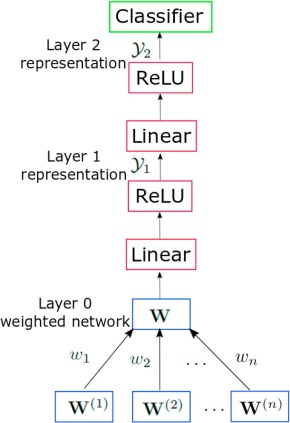
ANF application - Semi-supervised learning on patient affinity networks
https://arxiv.org/abs/1805.09673
- a good example for the potential of NF to combine supervised and unsupervised learning through good representation learning.
- 97% accuracy on test set with training less than 1% of data for classifying patients into correct disease types
- ANF obtains effective kNN-based nonlinear transformations that reduce noise in multi-omic data
Subsequent SNF studies:
- Guo, Yang et al. “Improvement of cancer subtype prediction by incorporating transcriptome expression data and heterogeneous biological networks.” BMC medical genomics vol. 11,Suppl 6 119. 31 Dec. 2018, doi:10.1186/s12920-018-0435-x
- https://www.ncbi.nlm.nih.gov/pmc/articles/PMC6311915/
Main ideas:
- ANF did not consider the feature importance and the feature relationships in data integration (different regulatory mechanisms may exist in different cancer subtypes).
- Method: CSPRV (Cancer Subtype Prediction using RV2)
Given the expression data of genome elements, we first extract multiple expression features for each regulatory element based on the heterogeneous biological networks. Based on the extracted feature matrices of samples, we use a matrix correlation method, RV2, to predict the similarities between samples in each expression data-view, and then fuse the similarity information in samples from all considering data-views according to different integration weights. Finally, we cluster patient samples into different cancer subtypes based on the predicted integrative similarity network between samples.
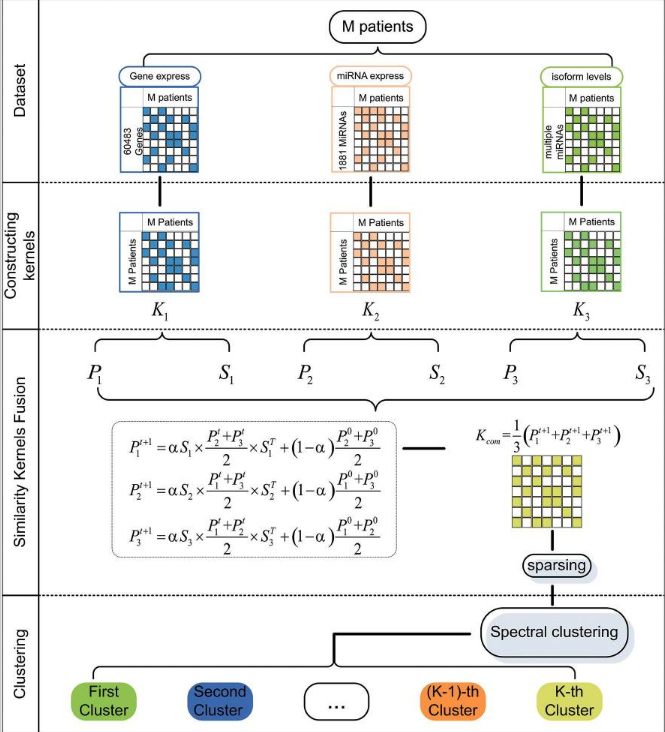
SKF - Similarity Kernel Fusion
- https://en.wikipedia.org/wiki/Kernel_method
- multiple papers:
- Jiang, Limin et al. “Discovering Cancer Subtypes via an Accurate Fusion Strategy on Multiple Profile Data.” Frontiers in genetics vol. 10 20. 5 Feb. 2019, doi:10.3389/fgene.2019.00020
- https://www.ncbi.nlm.nih.gov/pmc/articles/PMC6370730/
- https://pubmed.ncbi.nlm.nih.gov/30619454/
- https://pubmed.ncbi.nlm.nih.gov/31514111/
- Also search for MKL (multiple kernel learning)
The Kernel trick
- (wikipedia) "kernel functions, enable them to operate in a high-dimensional, implicit feature space without ever computing the coordinates of the data in that space, but rather by simply computing the inner products between the images of all pairs of data in the feature space."
$P_l^{t+1}=\alpha(S_l \times \frac{\sum_{r \neq l}P_r^t}{n} \times S_l^T) + (1-\alpha) \frac{\sum_{r \neq l}P_r^t}{n}$
Software, papers, further reading
Papers:
- SNF similarity network fusion: https://www.nature.com/articles/nmeth.2810
- SNF.CC: https://www.ncbi.nlm.nih.gov/pmc/articles/PMC5741060/
- WSNF: https://journals.plos.org/plosone/article?id=10.1371/journal.pone.0152792
- SKF: https://www.ncbi.nlm.nih.gov/pmc/articles/PMC6370730/#:~:text=(2016)%20proposed%20Weighted%20Similarity%20Network,cancer%20types%20to%20demonstrate%20performance.
- Speicher and Pfeifer (2015) https://pubmed.ncbi.nlm.nih.gov/26072491/ pointed out that iCluster has high computational complexity and proposed a dimensionality reduction method to integrate multiple similarity kernels. This method is evaluated by using five cancer types.
- ANF affinity network fusion: https://arxiv.org/abs/1805.09673
- INF integrative network fusion: https://www.frontiersin.org/articles/10.3389/fonc.2020.01065/full
- fusion methods review (2020): https://www.sciencedirect.com/science/article/pii/S2001037019304155
- icluster: https://journals.plos.org/plosone/article?id=10.1371/journal.pone.0035236
- IntClust https://rdrr.io/cran/IntClust/
Software: