| avg_log2FC | p_val_adj | |
|---|---|---|
| CD7 | 5.535220 | 0.0000001 |
| LCK | 3.605886 | 0.0000046 |
| HLA-DPB1 | -5.291575 | 0.0000051 |
| HLA-DRA | -4.128576 | 0.0000126 |
| HLA-DRB1 | -5.027130 | 0.0000172 |
| GNLY | 8.198735 | 0.0000191 |
| GZMM | 3.120563 | 0.0000767 |
| CD3D | 2.255304 | 0.0000805 |
| GZMA | 3.078594 | 0.0001174 |
| HLA-DPA1 | -3.661491 | 0.0002595 |
Differential Gene Expression
Single Cell RNA-Seq Analysis
15-Apr-2026

What is differential gene expression?

Count data -> statistical analysis -> Are differences significant (greater than expected randomly)
Statistical tests
- Null hypothesis: Mean/median/distribution is equal between group A and group B
- p < 0.05 : if null hypothesis is true, we can expect the measured result in < 5% of cases where group A and group B have been sampled with sample size \(n\)
- Statistical significance: The result is likely to be from a true difference rather than random chance
What is differential gene expression?

What is differential gene expression?

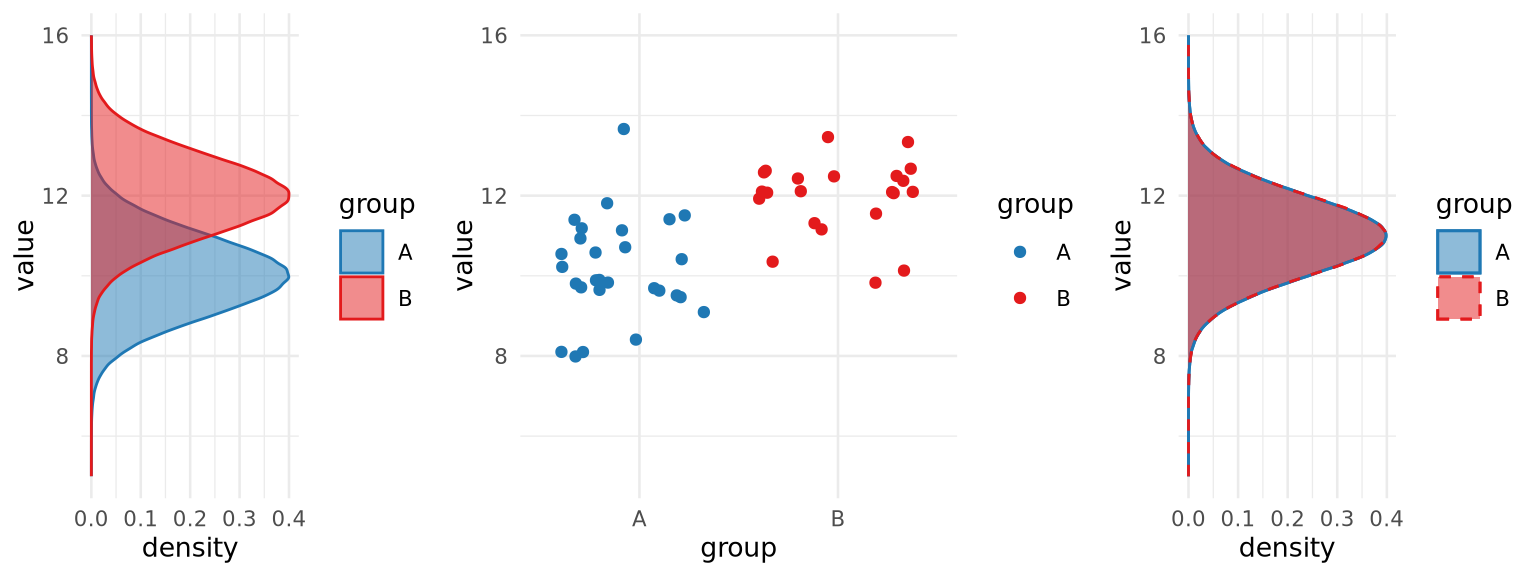
(Modified from Tiberi et al., 2023)
- Most methods focus on difference in mean
- Many different distributions will show a difference in means
- But not all!
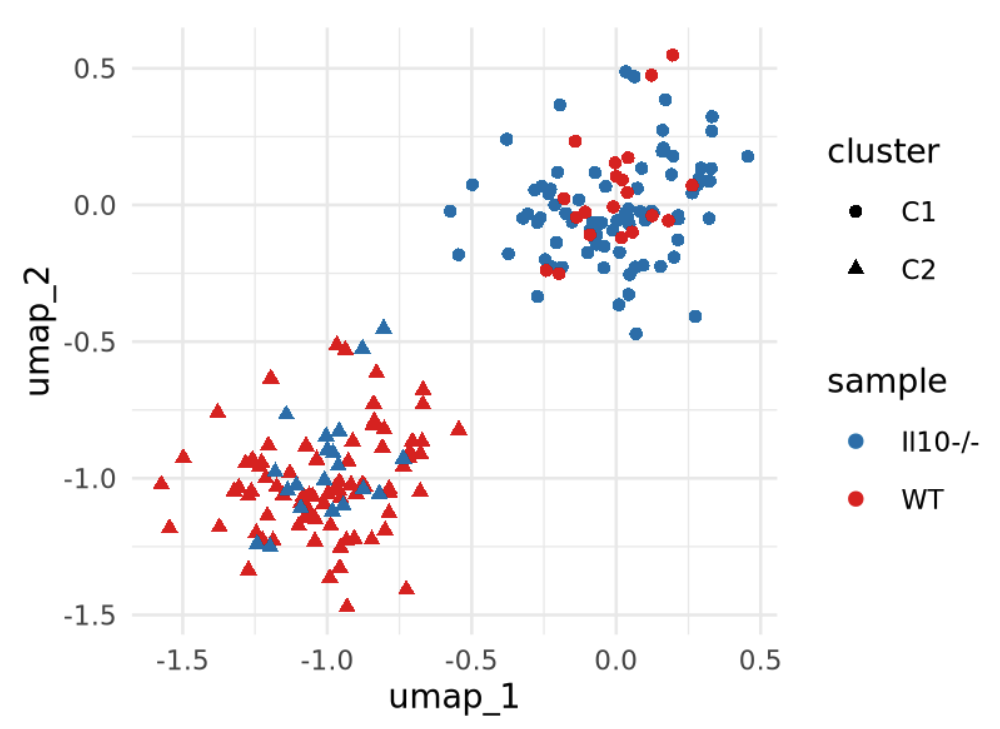
Defining groups of interest
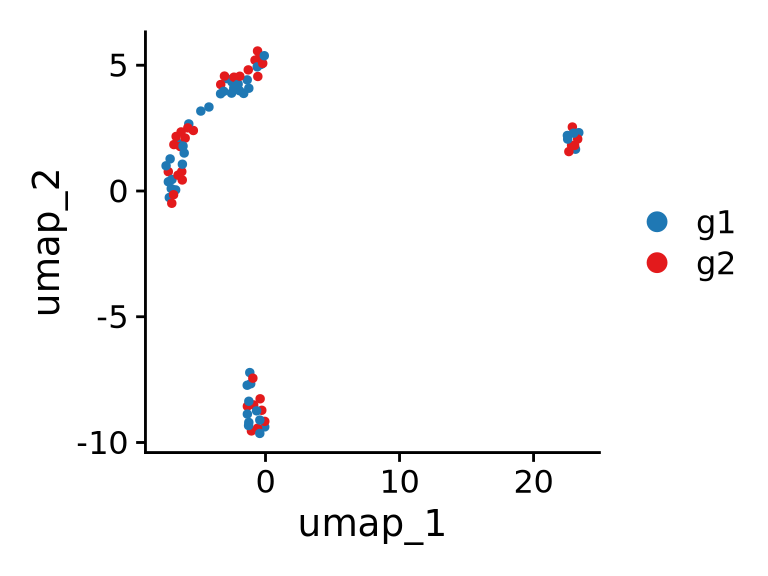
A priori defined groups: Compare cells from different samples, e.g.:
- Experimental groups (treatment, time points, clinical information etc)
- Sorted cells
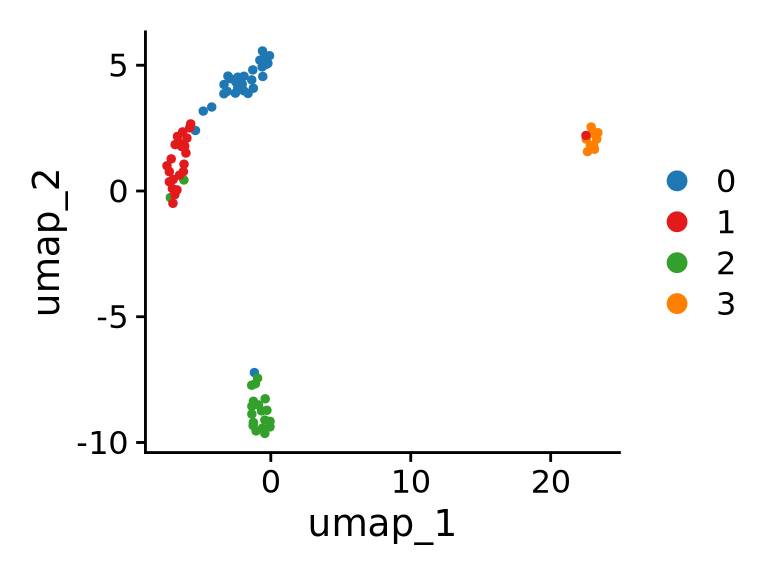
Data-driven definition of groups: Compare cells depending on analysis output, e.g.:
- RNA-based clustering/identity
- Identity based on other data from multi-omics
Warning: Performing DE on clusters defined with the same data (“double-dipping”) will inflate DE analysis. Be mindful of this when you interpret the results.
Distributions
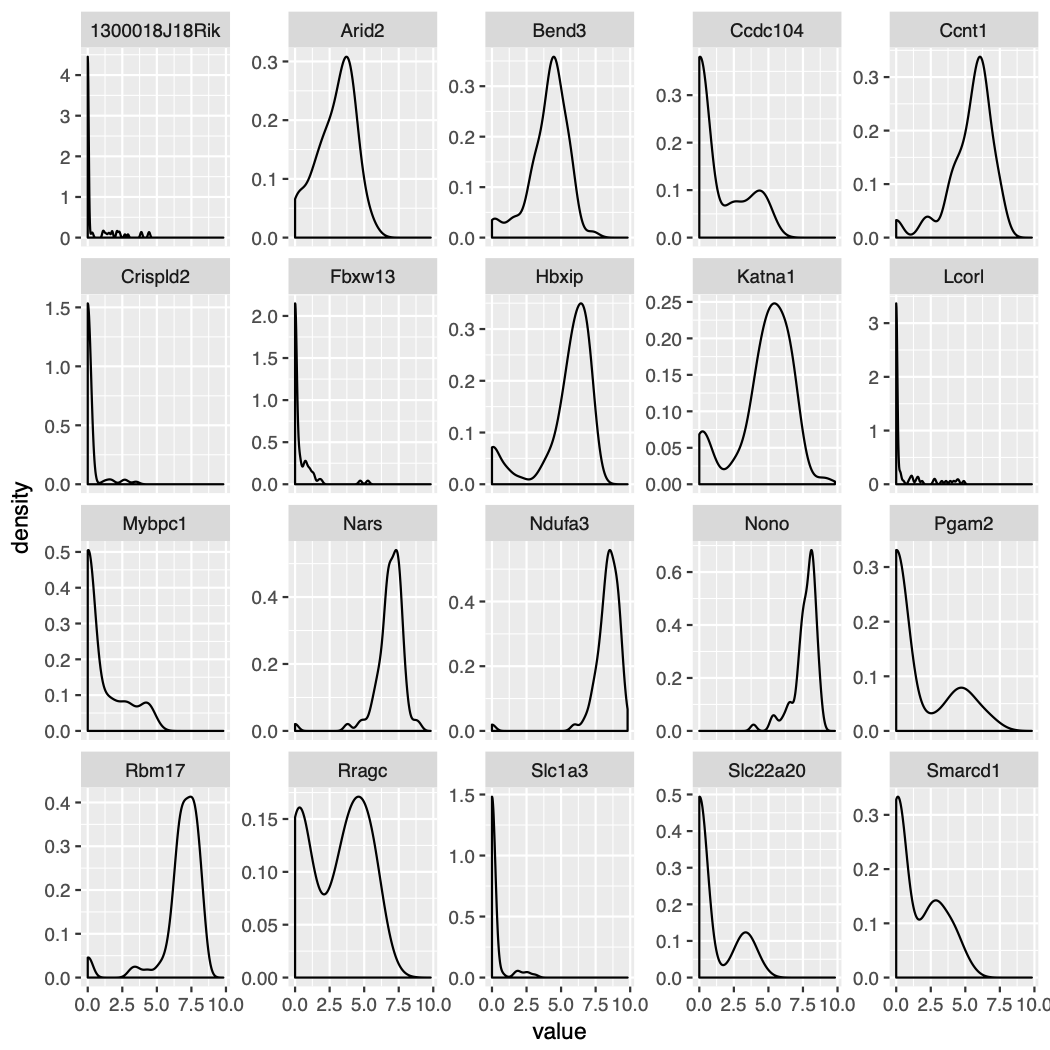
- High noise (technical + biology)
- Low library sizes
- Low mRNA quantity
- Amplification bias, drop-outs
- 3’ bias, partial coverage
- Bursting
- Mixed cell types
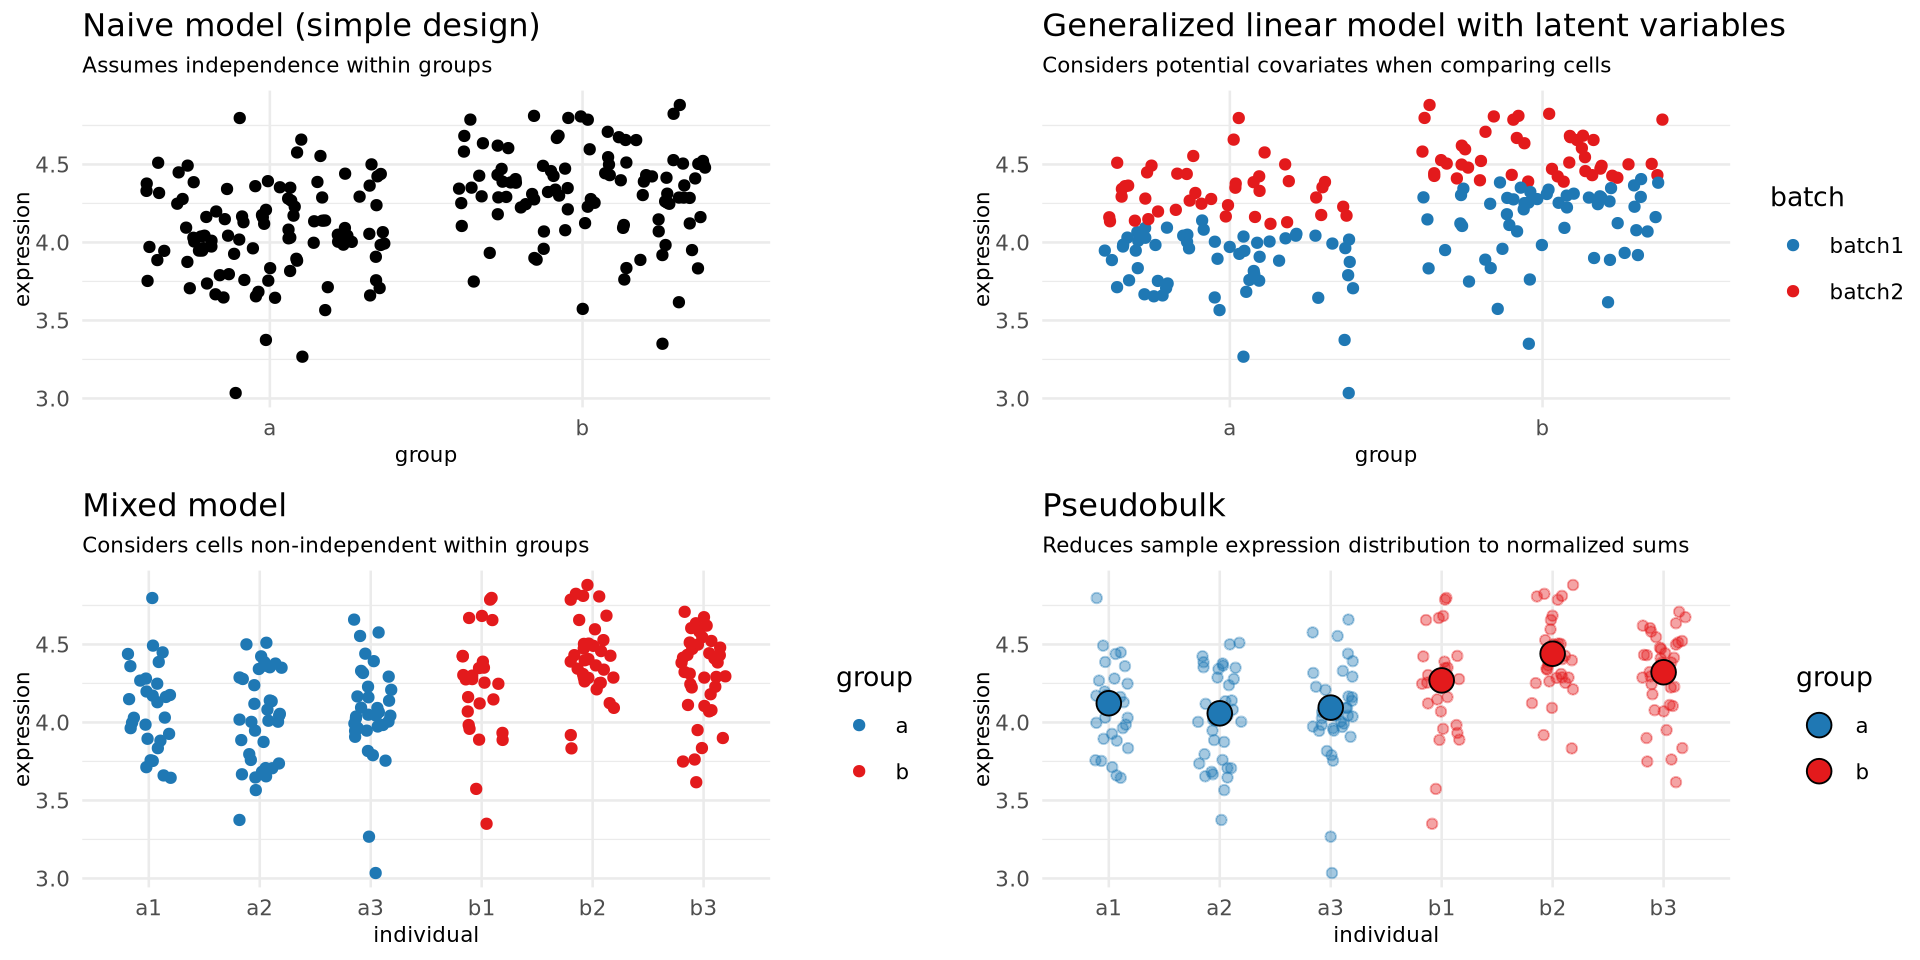
Complex designs: Groups of samples
Example: 3 patients vs 3 controls
\(n\): Number of cells (1000s) or number of individuals (3)?
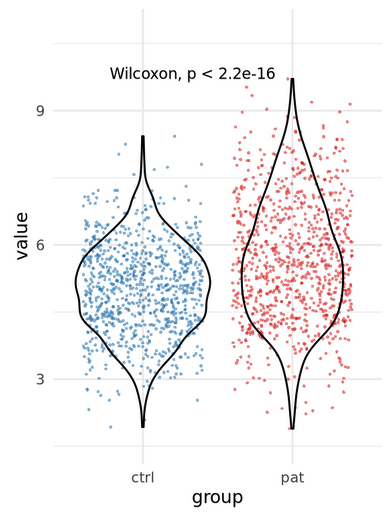
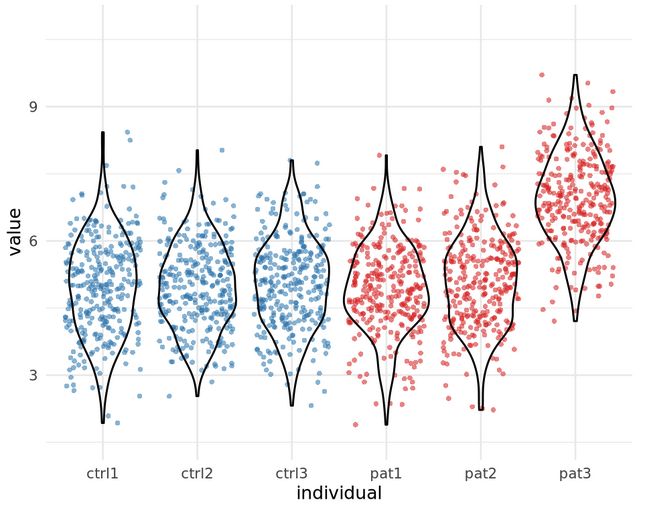
Many tests assume independence!
Complex designs: Covariates
Complex designs: Covariates
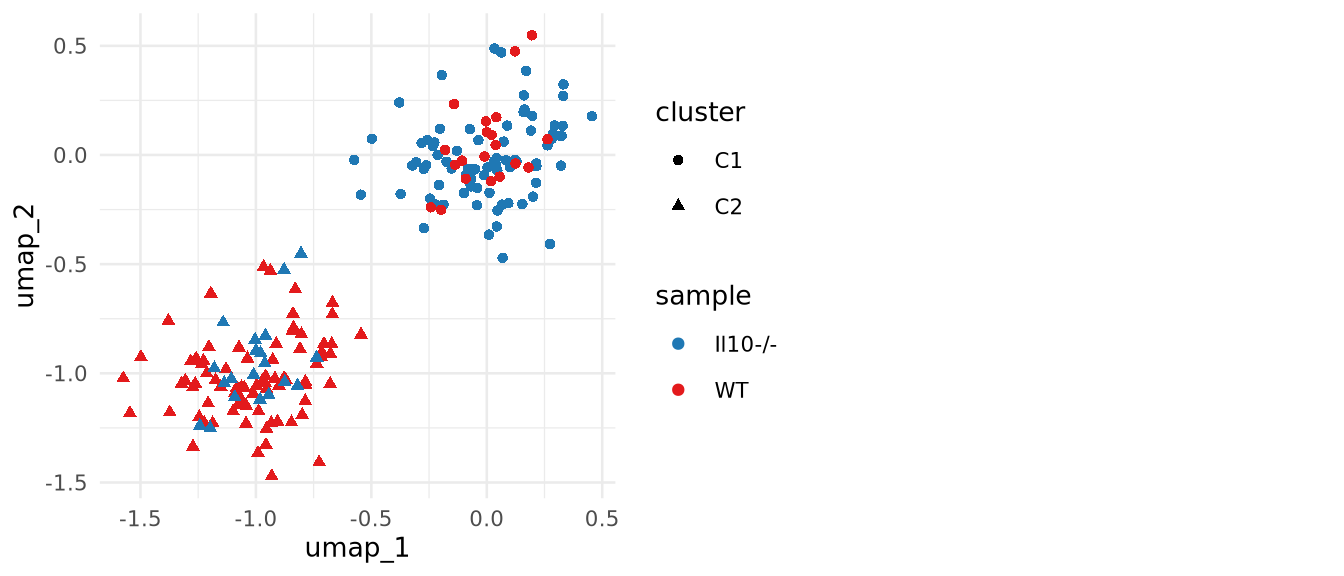
Complex designs: Approaches
1-vs-1 and 1-vs-all

- 1-vs-1: C1 vs C2
- 1-vs-all: C1 vs C0 + C2 + C3
1-vs-all analysis
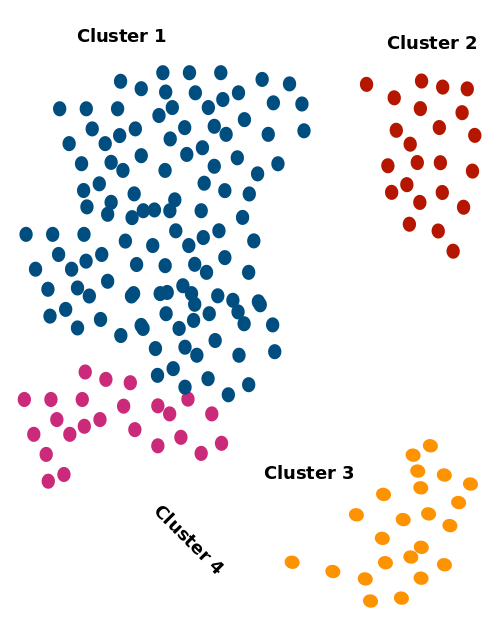
- Larger clusters will be over-represented unless subsampled
- Highly similar clusters
- Will have most of their DEGs overlapping
- Pairwise comparisons might help rather than 1 vs rest
Considerations - p-values
- p depends on n, variance and intergroup difference
- As n increases, variance can increase and difference can decrease without losing power
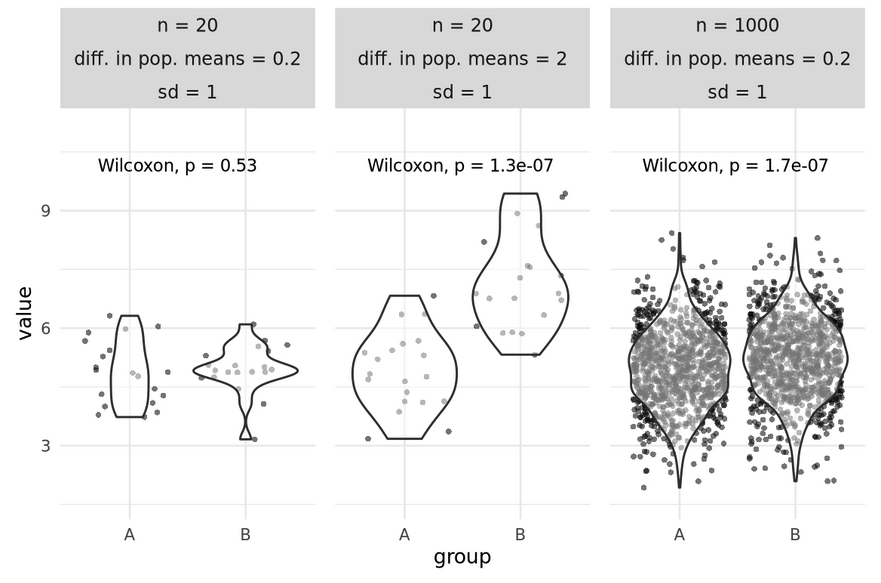
Are all statistically significant differences of interest for your research question?
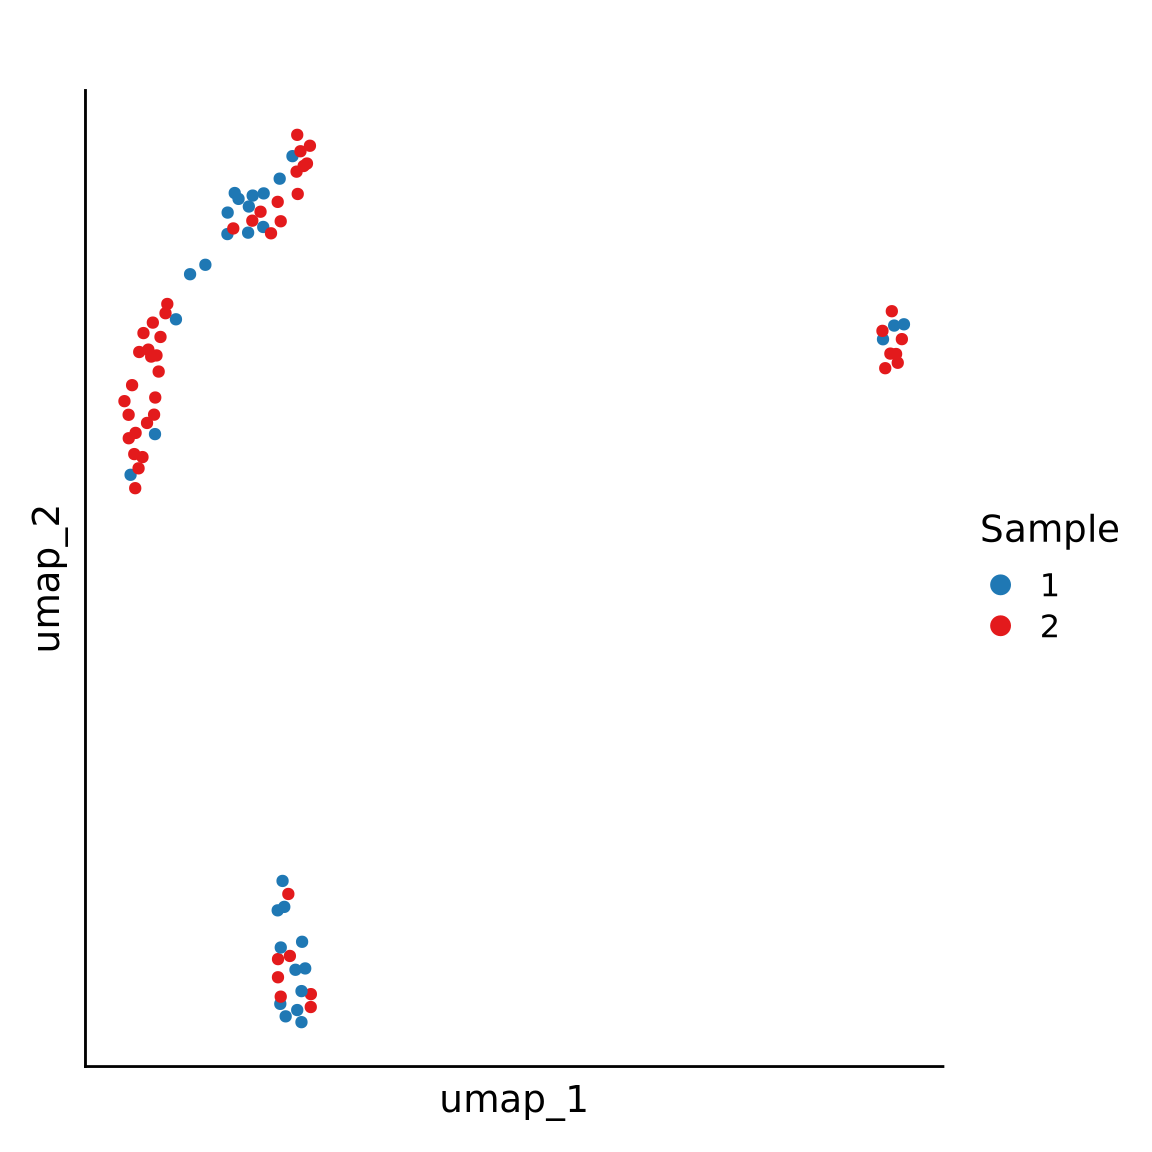
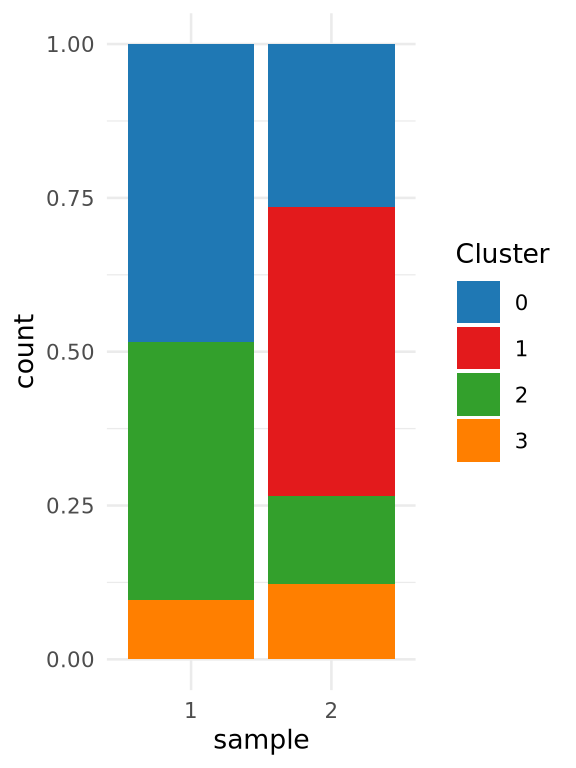
Considerations: Composition vs expression
| avg_log2FC | p_val_adj | pct.1 | pct.2 | |
|---|---|---|---|---|
| S100A9 | 5.064039 | 0.0008770 | 0.596 | 0.091 |
| BLVRA | 9.978062 | 0.0015398 | 0.468 | 0.000 |
| LYZ | 2.410713 | 0.0046767 | 0.809 | 0.394 |
| S100A8 | 5.340454 | 0.0147839 | 0.532 | 0.121 |
| TYMP | 2.232127 | 0.0324465 | 0.596 | 0.182 |
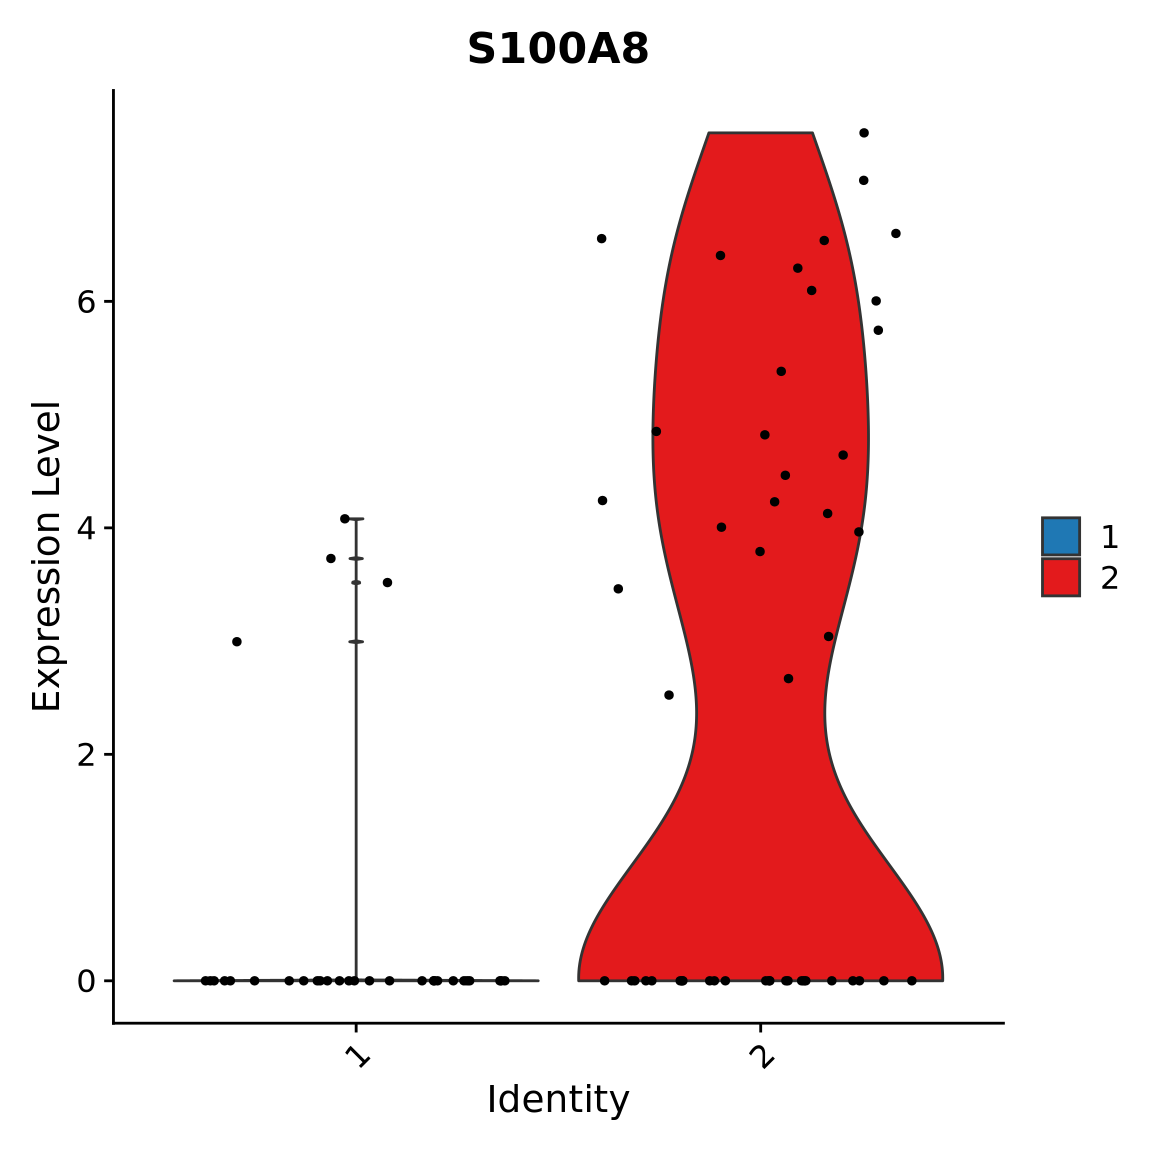
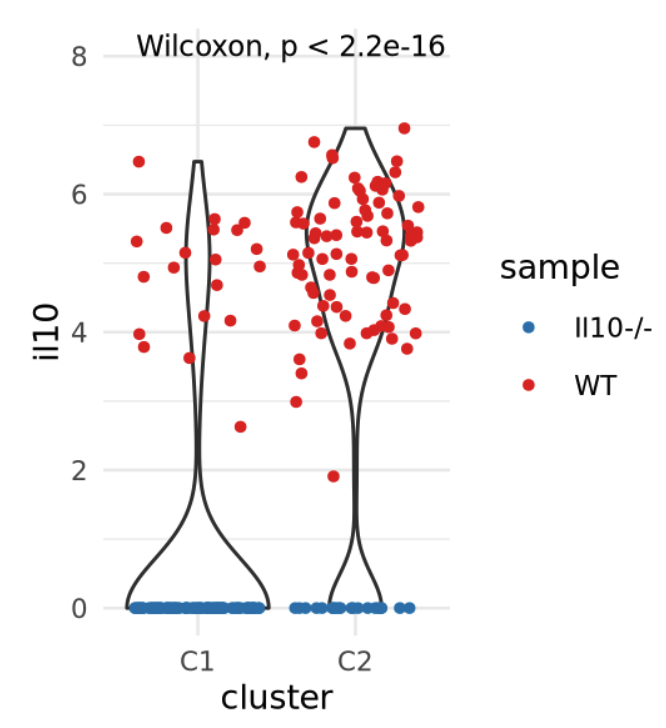
Assessing results
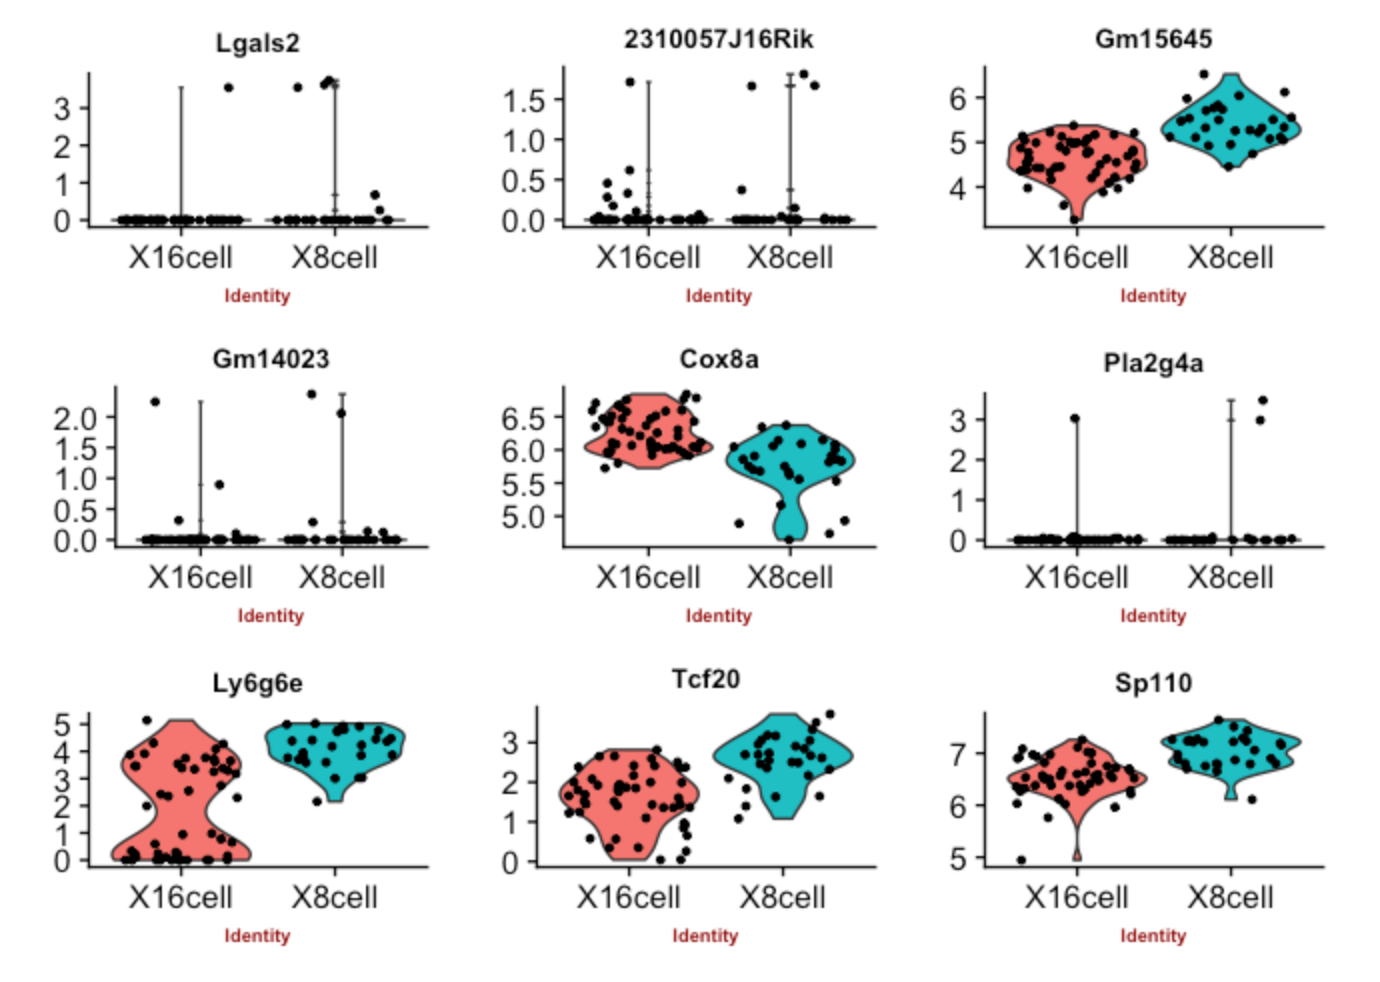
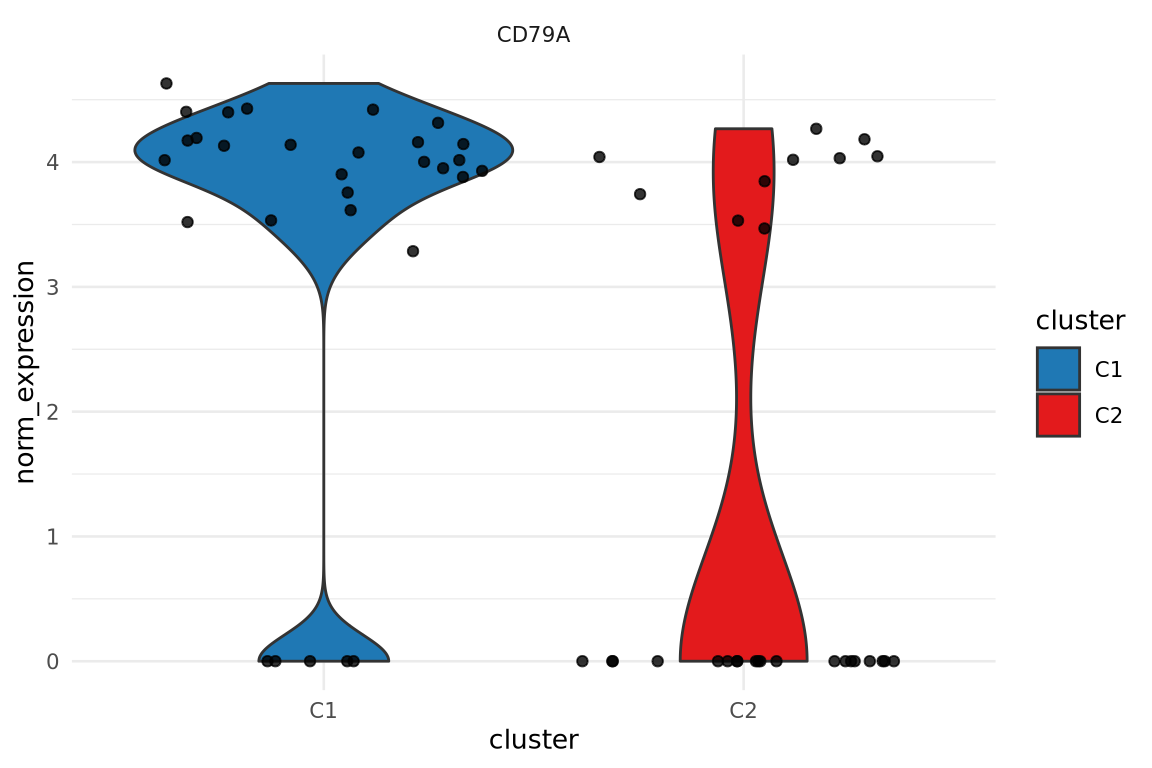
Violin plots are good to visualize distribution
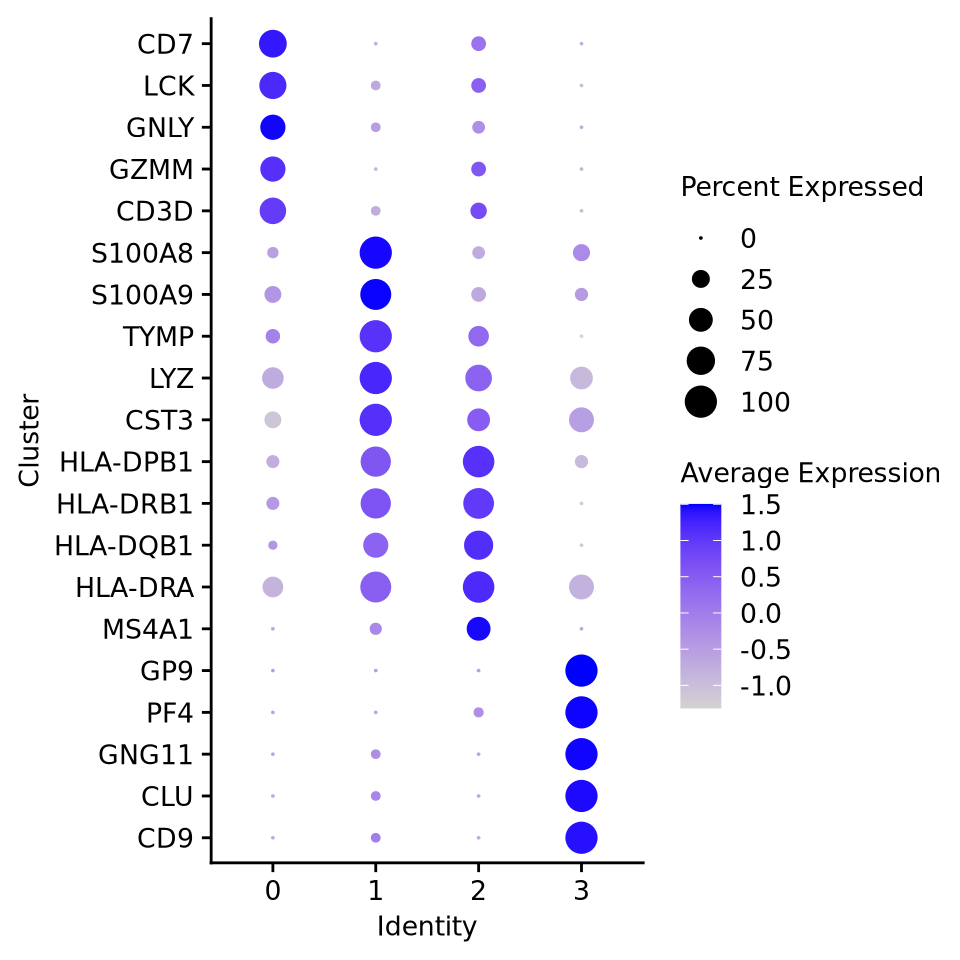
Dot plots give a quick overview of both expression and % of cells expressing a gene
Acknowledgements
Slides adapted from previous presentations by Olga Dethlefsen, Åsa Björklund, Vincent van Hoef and Roy Francis.