Celltype prediction

Seurat Toolkit

Assignment of cell identities based on gene expression patterns using reference data.
Authors

Åsa Björklund

Paulo Czarnewski

Susanne Reinsbach

Roy Francis

Published

18-Sep-2024

Note

Code chunks run R commands unless otherwise specified.

Celltype prediction can either be performed on indiviudal cells where each cell gets a predicted celltype label, or on the level of clusters. All methods are based on similarity to other datasets, single cell or sorted bulk RNAseq, or uses known marker genes for each cell type.
We will select one sample from the Covid data, ctrl_13 and predict celltype by cell on that sample.
Some methods will predict a celltype to each cell based on what it is most similar to, even if that celltype is not included in the reference. Other methods include an uncertainty so that cells with low similarity scores will be unclassified.
There are multiple different methods to predict celltypes, here we will just cover a few of those.

We will use a reference PBMC dataset from the scPred package which is provided as a Seurat object with counts. Unfortunately scPred has not been updated to run with Seurat v5, so we will not use it here. We will test classification based on Seurat labelTransfer, the SingleR method scPred and using Azimuth. Finally we will use gene set enrichment predict celltype based on the DEGs of each cluster.

1 Read data

First, lets load required libraries

suppressPackageStartupMessages({
    library(Seurat)
    library(dplyr)
    library(patchwork)
    library(ggplot2)
    library(pheatmap)
    library(scPred)
    library(celldex)
    library(SingleR)
    library(SeuratData)
    library(Azimuth)
})

Let’s read in the saved Covid-19 data object from the clustering step.

# download pre-computed data if missing or long compute
fetch_data <- TRUE

# url for source and intermediate data
path_data <- "https://export.uppmax.uu.se/naiss2023-23-3/workshops/workshop-scrnaseq"
path_file <- "data/covid/results/seurat_covid_qc_dr_int_cl.rds"
if (!dir.exists(dirname(path_file))) dir.create(dirname(path_file), recursive = TRUE)
if (fetch_data && !file.exists(path_file)) download.file(url = file.path(path_data, "covid/results/seurat_covid_qc_dr_int_cl.rds"), destfile = path_file)
alldata <- readRDS(path_file)

Subset one patient.

ctrl <- alldata[, alldata$orig.ident == "ctrl_13"]

2 Reference data

Load the reference dataset with annotated labels that is provided by the scPred package, it is a subsampled set of cells from human PBMCs.

reference <- scPred::pbmc_1
reference
An object of class Seurat 
32838 features across 3500 samples within 1 assay 
Active assay: RNA (32838 features, 0 variable features)
 2 layers present: counts, data

Rerun analysis pipeline. Run normalization, feature selection and dimensionality reduction

Here, we will run all the steps that we did in previous labs in one go using the magittr package with the pipe-operator %>%.

reference <- reference %>%
    NormalizeData() %>%
    FindVariableFeatures() %>%
    ScaleData() %>%
    RunPCA(verbose = F) %>%
    RunUMAP(dims = 1:30)
DimPlot(reference, group.by = "cell_type", label = TRUE, repel = TRUE) + NoAxes()

Run all steps of the analysis for the ctrl sample as well. Use the clustering from the integration lab with resolution 0.5.

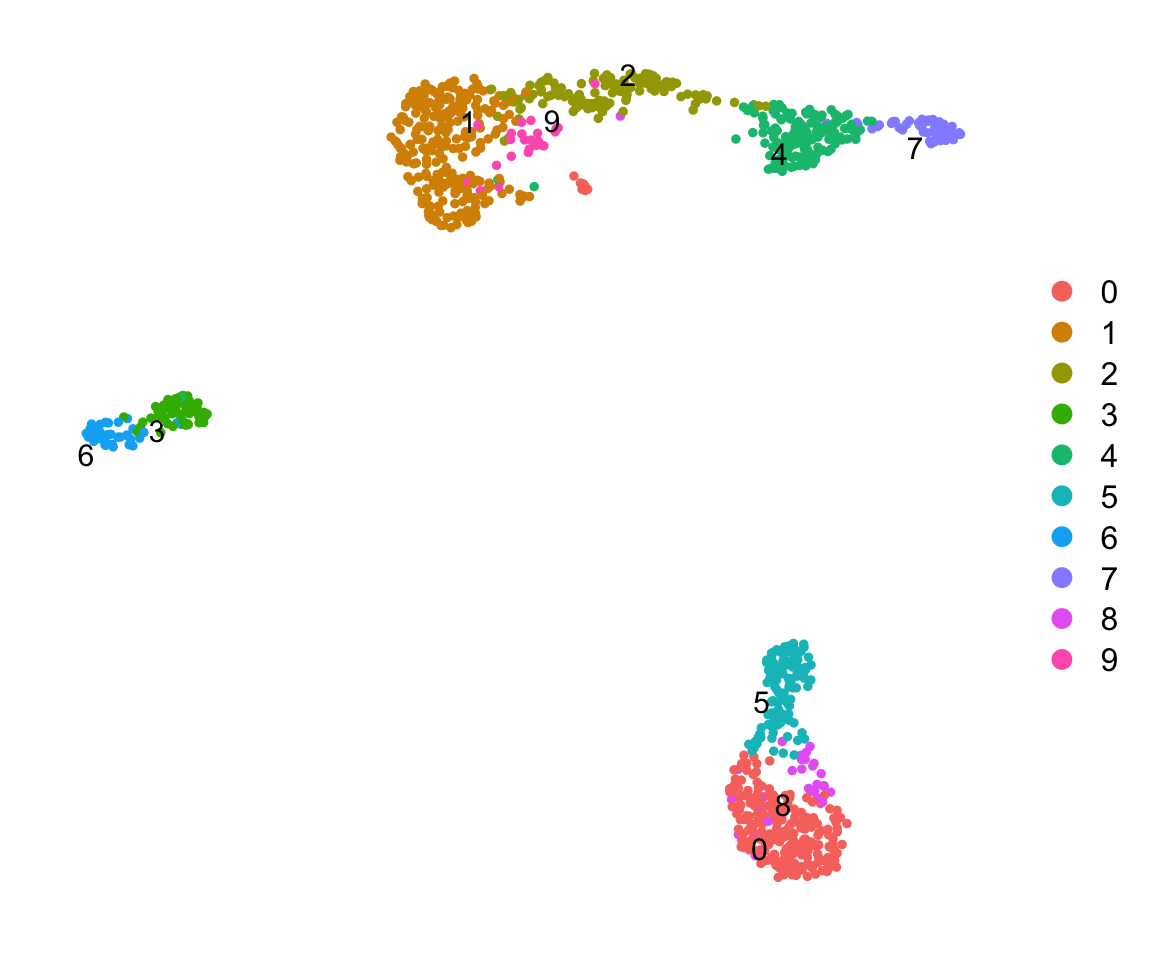
# Set the identity as louvain with resolution 0.5
ctrl <- SetIdent(ctrl, value = "RNA_snn_res.0.5")

ctrl <- ctrl %>%
    NormalizeData() %>%
    FindVariableFeatures() %>%
    ScaleData() %>%
    RunPCA(verbose = F) %>%
    RunUMAP(dims = 1:30)
DimPlot(ctrl, label = TRUE, repel = TRUE) + NoAxes()

3 Label transfer

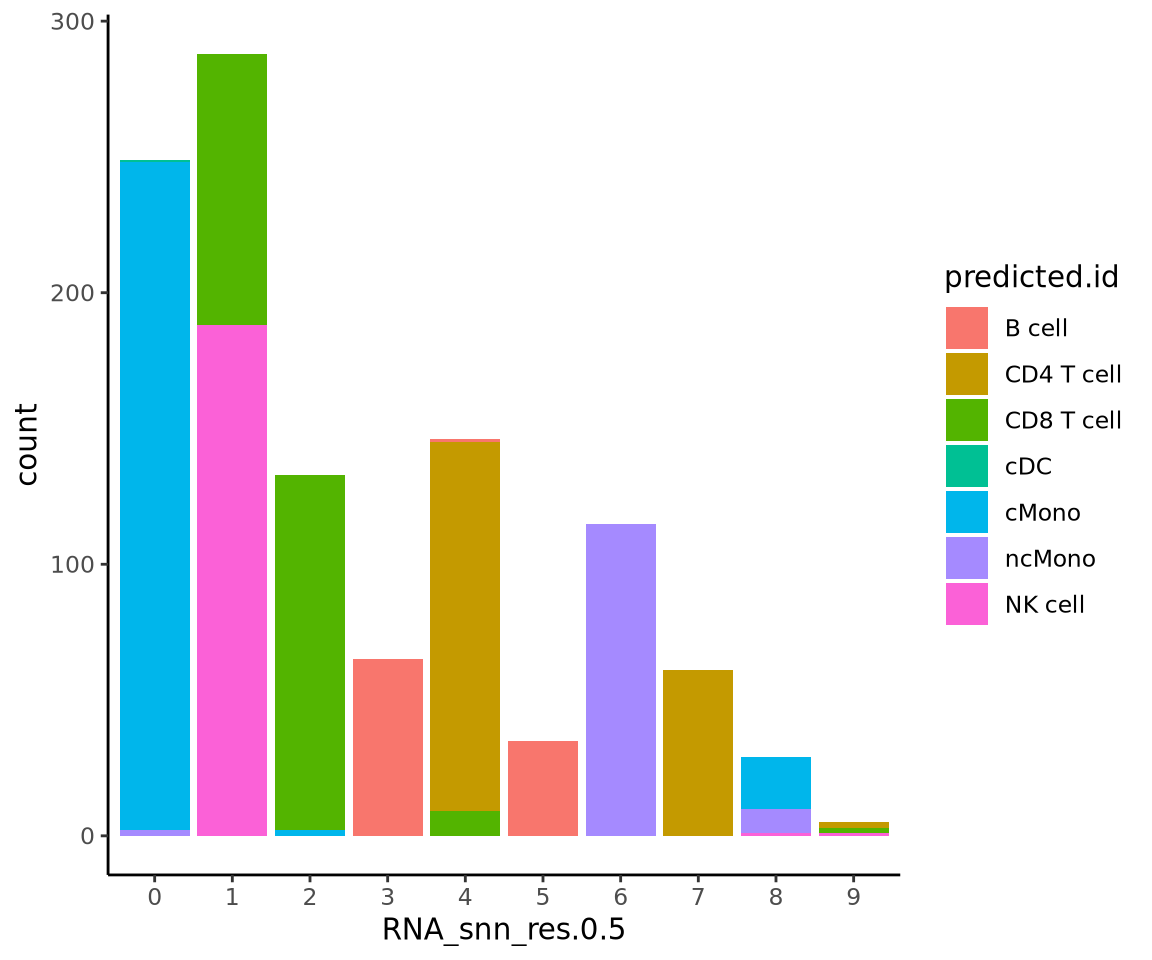
First we will run label transfer using a similar method as in the integration exercise. But, instead of CCA, which is the default for the FindTransferAnchors() function, we will use pcaproject, ie; the query dataset is projected onto the PCA of the reference dataset. Then, the labels of the reference data are predicted.

transfer.anchors <- FindTransferAnchors(
    reference = reference, query = ctrl,
    dims = 1:30
)
predictions <- TransferData(
    anchorset = transfer.anchors, refdata = reference$cell_type,
    dims = 1:30
)
ctrl <- AddMetaData(object = ctrl, metadata = predictions)
DimPlot(ctrl, group.by = "predicted.id", label = T, repel = T) + NoAxes()

Now plot how many cells of each celltypes can be found in each cluster.

ggplot(ctrl@meta.data, aes(x = RNA_snn_res.0.5, fill = predicted.id)) +
    geom_bar() +
    theme_classic()

4 SinlgeR

SingleR is performs unbiased cell type recognition from single-cell RNA sequencing data, by leveraging reference transcriptomic datasets of pure cell types to infer the cell of origin of each single cell independently.

We first have to convert the Seurat object to a SingleCellExperiment object.

sce = as.SingleCellExperiment(ctrl)

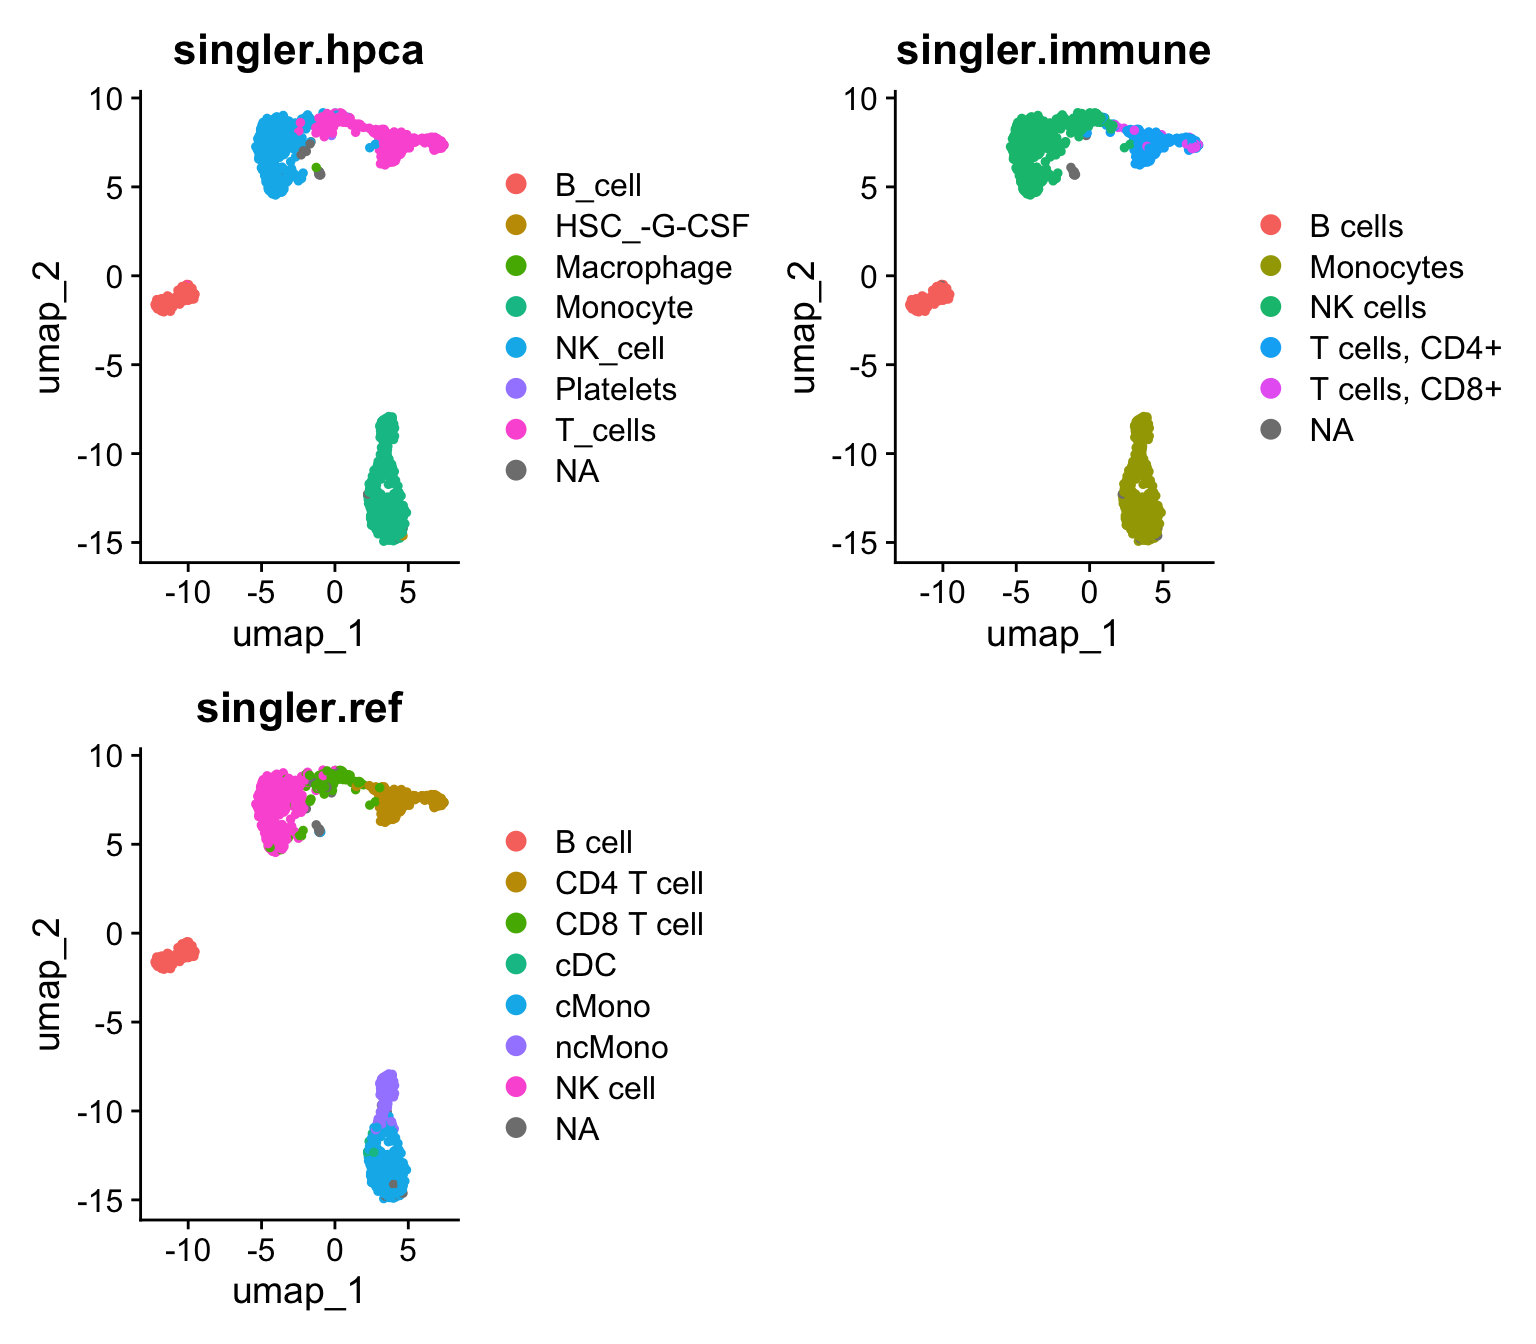
There are multiple datasets included in the celldex package that can be used for celltype prediction, here we will test two different ones, the DatabaseImmuneCellExpressionData and the HumanPrimaryCellAtlasData. In addition we will use the same reference dataset that we used for label transfer above but using SingleR instead.

4.1 Immune cell reference

immune = celldex::DatabaseImmuneCellExpressionData()
singler.immune <- SingleR(test = sce, ref = immune, assay.type.test=1,
    labels = immune$label.main)

head(singler.immune)
DataFrame with 6 rows and 4 columns
                                                       scores        labels
                                                     <matrix>   <character>
ctrl_13_AGGTCATGTGCGAACA-13  0.0679680:0.0760411:0.186694:... T cells, CD4+
ctrl_13_CCTATCGGTCCCTCAT-13  0.0027079:0.0960641:0.386088:...      NK cells
ctrl_13_TCCTCCCTCGTTCATT-13  0.0361115:0.1067465:0.394579:...      NK cells
ctrl_13_CAACCAATCATCTATC-13  0.0342030:0.1345967:0.402377:...      NK cells
ctrl_13_TACGGTATCGGATTAC-13 -0.0131813:0.0717678:0.283882:...      NK cells
ctrl_13_AATAGAGAGTTCGGTT-13  0.0841091:0.1367749:0.273738:... T cells, CD4+
                            delta.next pruned.labels
                             <numeric>   <character>
ctrl_13_AGGTCATGTGCGAACA-13  0.1375513 T cells, CD4+
ctrl_13_CCTATCGGTCCCTCAT-13  0.1490740      NK cells
ctrl_13_TCCTCCCTCGTTCATT-13  0.1220681      NK cells
ctrl_13_CAACCAATCATCTATC-13  0.1513308      NK cells
ctrl_13_TACGGTATCGGATTAC-13  0.0620657      NK cells
ctrl_13_AATAGAGAGTTCGGTT-13  0.0660296 T cells, CD4+

4.2 HPCA reference

hpca <- HumanPrimaryCellAtlasData()
singler.hpca <- SingleR(test = sce, ref = hpca, assay.type.test=1,
    labels = hpca$label.main)

head(singler.hpca)
DataFrame with 6 rows and 4 columns
                                                    scores      labels
                                                  <matrix> <character>
ctrl_13_AGGTCATGTGCGAACA-13 0.141378:0.310009:0.275987:...     T_cells
ctrl_13_CCTATCGGTCCCTCAT-13 0.145926:0.300045:0.277827:...     NK_cell
ctrl_13_TCCTCCCTCGTTCATT-13 0.132119:0.311754:0.274127:...     NK_cell
ctrl_13_CAACCAATCATCTATC-13 0.157184:0.302219:0.284496:...     NK_cell
ctrl_13_TACGGTATCGGATTAC-13 0.125120:0.283118:0.250322:...     T_cells
ctrl_13_AATAGAGAGTTCGGTT-13 0.191441:0.374422:0.329988:...     T_cells
                            delta.next pruned.labels
                             <numeric>   <character>
ctrl_13_AGGTCATGTGCGAACA-13  0.4918992       T_cells
ctrl_13_CCTATCGGTCCCTCAT-13  0.3241970       NK_cell
ctrl_13_TCCTCCCTCGTTCATT-13  0.0640608       NK_cell
ctrl_13_CAACCAATCATCTATC-13  0.2012408       NK_cell
ctrl_13_TACGGTATCGGATTAC-13  0.1545913       T_cells
ctrl_13_AATAGAGAGTTCGGTT-13  0.5063484       T_cells

4.3 With own reference data

sce.ref = as.SingleCellExperiment(reference)
singler.ref <- SingleR(test=sce, ref=sce.ref, labels=sce.ref$cell_type, de.method="wilcox")
head(singler.ref)
DataFrame with 6 rows and 4 columns
                                                    scores      labels
                                                  <matrix> <character>
ctrl_13_AGGTCATGTGCGAACA-13 0.740975:0.838990:0.805340:...  CD4 T cell
ctrl_13_CCTATCGGTCCCTCAT-13 0.647281:0.735248:0.815289:...     NK cell
ctrl_13_TCCTCCCTCGTTCATT-13 0.668322:0.732251:0.822483:...     NK cell
ctrl_13_CAACCAATCATCTATC-13 0.645869:0.719972:0.799716:...  CD8 T cell
ctrl_13_TACGGTATCGGATTAC-13 0.701719:0.772023:0.802647:...  CD8 T cell
ctrl_13_AATAGAGAGTTCGGTT-13 0.724356:0.846323:0.815530:...  CD4 T cell
                            delta.next pruned.labels
                             <numeric>   <character>
ctrl_13_AGGTCATGTGCGAACA-13  0.0383797    CD4 T cell
ctrl_13_CCTATCGGTCCCTCAT-13  0.0743326       NK cell
ctrl_13_TCCTCCCTCGTTCATT-13  0.0318152       NK cell
ctrl_13_CAACCAATCATCTATC-13  0.0394666    CD8 T cell
ctrl_13_TACGGTATCGGATTAC-13  0.0743317    CD8 T cell
ctrl_13_AATAGAGAGTTCGGTT-13  0.0377684    CD4 T cell

Compare results:

ctrl$singler.immune = singler.immune$pruned.labels
ctrl$singler.hpca = singler.hpca$pruned.labels
ctrl$singler.ref = singler.ref$pruned.labels

DimPlot(ctrl, group.by = c("singler.hpca", "singler.immune", "singler.ref"), ncol = 2)

5 Azimuth

There are multiple online resources with large curated datasets with methods to integrate and do label transfer. One such resource is Azimuth another one is Disco.

Here we will use the PBMC reference provided with Azimuth. Which in principle runs label transfer of your dataset onto a large curated reference. The first time you run the command, the pbmcref dataset will be downloaded to your local computer.

options(future.globals.maxSize = 1e9)

# will install the pbmcref dataset first time you run it.
ctrl <- RunAzimuth(ctrl, reference = "pbmcref")

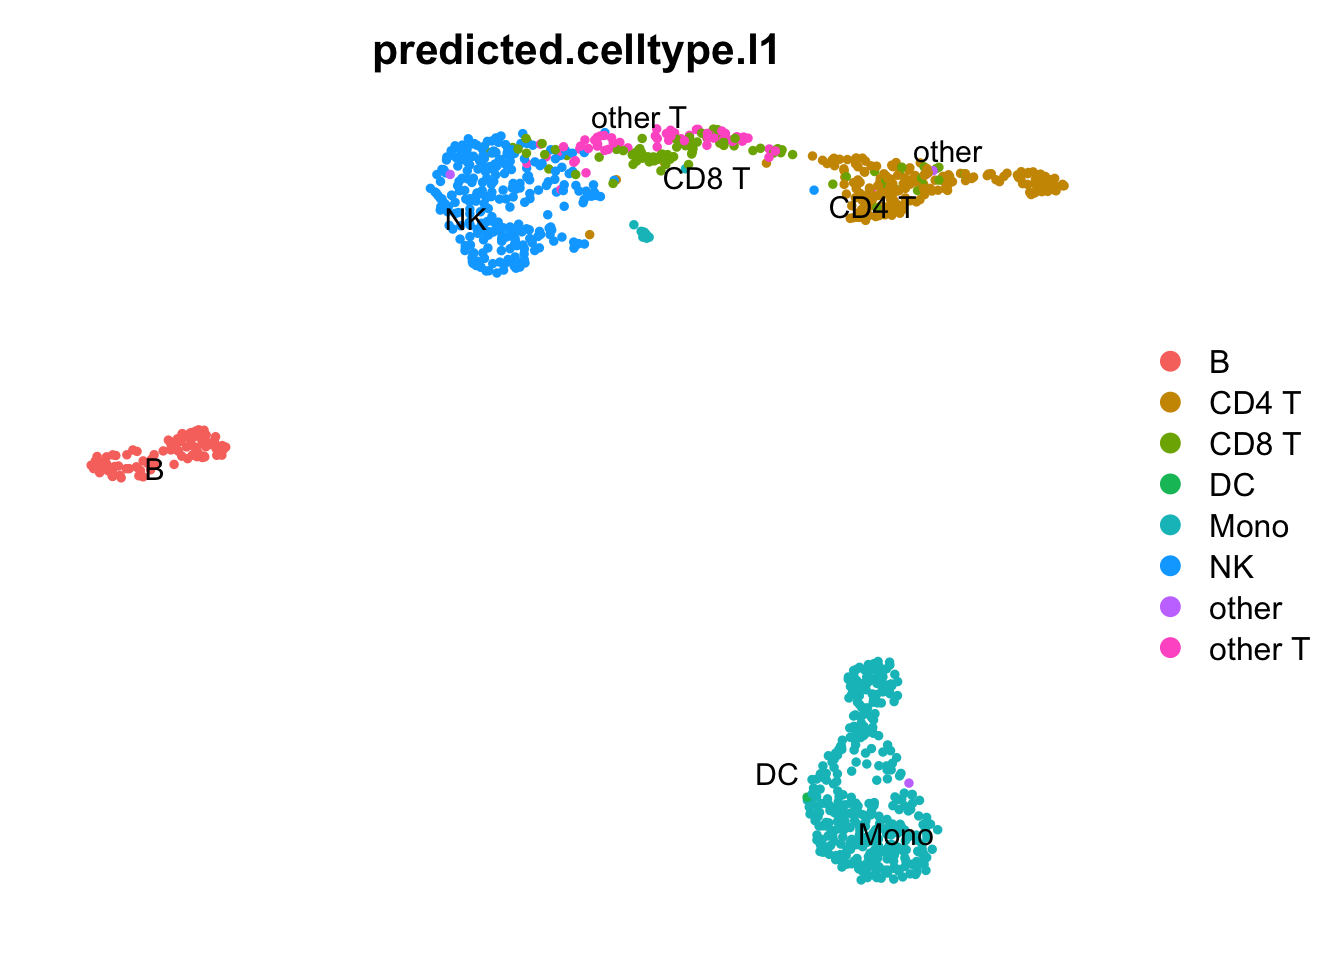
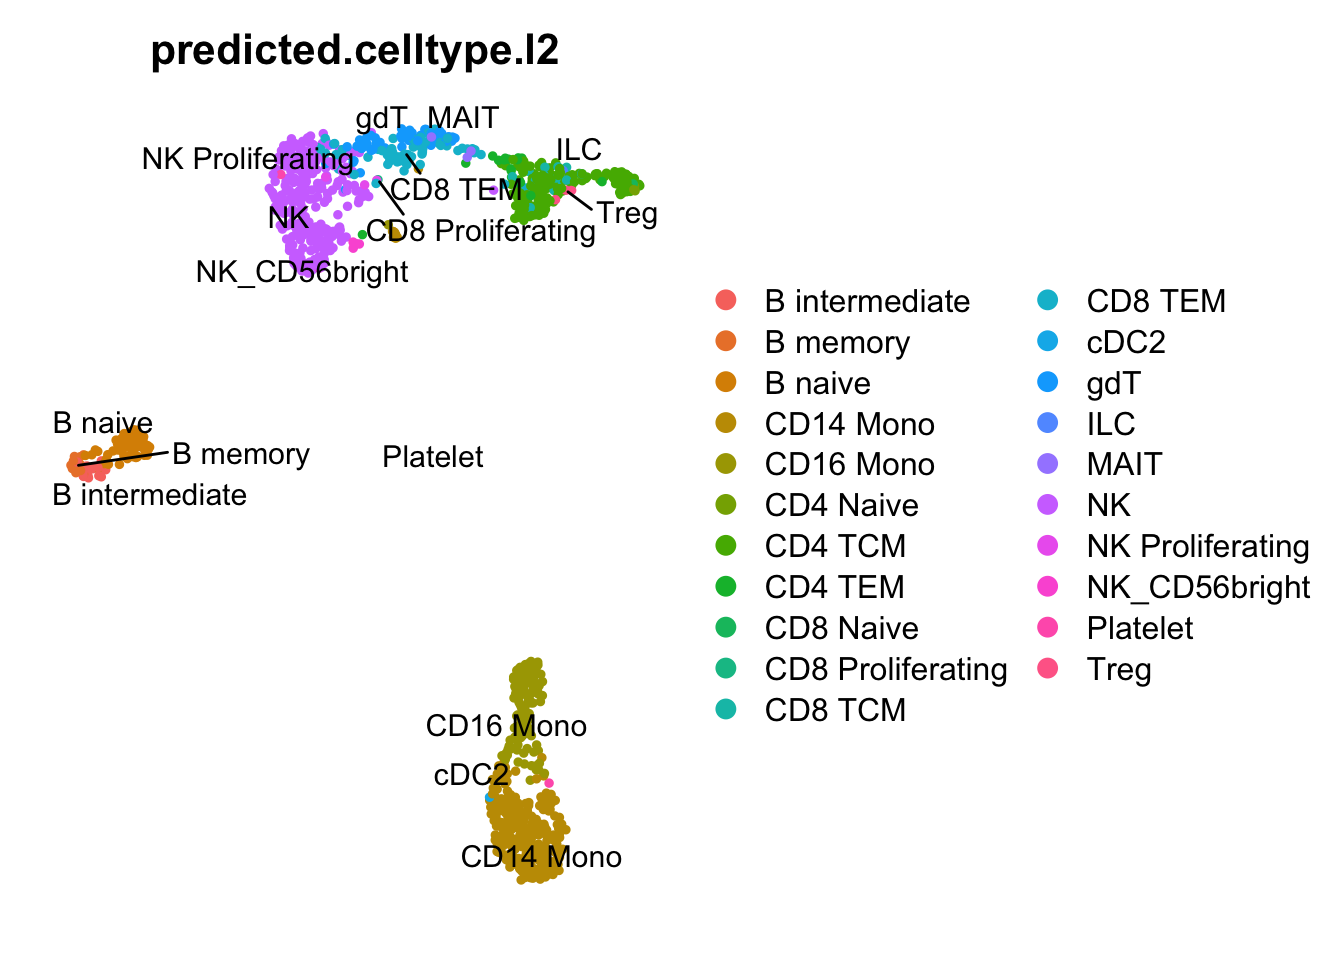
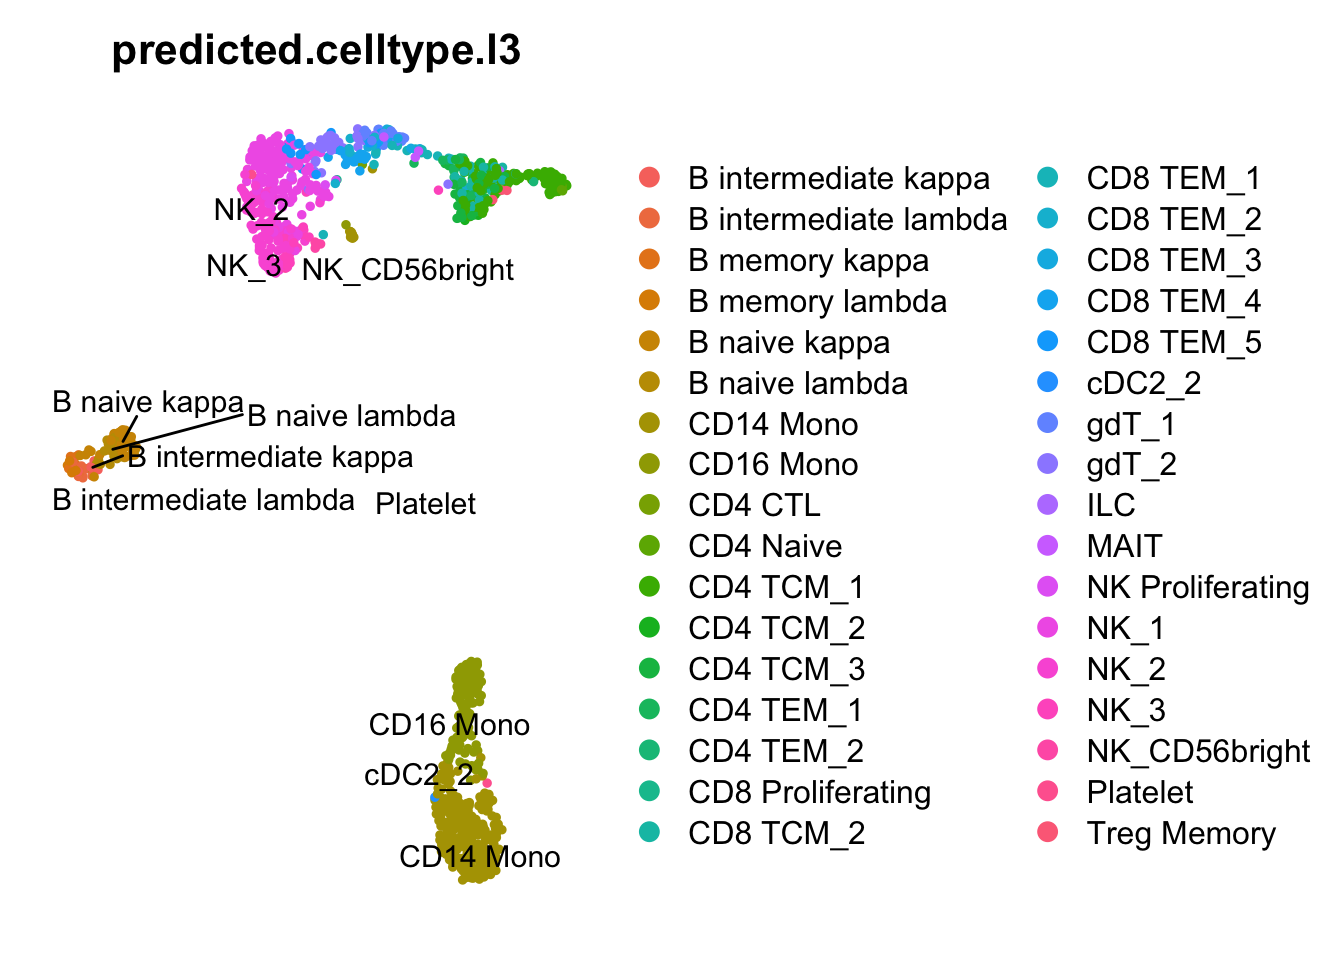
This dataset has predictions at 3 different levels of annotation wiht l1 being the more broad celltypes and l3 more detailed annotation.

DimPlot(ctrl, group.by = "predicted.celltype.l1", label = T, repel = T) + NoAxes()

DimPlot(ctrl, group.by = "predicted.celltype.l2", label = T, repel = T) + NoAxes()

DimPlot(ctrl, group.by = "predicted.celltype.l3", label = T, repel = T) + NoAxes()

6 Compare results

Now we will compare the output of the two methods using the convenient function in scPred crossTab() that prints the overlap between two metadata slots.

crossTab(ctrl, "predicted.id", "singler.hpca")

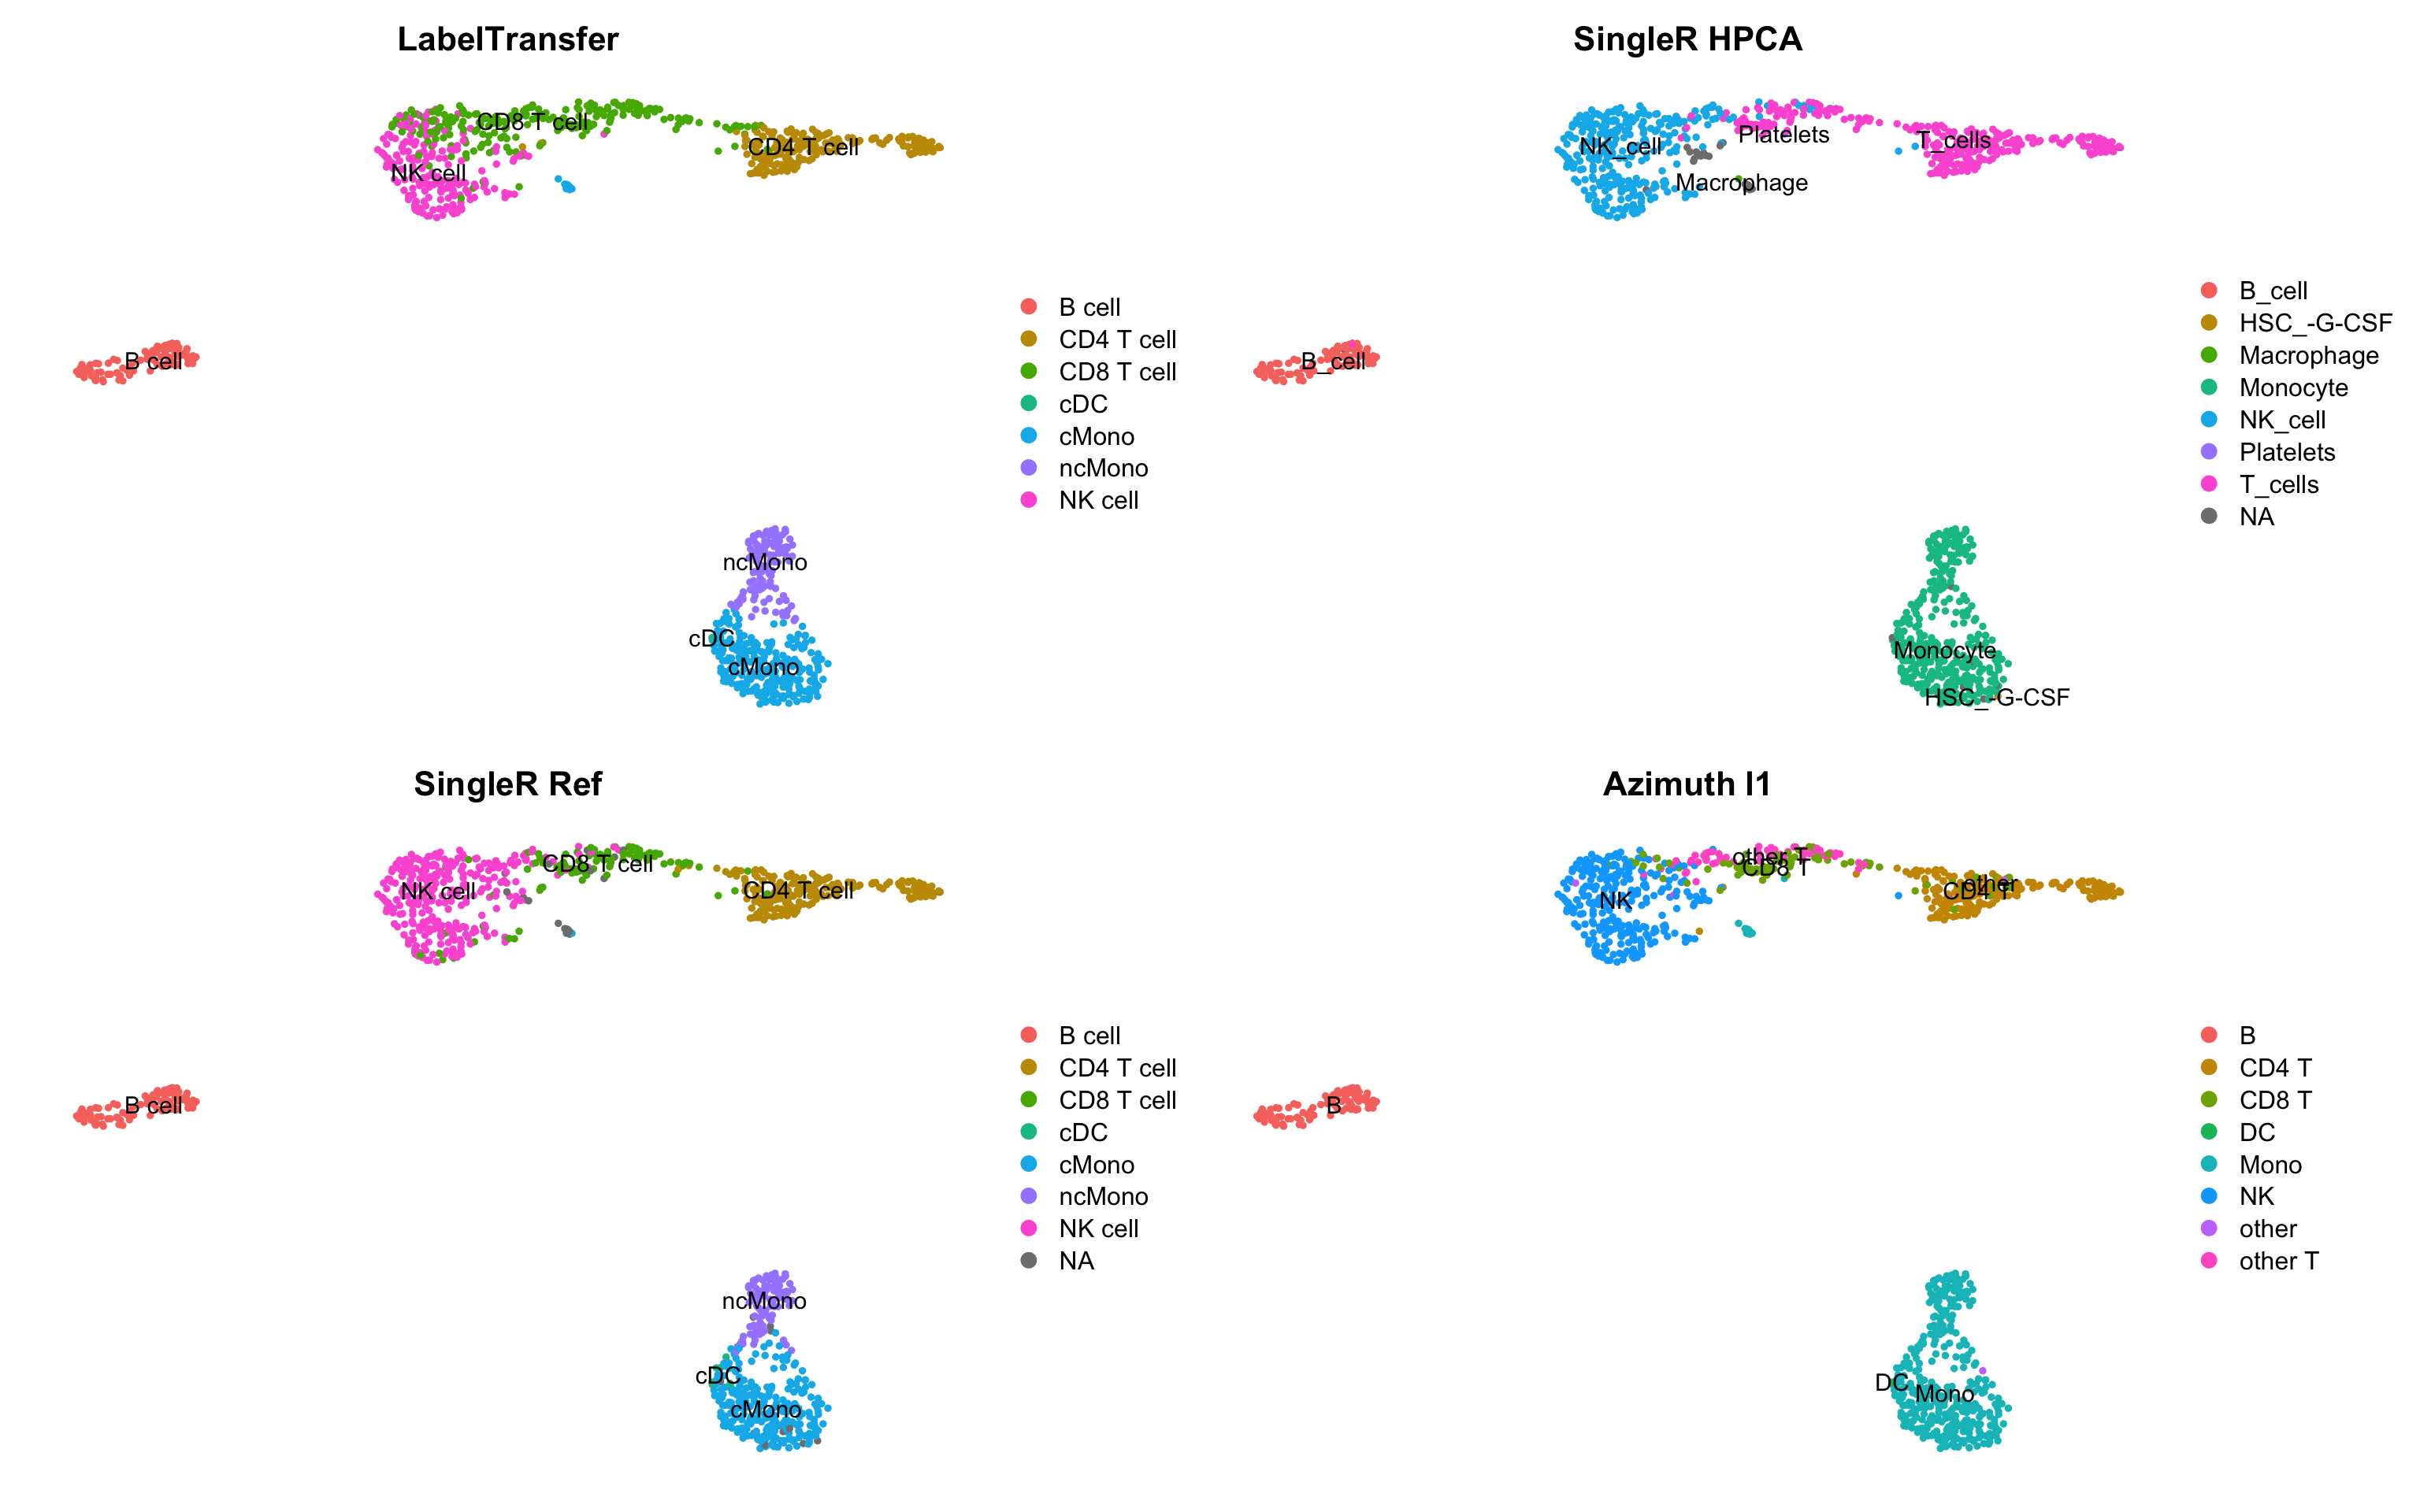
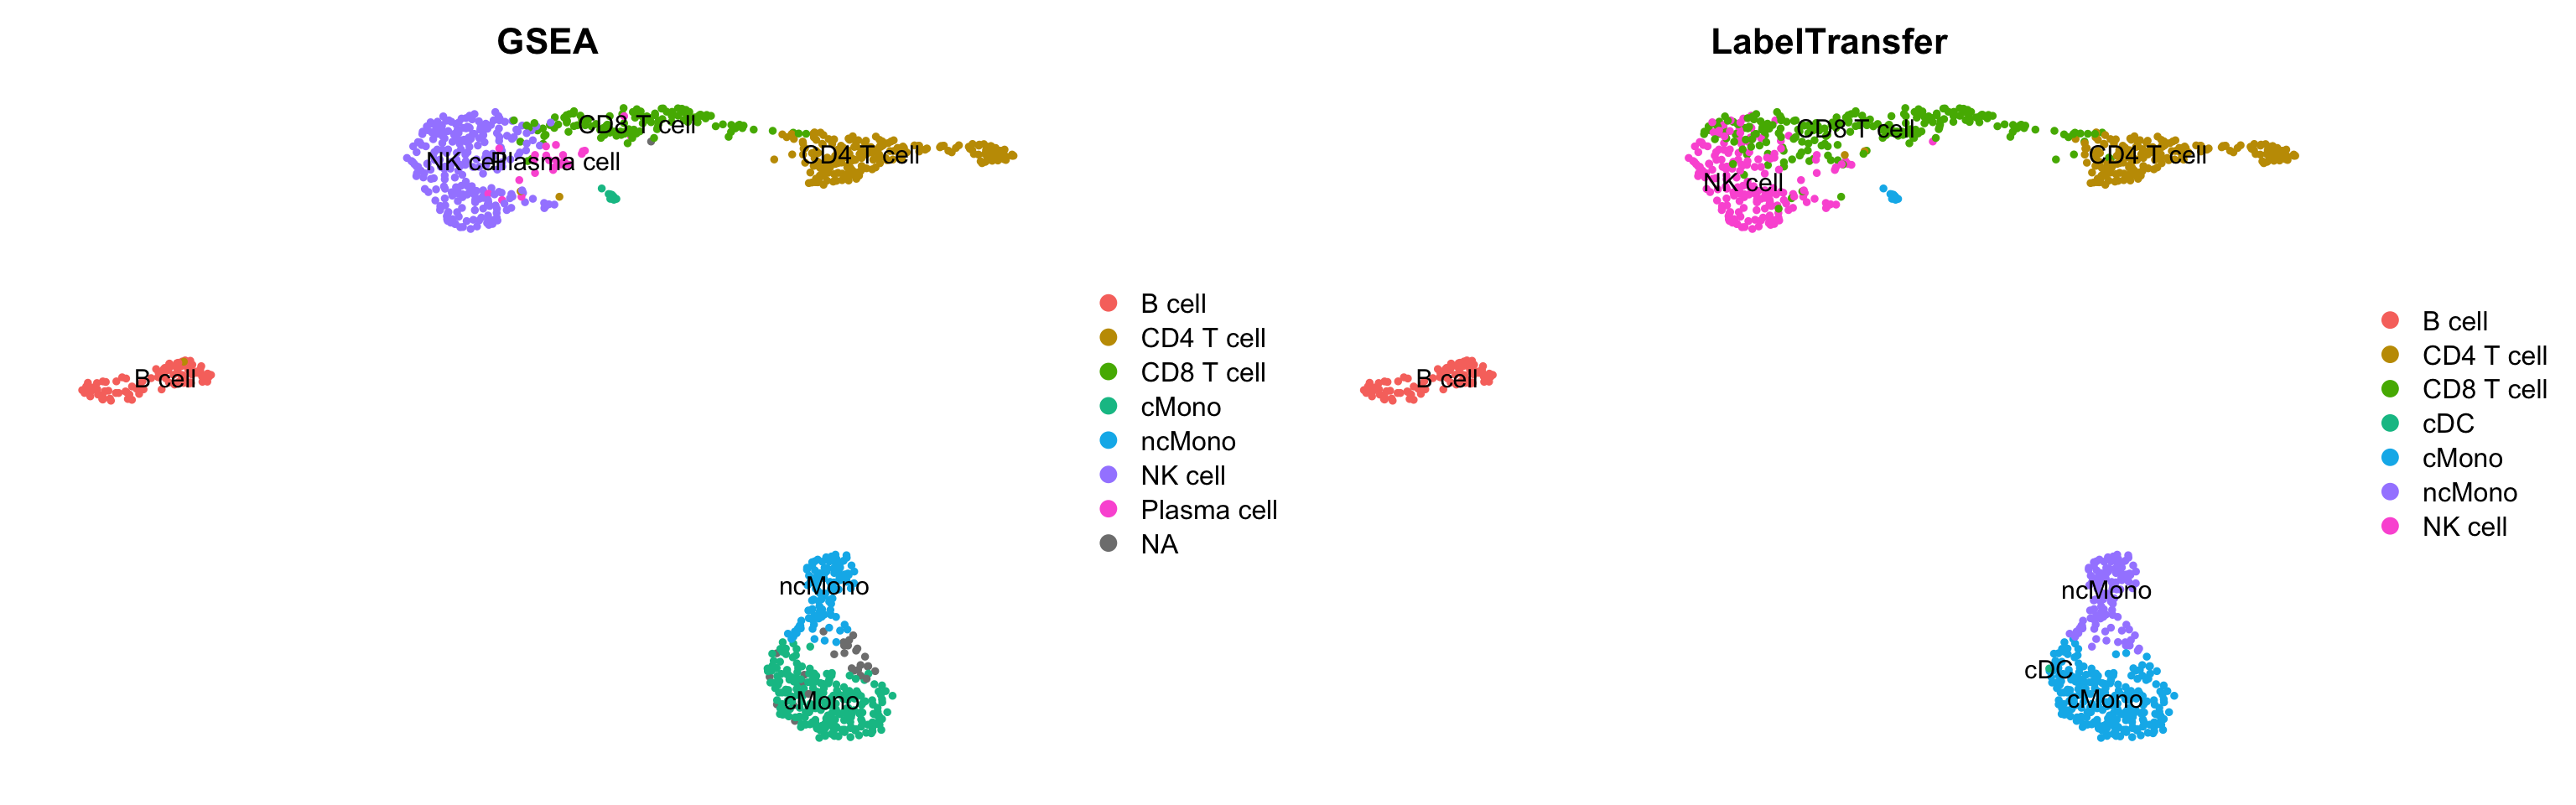
We can also plot all the different predictions side by side

wrap_plots(
    DimPlot(ctrl, label = T, group.by = "predicted.id") + NoAxes() + ggtitle("LabelTransfer"),
    DimPlot(ctrl, label = T, group.by = "singler.hpca") + NoAxes() + ggtitle("SingleR HPCA"),
    DimPlot(ctrl, label = T, group.by = "singler.ref") + NoAxes() + ggtitle("SingleR HPCA"),
    DimPlot(ctrl, label = T, group.by = "predicted.celltype.l1") + NoAxes() + ggtitle("Azimuth l1"),
    ncol = 2
)

7 GSEA with celltype markers

Another option, where celltype can be classified on cluster level is to use gene set enrichment among the DEGs with known markers for different celltypes. Similar to how we did functional enrichment for the DEGs in the differential expression exercise. There are some resources for celltype gene sets that can be used. Such as CellMarker, PanglaoDB or celltype gene sets at MSigDB. We can also look at overlap between DEGs in a reference dataset and the dataset you are analyzing.

7.1 DEG overlap

First, lets extract top DEGs for our Covid-19 dataset and the reference dataset. When we run differential expression for our dataset, we want to report as many genes as possible, hence we set the cutoffs quite lenient.

# run differential expression in our dataset, using clustering at resolution 0.5
# first we need to join the layers
alldata@active.assay = "RNA"
alldata <- JoinLayers(object = alldata, layers = c("data","counts"))

# set the clustering you want to use as the identity class.
alldata <- SetIdent(alldata, value = "RNA_snn_res.0.5")
DGE_table <- FindAllMarkers(
    alldata,
    logfc.threshold = 0,
    test.use = "wilcox",
    min.pct = 0.1,
    min.diff.pct = 0,
    only.pos = TRUE,
    max.cells.per.ident = 100,
    return.thresh = 1,
    assay = "RNA"
)

# split into a list
DGE_list <- split(DGE_table, DGE_table$cluster)

unlist(lapply(DGE_list, nrow))
   0    1    2    3    4    5    6    7    8    9 
3265 4287 3420 2600 2165 3536 2630 2439 2393 3910 
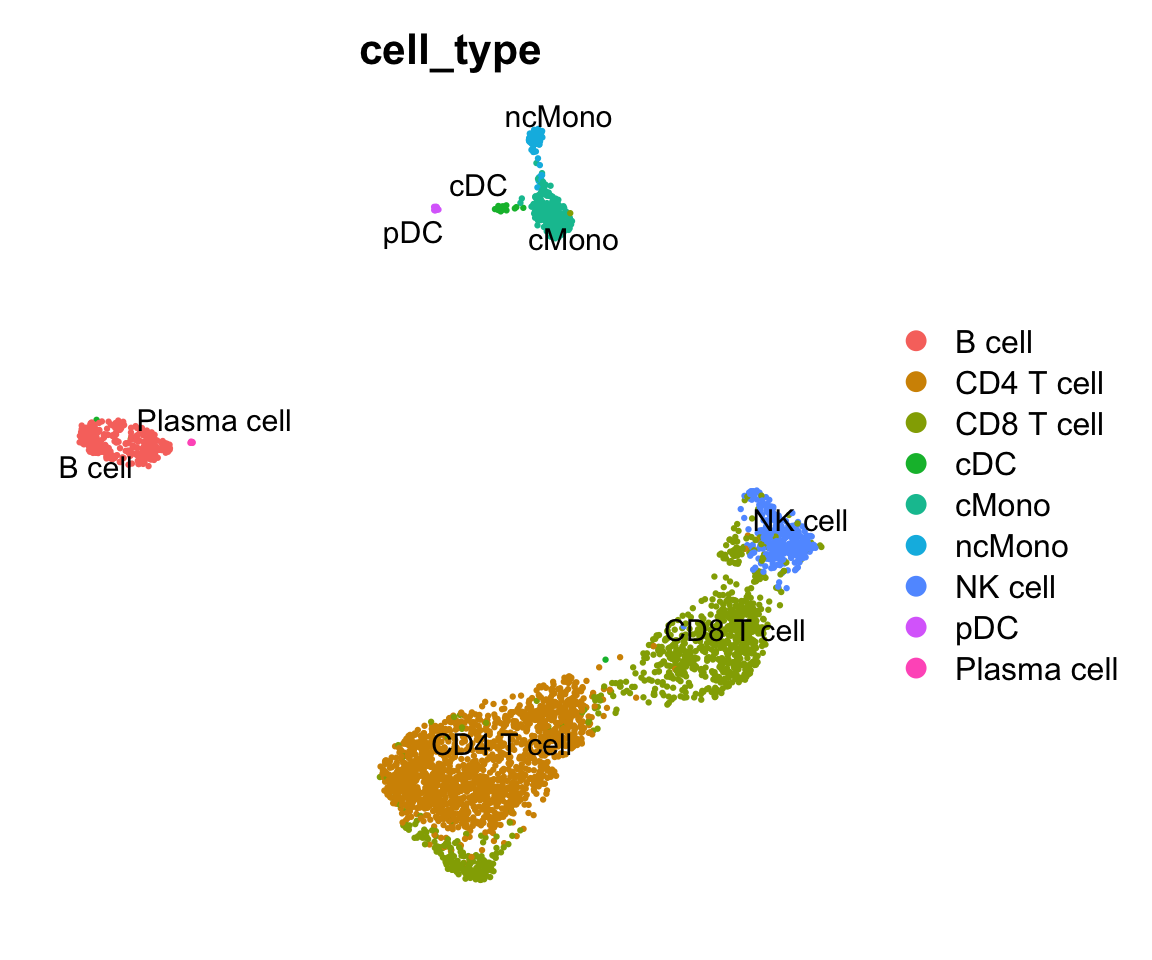
# Compute differential gene expression in reference dataset (that has cell annotation)
reference <- SetIdent(reference, value = "cell_type")
reference_markers <- FindAllMarkers(
    reference,
    min.pct = .1,
    min.diff.pct = .2,
    only.pos = T,
    max.cells.per.ident = 20,
    return.thresh = 1
)

# Identify the top cell marker genes in reference dataset
# select top 50 with hihgest foldchange among top 100 signifcant genes.
reference_markers <- reference_markers[order(reference_markers$avg_log2FC, decreasing = T), ]
reference_markers %>%
    group_by(cluster) %>%
    top_n(-100, p_val) %>%
    top_n(50, avg_log2FC) -> top50_cell_selection

# Transform the markers into a list
ref_list <- split(top50_cell_selection$gene, top50_cell_selection$cluster)

unlist(lapply(ref_list, length))
 CD8 T cell  CD4 T cell       cMono      B cell     NK cell         pDC 
         30          15          50          50          50          50 
     ncMono         cDC Plasma cell 
         50          50          50 

Now we can run GSEA for the DEGs from our dataset and check for enrichment of top DEGs in the reference dataset.

suppressPackageStartupMessages(library(fgsea))

# run fgsea for each of the clusters in the list
res <- lapply(DGE_list, function(x) {
    gene_rank <- setNames(x$avg_log2FC, x$gene)
    fgseaRes <- fgsea(pathways = ref_list, stats = gene_rank, nperm = 10000)
    return(fgseaRes)
})
names(res) <- names(DGE_list)

# You can filter and resort the table based on ES, NES or pvalue
res <- lapply(res, function(x) {
    x[x$pval < 0.1, ]
})
res <- lapply(res, function(x) {
    x[x$size > 2, ]
})
res <- lapply(res, function(x) {
    x[order(x$NES, decreasing = T), ]
})
res
$`0`
   pathway        pval       padj        ES      NES nMoreExtreme  size
    <char>       <num>      <num>     <num>    <num>        <num> <int>
1:   cMono 0.000099990 0.00029997 0.8657747 2.035407            0    48
2:     cDC 0.000099990 0.00029997 0.7099219 1.647726            0    39
3:  ncMono 0.000099990 0.00029997 0.6642744 1.555884            0    45
4:     pDC 0.009423559 0.02120301 0.6451232 1.431353           93    22
    leadingEdge
         <list>
1: S100A12,....
2: LYZ, LGA....
3: SLC11A1,....
4: MS4A6A, ....

$`1`
       pathway         pval        padj        ES      NES nMoreExtreme  size
        <char>        <num>       <num>     <num>    <num>        <num> <int>
1:     NK cell 0.0001000000 0.000451898 0.9156134 2.529660            0    47
2:  CD8 T cell 0.0001004218 0.000451898 0.8551651 2.216793            0    25
3: Plasma cell 0.0032248312 0.009674494 0.6445657 1.647584           31    22
4:      ncMono 0.0128590314 0.028932821 0.8221468 1.597839          106     5
5:         pDC 0.0624924889 0.112486480 0.7425491 1.443141          519     5
    leadingEdge
         <list>
1: KLRF1, A....
2: PRF1, GZ....
3: CD38, SL....
4: FCGR3A, RHOC
5: C12orf75....

$`2`
       pathway         pval         padj        ES      NES nMoreExtreme  size
        <char>        <num>        <num>     <num>    <num>        <num> <int>
1:  CD8 T cell 0.0001001603 0.0006009615 0.8625656 2.159745            0    29
2:  CD4 T cell 0.0027783952 0.0055567904 0.8295096 1.684067           24     7
3:     NK cell 0.0004005207 0.0012015620 0.6560595 1.652107            3    31
4:         pDC 0.0039970022 0.0059955034 0.9035340 1.618793           31     4
5: Plasma cell 0.0350292752 0.0350292752 0.5965408 1.428551          346    19
    leadingEdge
         <list>
1: CD8B, CD....
2: CD3D, CD....
3: XCL2, CC....
4: PTMS, C1....
5: FKBP11, ....

$`3`
       pathway        pval         padj        ES      NES nMoreExtreme  size
        <char>       <num>        <num>     <num>    <num>        <num> <int>
1:      B cell 0.000099990 0.0004534919 0.8699471 1.995861            0    46
2:         pDC 0.000100776 0.0004534919 0.7920478 1.704256            0    19
3: Plasma cell 0.003393425 0.0076352068 0.8304795 1.630014           31     9
4:         cDC 0.002737504 0.0076352068 0.7559164 1.597116           26    16
    leadingEdge
         <list>
1: TCL1A, F....
2: TSPAN13,....
3: PLPP5, D....
4: ADAM28, ....

$`4`
      pathway         pval         padj        ES      NES nMoreExtreme  size
       <char>        <num>        <num>     <num>    <num>        <num> <int>
1: CD4 T cell 0.0001018641 0.0005093206 0.8823680 1.854275            0    14
2: CD8 T cell 0.0007517182 0.0018792955 0.8681207 1.687616            6     8
    leadingEdge
         <list>
1: MAL, IL7....
2: CD3D, CD....

$`5`
   pathway       pval         padj        ES      NES nMoreExtreme  size
    <char>      <num>        <num>     <num>    <num>        <num> <int>
1:  ncMono 0.00009999 0.0004002802 0.8545233 2.043101            0    49
2:   cMono 0.00010007 0.0004002802 0.7209933 1.675090            0    32
3:     cDC 0.00480144 0.0128038412 0.6225434 1.460984           47    37
4: NK cell 0.04207363 0.0841472577 0.7342381 1.451788          391     8
    leadingEdge
         <list>
1: CDKN1C, ....
2: AIF1, SE....
3: LST1, CO....
4: FCGR3A, ....

$`6`
       pathway         pval         padj        ES      NES nMoreExtreme  size
        <char>        <num>        <num>     <num>    <num>        <num> <int>
1:      B cell 0.0000999900 0.0007999200 0.8344032 1.848025            0    46
2:         pDC 0.0002017349 0.0008054772 0.8370006 1.729132            1    17
3: Plasma cell 0.0004027386 0.0008054772 0.8094681 1.680445            3    18
4:         cDC 0.0004027386 0.0008054772 0.7944045 1.649173            3    18
    leadingEdge
         <list>
1: LINC0178....
2: SPIB, JC....
3: TNFRSF13....
4: ADAM28, ....

$`7`
      pathway        pval         padj       ES      NES nMoreExtreme  size
       <char>       <num>        <num>    <num>    <num>        <num> <int>
1: CD4 T cell 0.000102417 0.0006145023 0.828097 1.893825            0    14
    leadingEdge
         <list>
1: TSHZ2, L....

$`8`
Empty data.table (0 rows and 8 cols): pathway,pval,padj,ES,NES,nMoreExtreme...

$`9`
       pathway         pval        padj        ES      NES nMoreExtreme  size
        <char>        <num>       <num>     <num>    <num>        <num> <int>
1: Plasma cell 0.0002005817 0.001604653 0.7249438 1.832438            1    27
2:         pDC 0.0060943575 0.024377430 0.7418881 1.665241           57    11
    leadingEdge
         <list>
1: JCHAIN, ....
2: MYBL2, J....

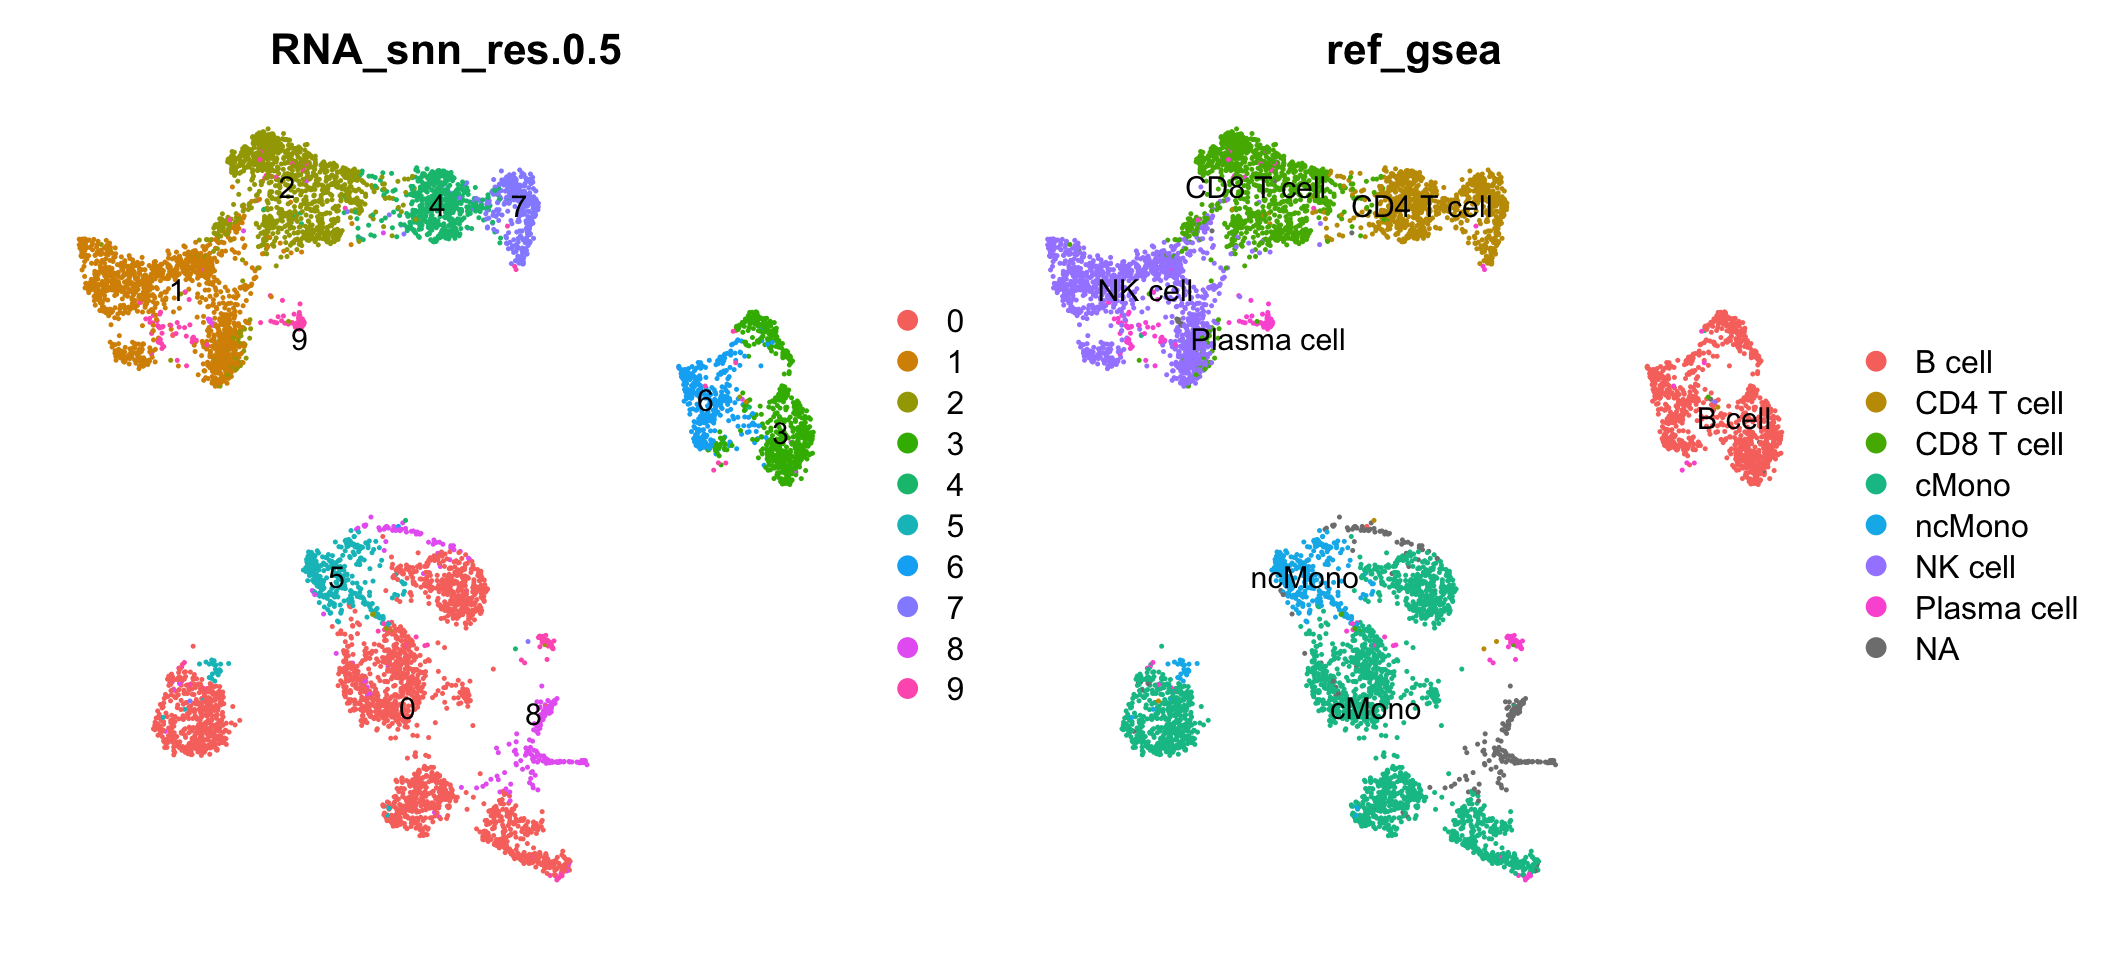
Selecting top significant overlap per cluster, we can now rename the clusters according to the predicted labels. OBS! Be aware that if you have some clusters that have non-significant p-values for all the gene sets, the cluster label will not be very reliable. Also, the gene sets you are using may not cover all the celltypes you have in your dataset and hence predictions may just be the most similar celltype. Also, some of the clusters have very similar p-values to multiple celltypes, for instance the ncMono and cMono celltypes are equally good for some clusters.

new.cluster.ids <- unlist(lapply(res, function(x) {
    as.data.frame(x)[1, 1]
}))

annot = new.cluster.ids[as.character(alldata@active.ident)]
names(annot) = colnames(alldata)
alldata$ref_gsea <- annot

wrap_plots(
    DimPlot(alldata, label = T, group.by = "RNA_snn_res.0.5") + NoAxes(),
    DimPlot(alldata, label = T, group.by = "ref_gsea") + NoAxes(),
    ncol = 2
)

Compare the results with the other celltype prediction methods in the ctrl_13 sample.

ctrl$ref_gsea <- alldata$ref_gsea[alldata$orig.ident == "ctrl_13"]

wrap_plots(
    DimPlot(ctrl, label = T, group.by = "ref_gsea") + NoAxes() + ggtitle("GSEA"),
    DimPlot(ctrl, label = T, group.by = "predicted.id") + NoAxes() + ggtitle("LabelTransfer"),
    ncol = 2
)

7.2 With annotated gene sets

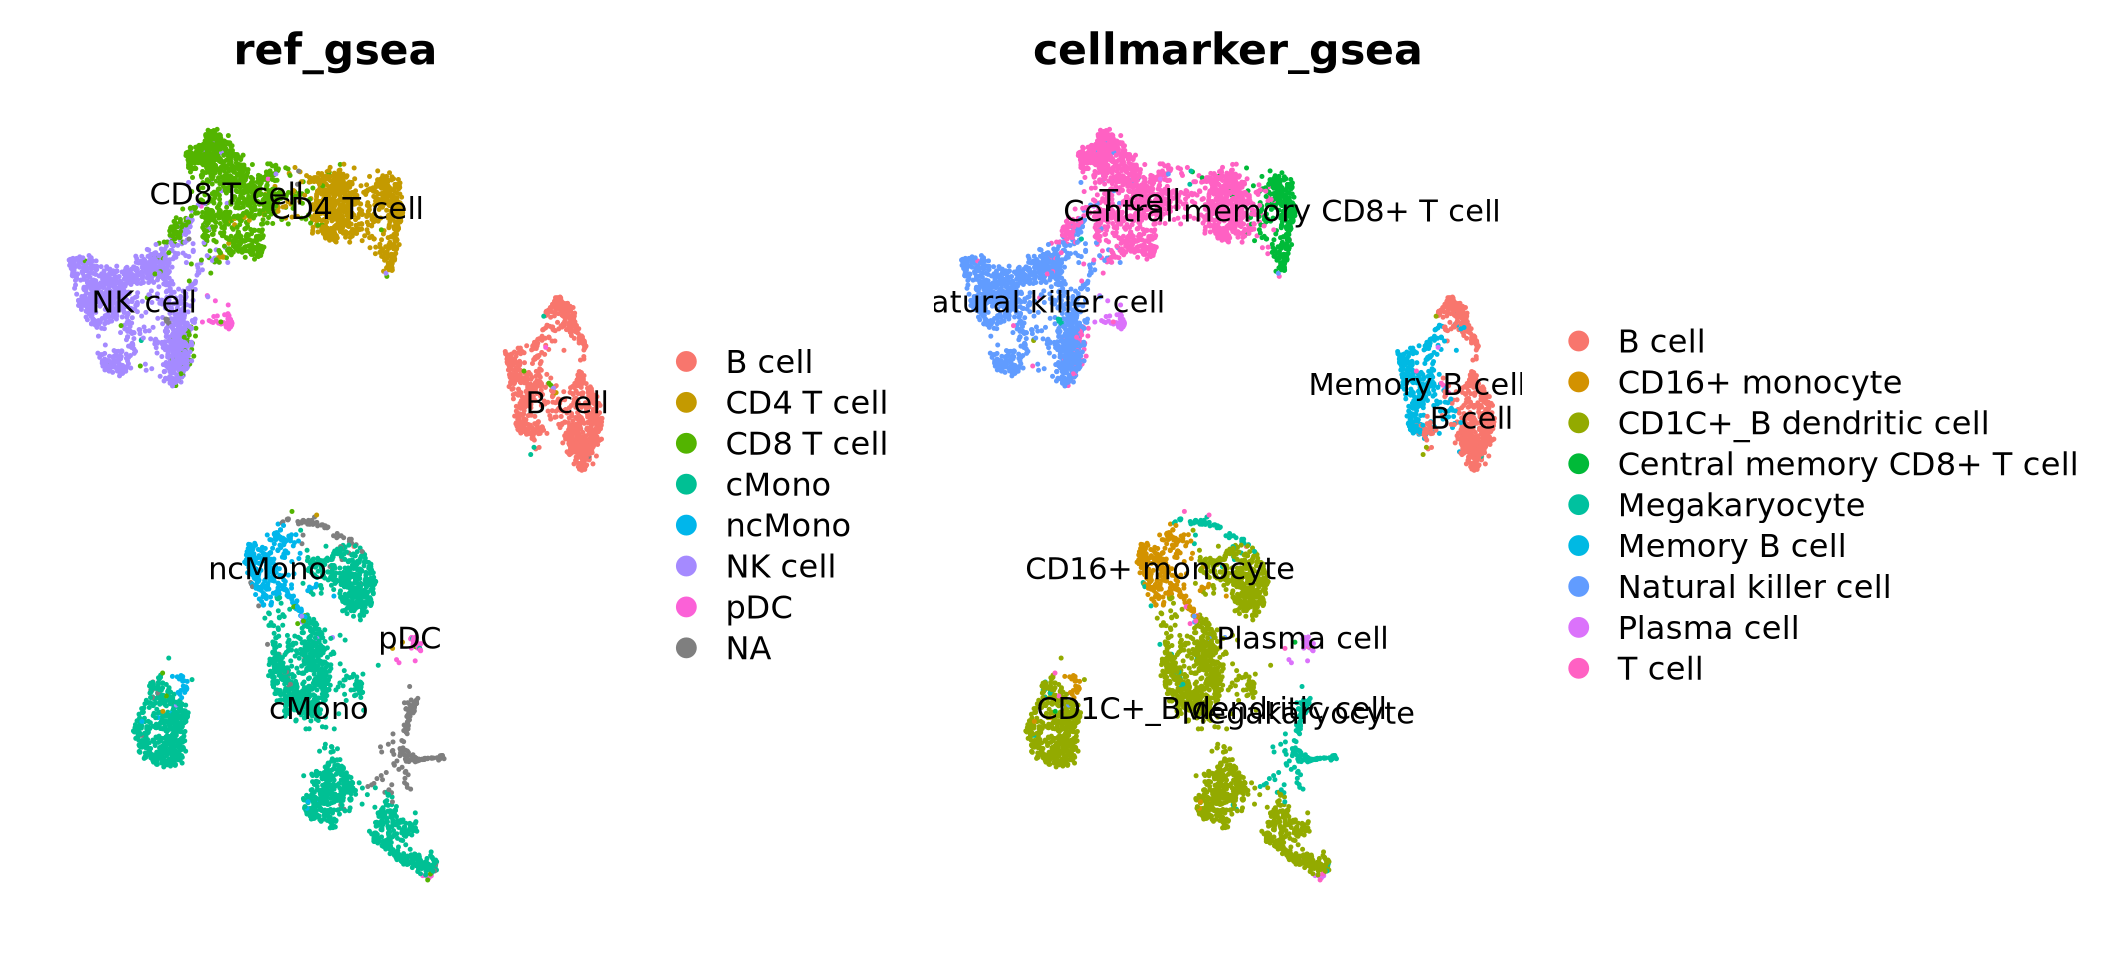
We have downloaded the celltype gene lists from http://bio-bigdata.hrbmu.edu.cn/CellMarker/CellMarker_download.html and converted the excel file to a csv for you. Read in the gene lists and do some filtering.

path_file <- file.path("data/cell_marker_human.csv")
if (!file.exists(path_file)) download.file(file.path(path_data, "cell_marker_human.csv"), destfile = path_file)
# Load the human marker table
markers <- read.delim("data/cell_marker_human.csv", sep = ";")
markers <- markers[markers$species == "Human", ]
markers <- markers[markers$cancer_type == "Normal", ]

# Filter by tissue (to reduce computational time and have tissue-specific classification)
sort(unique(markers$tissue_type))
  [1] "Abdomen"                        "Abdominal adipose tissue"      
  [3] "Abdominal fat pad"              "Acinus"                        
  [5] "Adipose tissue"                 "Adrenal gland"                 
  [7] "Adventitia"                     "Airway"                        
  [9] "Airway epithelium"              "Allocortex"                    
 [11] "Alveolus"                       "Amniotic fluid"                
 [13] "Amniotic membrane"              "Ampullary"                     
 [15] "Anogenital tract"               "Antecubital vein"              
 [17] "Anterior cruciate ligament"     "Anterior presomitic mesoderm"  
 [19] "Aorta"                          "Aortic valve"                  
 [21] "Artery"                         "Arthrosis"                     
 [23] "Articular Cartilage"            "Ascites"                       
 [25] "Atrium"                         "Auditory cortex"               
 [27] "Basilar membrane"               "Beige Fat"                     
 [29] "Bile duct"                      "Biliary tract"                 
 [31] "Bladder"                        "Blood"                         
 [33] "Blood vessel"                   "Bone"                          
 [35] "Bone marrow"                    "Brain"                         
 [37] "Breast"                         "Bronchial vessel"              
 [39] "Bronchiole"                     "Bronchoalveolar lavage"        
 [41] "Bronchoalveolar system"         "Bronchus"                      
 [43] "Brown adipose tissue"           "Calvaria"                      
 [45] "Capillary"                      "Cardiac atrium"                
 [47] "Cardiovascular system"          "Carotid artery"                
 [49] "Carotid plaque"                 "Cartilage"                     
 [51] "Caudal cortex"                  "Caudal forebrain"              
 [53] "Caudal ganglionic eminence"     "Cavernosum"                    
 [55] "Central amygdala"               "Central nervous system"        
 [57] "Central Nervous System"         "Cerebellum"                    
 [59] "Cerebral organoid"              "Cerebrospinal fluid"           
 [61] "Choriocapillaris"               "Chorionic villi"               
 [63] "Chorionic villus"               "Choroid"                       
 [65] "Choroid plexus"                 "Colon"                         
 [67] "Colon epithelium"               "Colorectum"                    
 [69] "Cornea"                         "Corneal endothelium"           
 [71] "Corneal epithelium"             "Coronary artery"               
 [73] "Corpus callosum"                "Corpus luteum"                 
 [75] "Cortex"                         "Cortical layer"                
 [77] "Cortical thymus"                "Decidua"                       
 [79] "Deciduous tooth"                "Dental pulp"                   
 [81] "Dermis"                         "Diencephalon"                  
 [83] "Distal airway"                  "Dorsal forebrain"              
 [85] "Dorsal root ganglion"           "Dorsolateral prefrontal cortex"
 [87] "Ductal tissue"                  "Duodenum"                      
 [89] "Ectocervix"                     "Ectoderm"                      
 [91] "Embryo"                         "Embryoid body"                 
 [93] "Embryonic brain"                "Embryonic heart"               
 [95] "Embryonic Kidney"               "Embryonic prefrontal cortex"   
 [97] "Embryonic stem cell"            "Endocardium"                   
 [99] "Endocrine"                      "Endoderm"                      
[101] "Endometrium"                    "Endometrium stroma"            
[103] "Entorhinal cortex"              "Epidermis"                     
[105] "Epithelium"                     "Esophagus"                     
[107] "Eye"                            "Fat pad"                       
[109] "Fetal brain"                    "Fetal gonad"                   
[111] "Fetal heart"                    "Fetal ileums"                  
[113] "Fetal kidney"                   "Fetal Leydig"                  
[115] "Fetal liver"                    "Fetal lung"                    
[117] "Fetal pancreas"                 "Fetal thymus"                  
[119] "Fetal umbilical cord"           "Fetus"                         
[121] "Foreskin"                       "Frontal cortex"                
[123] "Fundic gland"                   "Gall bladder"                  
[125] "Gastric corpus"                 "Gastric epithelium"            
[127] "Gastric gland"                  "Gastrointestinal tract"        
[129] "Germ"                           "Gingiva"                       
[131] "Gonad"                          "Gut"                           
[133] "Hair follicle"                  "Heart"                         
[135] "Heart muscle"                   "Hippocampus"                   
[137] "Ileum"                          "Inferior colliculus"           
[139] "Interfollicular epidermis"      "Intervertebral disc"           
[141] "Intestinal crypt"               "Intestine"                     
[143] "Intrahepatic cholangio"         "Jejunum"                       
[145] "Kidney"                         "Lacrimal gland"                
[147] "Large intestine"                "Laryngeal squamous epithelium" 
[149] "Lateral ganglionic eminence"    "Ligament"                      
[151] "Limb bud"                       "Limbal epithelium"             
[153] "Liver"                          "Lumbar vertebra"               
[155] "Lung"                           "Lymph"                         
[157] "Lymph node"                     "Lymphatic vessel"              
[159] "Lymphoid tissue"                "Malignant pleural effusion"    
[161] "Mammary epithelium"             "Mammary gland"                 
[163] "Medial ganglionic eminence"     "Medullary thymus"              
[165] "Meniscus"                       "Mesoblast"                     
[167] "Mesoderm"                       "Microvascular endothelium"     
[169] "Microvessel"                    "Midbrain"                      
[171] "Middle temporal gyrus"          "Milk"                          
[173] "Molar"                          "Muscle"                        
[175] "Myenteric plexus"               "Myocardium"                    
[177] "Myometrium"                     "Nasal concha"                  
[179] "Nasal epithelium"               "Nasal mucosa"                  
[181] "Nasal polyp"                    "Neocortex"                     
[183] "Nerve"                          "Nose"                          
[185] "Nucleus pulposus"               "Olfactory neuroepithelium"     
[187] "Optic nerve"                    "Oral cavity"                   
[189] "Oral mucosa"                    "Osteoarthritic cartilage"      
[191] "Ovarian cortex"                 "Ovarian follicle"              
[193] "Ovary"                          "Oviduct"                       
[195] "Pancreas"                       "Pancreatic acinar tissue"      
[197] "Pancreatic duct"                "Pancreatic islet"              
[199] "Periodontal ligament"           "Periodontium"                  
[201] "Periosteum"                     "Peripheral blood"              
[203] "Peritoneal fluid"               "Peritoneum"                    
[205] "Pituitary"                      "Placenta"                      
[207] "Plasma"                         "Pluripotent stem cell"         
[209] "Polyp"                          "Posterior presomitic mesoderm" 
[211] "Prefrontal cortex"              "Premolar"                      
[213] "Presomitic mesoderm"            "Primitive streak"              
[215] "Prostate"                       "Pulmonary arteriy"             
[217] "Pyloric gland"                  "Rectum"                        
[219] "Renal glomerulus"               "Respiratory tract"             
[221] "Retina"                         "Retinal organoid"              
[223] "Retinal pigment epithelium"     "Right ventricle"               
[225] "Saliva"                         "Salivary gland"                
[227] "Scalp"                          "Sclerocorneal tissue"          
[229] "Seminal plasma"                 "Septum transversum"            
[231] "Serum"                          "Sinonasal mucosa"              
[233] "Sinus tissue"                   "Skeletal muscle"               
[235] "Skin"                           "Small intestinal crypt"        
[237] "Small intestine"                "Soft tissue"                   
[239] "Sperm"                          "Spinal cord"                   
[241] "Spleen"                         "Splenic red pulp"              
[243] "Sputum"                         "Stomach"                       
[245] "Subcutaneous adipose tissue"    "Submandibular gland"           
[247] "Subpallium"                     "Subplate"                      
[249] "Subventricular zone"            "Superior frontal gyrus"        
[251] "Sympathetic ganglion"           "Synovial fluid"                
[253] "Synovium"                       "Taste bud"                     
[255] "Tendon"                         "Testis"                        
[257] "Thalamus"                       "Thymus"                        
[259] "Thyroid"                        "Tonsil"                        
[261] "Tooth"                          "Trachea"                       
[263] "Tracheal airway epithelium"     "Transformed artery"            
[265] "Trophoblast"                    "Umbilical cord"                
[267] "Umbilical cord blood"           "Umbilical vein"                
[269] "Undefined"                      "Urine"                         
[271] "Urothelium"                     "Uterine cervix"                
[273] "Uterus"                         "Vagina"                        
[275] "Vein"                           "Venous blood"                  
[277] "Ventral thalamus"               "Ventricle"                     
[279] "Ventricular and atrial"         "Ventricular zone"              
[281] "Visceral adipose tissue"        "Vocal fold"                    
[283] "Whartons jelly"                 "White adipose tissue"          
[285] "White matter"                   "Yolk sac"                      
grep("blood", unique(markers$tissue_type), value = T)
[1] "Peripheral blood"     "Umbilical cord blood" "Venous blood"        
markers <- markers[markers$tissue_type %in% c(
    "Blood", "Venous blood",
    "Serum", "Plasma",
    "Spleen", "Bone marrow", "Lymph node"
), ]

# remove strange characters etc.
celltype_list <- lapply(unique(markers$cell_name), function(x) {
    x <- paste(markers$Symbol[markers$cell_name == x], sep = ",")
    x <- gsub("[[]|[]]| |-", ",", x)
    x <- unlist(strsplit(x, split = ","))
    x <- unique(x[!x %in% c("", "NA", "family")])
    x <- casefold(x, upper = T)
})
names(celltype_list) <- unique(markers$cell_name)

celltype_list <- celltype_list[unlist(lapply(celltype_list, length)) < 100]
celltype_list <- celltype_list[unlist(lapply(celltype_list, length)) > 5]
# run fgsea for each of the clusters in the list
res <- lapply(DGE_list, function(x) {
    gene_rank <- setNames(x$avg_log2FC, x$gene)
    fgseaRes <- fgsea(pathways = celltype_list, stats = gene_rank, nperm = 10000, scoreType = "pos")
    return(fgseaRes)
})
names(res) <- names(DGE_list)

# You can filter and resort the table based on ES, NES or pvalue
res <- lapply(res, function(x) {
    x[x$pval < 0.01, ]
})
res <- lapply(res, function(x) {
    x[x$size > 5, ]
})
res <- lapply(res, function(x) {
    x[order(x$NES, decreasing = T), ]
})

# show top 3 for each cluster.
lapply(res, head, 3)
$`0`
                  pathway       pval       padj        ES      NES nMoreExtreme
                   <char>      <num>      <num>     <num>    <num>        <num>
1: CD1C+_B dendritic cell 0.00009999 0.00303303 0.7916808 1.864872            0
2:             Eosinophil 0.00039996 0.00606606 0.8174086 1.725048            3
3:             Neutrophil 0.00009999 0.00303303 0.7762022 1.724466            0
    size  leadingEdge
   <int>       <list>
1:    48 S100A12,....
2:    12 S100A8, ....
3:    21 S100A8, ....

$`1`
               pathway      pval         padj        ES      NES nMoreExtreme
                <char>     <num>        <num>     <num>    <num>        <num>
1: Natural killer cell 9.999e-05 0.0006460892 0.9217755 2.512186            0
2:    Cytotoxic T cell 9.999e-05 0.0006460892 0.9864518 2.166333            0
3:           Leukocyte 9.999e-05 0.0006460892 0.8739252 2.160756            0
    size  leadingEdge
   <int>       <list>
1:    38 KLRF1, K....
2:     6 PRF1, GZ....
3:    15 NCAM1, P....

$`2`
       pathway      pval       padj        ES      NES nMoreExtreme  size
        <char>     <num>      <num>     <num>    <num>        <num> <int>
1:      T cell 9.999e-05 0.00094435 0.8336451 2.104489            0    32
2: CD8+ T cell 9.999e-05 0.00094435 0.8972402 2.053858            0    12
3: CD4+ T cell 9.999e-05 0.00094435 0.9068085 2.052465            0    11
    leadingEdge
         <list>
1: CD8B, GZ....
2: CD8B, CD....
3: CD8A, CD....

$`3`
             pathway      pval        padj        ES      NES nMoreExtreme
              <char>     <num>       <num>     <num>    <num>        <num>
1:            B cell 9.999e-05 0.001874813 0.8799566 1.964896            0
2: Follicular B cell 9.999e-05 0.001874813 0.9447876 1.936300            0
3:      Naive B cell 9.999e-05 0.001874813 0.9209477 1.931583            0
    size  leadingEdge
   <int>       <list>
1:    29 TCL1A, I....
2:    10 TCL1A, I....
3:    13 TCL1A, I....

$`4`
                    pathway       pval        padj        ES      NES
                     <char>      <num>       <num>     <num>    <num>
1: Regulatory T (Treg) cell 0.00009999 0.001659834 0.9237045 1.886693
2:                   T cell 0.00009999 0.001659834 0.8265070 1.872116
3:                Leukocyte 0.00019998 0.002074793 0.8988479 1.856992
   nMoreExtreme  size  leadingEdge
          <num> <int>       <list>
1:            0     9 CCR4, RT....
2:            0    30 IL2RA, C....
3:            1    10 CCR4, IL....

$`5`
          pathway       pval       padj        ES      NES nMoreExtreme  size
           <char>      <num>      <num>     <num>    <num>        <num> <int>
1: CD16+ monocyte 0.00269973 0.06074393 0.8832915 1.766738           26     6
2:     Macrophage 0.00009999 0.00899910 0.7733105 1.757869            0    24
3:       Monocyte 0.00179982 0.06074393 0.6690926 1.540722           17    28
    leadingEdge
         <list>
1: TCF7L2, ....
2: C1QA, C1....
3: MS4A7, L....

$`6`
         pathway      pval       padj        ES      NES nMoreExtreme  size
          <char>     <num>      <num>     <num>    <num>        <num> <int>
1: Memory B cell 9.999e-05 0.00189981 0.9293822 1.917626            0    15
2:   Plasma cell 9.999e-05 0.00189981 0.9140237 1.872718            0    13
3:        B cell 9.999e-05 0.00189981 0.8399004 1.843811            0    37
    leadingEdge
         <list>
1: KLK1, EB....
2: IGHA2, C....
3: CD80, CD....

$`7`
                      pathway      pval       padj        ES      NES
                       <char>     <num>      <num>     <num>    <num>
1: Central memory CD8+ T cell 9.999e-05 0.00109989 0.9244203 2.114857
2: Central memory CD4+ T cell 9.999e-05 0.00109989 0.9043366 2.050447
3:           Naive CD8 T cell 9.999e-05 0.00109989 0.9158253 2.050195
   nMoreExtreme  size  leadingEdge
          <num> <int>       <list>
1:            0    12 TSHZ2, L....
2:            0    11 TSHZ2, L....
3:            0    10 TSHZ2, L....

$`8`
                   pathway       pval       padj        ES      NES
                    <char>      <num>      <num>     <num>    <num>
1:           Megakaryocyte 0.00009999 0.00869913 0.9502128 1.856966
2: Hematopoietic stem cell 0.00019998 0.00869913 0.8551228 1.648128
3:                Platelet 0.00179982 0.05219478 0.7622409 1.510292
   nMoreExtreme  size  leadingEdge
          <num> <int>       <list>
1:            0    16 GP9, PF4....
2:            1    13 ESAM, MM....
3:           17    21 GP9, PF4....

$`9`
       pathway      pval       padj        ES      NES nMoreExtreme  size
        <char>     <num>      <num>     <num>    <num>        <num> <int>
1:      B cell 9.999e-05 0.00283305 0.9222713 2.131979            0    11
2: Plasma cell 9.999e-05 0.00283305 0.9327666 2.104972            0     9
3: Plasmablast 9.999e-05 0.00283305 0.8650491 1.999701            0    11
    leadingEdge
         <list>
1: CDC20, C....
2: IGHA1, J....
3: IGHA1, M....

Let’s plot the results.

new.cluster.ids <- unlist(lapply(res, function(x) {
    as.data.frame(x)[1, 1]
}))
annot = new.cluster.ids[as.character(alldata@active.ident)]
names(annot) = colnames(alldata)
alldata$cellmarker_gsea <- annot

wrap_plots(
    DimPlot(alldata, label = T, group.by = "ref_gsea") + NoAxes(),
    DimPlot(alldata, label = T, group.by = "cellmarker_gsea") + NoAxes(),
    ncol = 2
)

Discuss

Do you think that the methods overlap well? Where do you see the most inconsistencies?

In this case we do not have any ground truth, and we cannot say which method performs best. You should keep in mind, that any celltype classification method is just a prediction, and you still need to use your common sense and knowledge of the biological system to judge if the results make sense.

Finally, lets save the data with predictions.

saveRDS(ctrl, "data/covid/results/seurat_covid_qc_dr_int_cl_ct-ctrl13.rds")

8 Session info

Click here
sessionInfo()
R version 4.3.3 (2024-02-29)
Platform: x86_64-apple-darwin13.4.0 (64-bit)
Running under: macOS Big Sur ... 10.16

Matrix products: default
BLAS/LAPACK: /Users/asabjor/miniconda3/envs/seurat5/lib/libopenblasp-r0.3.27.dylib;  LAPACK version 3.12.0

locale:
[1] sv_SE.UTF-8/sv_SE.UTF-8/sv_SE.UTF-8/C/sv_SE.UTF-8/sv_SE.UTF-8

time zone: Europe/Stockholm
tzcode source: system (macOS)

attached base packages:
[1] stats4    stats     graphics  grDevices utils     datasets  methods  
[8] base     

other attached packages:
 [1] fgsea_1.28.0                Azimuth_0.5.0              
 [3] shinyBS_0.61.1              pbmcref.SeuratData_1.0.0   
 [5] SeuratData_0.2.2.9001       SingleR_2.4.0              
 [7] celldex_1.12.0              SummarizedExperiment_1.32.0
 [9] Biobase_2.62.0              GenomicRanges_1.54.1       
[11] GenomeInfoDb_1.38.1         IRanges_2.36.0             
[13] S4Vectors_0.40.2            BiocGenerics_0.48.1        
[15] MatrixGenerics_1.14.0       matrixStats_1.4.1          
[17] scPred_1.9.2                pheatmap_1.0.12            
[19] ggplot2_3.5.1               patchwork_1.2.0            
[21] dplyr_1.1.4                 Seurat_5.1.0               
[23] SeuratObject_5.0.2          sp_2.1-4                   

loaded via a namespace (and not attached):
  [1] R.methodsS3_1.8.2                 progress_1.2.3                   
  [3] nnet_7.3-19                       poweRlaw_0.80.0                  
  [5] goftest_1.2-3                     DT_0.33                          
  [7] Biostrings_2.70.1                 vctrs_0.6.5                      
  [9] spatstat.random_3.2-3             digest_0.6.37                    
 [11] png_0.1-8                         ggrepel_0.9.6                    
 [13] deldir_2.0-4                      parallelly_1.38.0                
 [15] MASS_7.3-60.0.1                   Signac_1.14.0                    
 [17] reshape2_1.4.4                    httpuv_1.6.15                    
 [19] foreach_1.5.2                     withr_3.0.1                      
 [21] xfun_0.47                         survival_3.7-0                   
 [23] EnsDb.Hsapiens.v86_2.99.0         memoise_2.0.1                    
 [25] ggbeeswarm_0.7.2                  zoo_1.8-12                       
 [27] gtools_3.9.5                      pbapply_1.7-2                    
 [29] R.oo_1.26.0                       prettyunits_1.2.0                
 [31] KEGGREST_1.42.0                   promises_1.3.0                   
 [33] httr_1.4.7                        restfulr_0.0.15                  
 [35] rhdf5filters_1.14.1               globals_0.16.3                   
 [37] fitdistrplus_1.2-1                rhdf5_2.46.1                     
 [39] miniUI_0.1.1.1                    generics_0.1.3                   
 [41] curl_5.2.1                        zlibbioc_1.48.0                  
 [43] ScaledMatrix_1.10.0               polyclip_1.10-7                  
 [45] GenomeInfoDbData_1.2.11           ExperimentHub_2.10.0             
 [47] SparseArray_1.2.2                 interactiveDisplayBase_1.40.0    
 [49] xtable_1.8-4                      stringr_1.5.1                    
 [51] pracma_2.4.4                      evaluate_0.24.0                  
 [53] S4Arrays_1.2.0                    BiocFileCache_2.10.1             
 [55] hms_1.1.3                         irlba_2.3.5.1                    
 [57] colorspace_2.1-1                  filelock_1.0.3                   
 [59] hdf5r_1.3.11                      ROCR_1.0-11                      
 [61] harmony_1.2.1                     reticulate_1.39.0                
 [63] spatstat.data_3.1-2               magrittr_2.0.3                   
 [65] lmtest_0.9-40                     readr_2.1.5                      
 [67] later_1.3.2                       lattice_0.22-6                   
 [69] spatstat.geom_3.2-9               future.apply_1.11.2              
 [71] scuttle_1.12.0                    scattermore_1.2                  
 [73] XML_3.99-0.17                     cowplot_1.1.3                    
 [75] RcppAnnoy_0.0.22                  class_7.3-22                     
 [77] pillar_1.9.0                      nlme_3.1-165                     
 [79] iterators_1.0.14                  caTools_1.18.3                   
 [81] compiler_4.3.3                    beachmat_2.18.0                  
 [83] RSpectra_0.16-2                   stringi_1.8.4                    
 [85] gower_1.0.1                       tensor_1.5                       
 [87] lubridate_1.9.3                   GenomicAlignments_1.38.0         
 [89] plyr_1.8.9                        crayon_1.5.3                     
 [91] abind_1.4-5                       BiocIO_1.12.0                    
 [93] googledrive_2.1.1                 locfit_1.5-9.9                   
 [95] bit_4.0.5                         fastmatch_1.1-4                  
 [97] codetools_0.2-20                  recipes_1.1.0                    
 [99] BiocSingular_1.18.0               plotly_4.10.4                    
[101] mime_0.12                         splines_4.3.3                    
[103] Rcpp_1.0.13                       fastDummies_1.7.4                
[105] dbplyr_2.5.0                      sparseMatrixStats_1.14.0         
[107] cellranger_1.1.0                  knitr_1.48                       
[109] blob_1.2.4                        utf8_1.2.4                       
[111] BiocVersion_3.18.1                seqLogo_1.68.0                   
[113] AnnotationFilter_1.26.0           fs_1.6.4                         
[115] listenv_0.9.1                     DelayedMatrixStats_1.24.0        
[117] tibble_3.2.1                      Matrix_1.6-5                     
[119] statmod_1.5.0                     tzdb_0.4.0                       
[121] pkgconfig_2.0.3                   tools_4.3.3                      
[123] cachem_1.1.0                      RSQLite_2.3.7                    
[125] viridisLite_0.4.2                 DBI_1.2.3                        
[127] fastmap_1.2.0                     rmarkdown_2.28                   
[129] scales_1.3.0                      grid_4.3.3                       
[131] ica_1.0-3                         shinydashboard_0.7.2             
[133] Rsamtools_2.18.0                  AnnotationHub_3.10.0             
[135] BiocManager_1.30.25               dotCall64_1.1-1                  
[137] RANN_2.6.2                        rpart_4.1.23                     
[139] farver_2.1.2                      yaml_2.3.10                      
[141] rtracklayer_1.62.0                cli_3.6.3                        
[143] purrr_1.0.2                       leiden_0.4.3.1                   
[145] lifecycle_1.0.4                   caret_6.0-94                     
[147] uwot_0.1.16                       bluster_1.12.0                   
[149] presto_1.0.0                      lava_1.8.0                       
[151] BSgenome.Hsapiens.UCSC.hg38_1.4.5 BiocParallel_1.36.0              
[153] annotate_1.80.0                   timechange_0.3.0                 
[155] gtable_0.3.5                      rjson_0.2.21                     
[157] ggridges_0.5.6                    progressr_0.14.0                 
[159] limma_3.58.1                      parallel_4.3.3                   
[161] pROC_1.18.5                       edgeR_4.0.16                     
[163] jsonlite_1.8.8                    RcppHNSW_0.6.0                   
[165] TFBSTools_1.40.0                  bitops_1.0-8                     
[167] bit64_4.0.5                       Rtsne_0.17                       
[169] BiocNeighbors_1.20.0              spatstat.utils_3.1-0             
[171] CNEr_1.38.0                       metapod_1.10.0                   
[173] dqrng_0.3.2                       shinyjs_2.1.0                    
[175] SeuratDisk_0.0.0.9021             R.utils_2.12.3                   
[177] timeDate_4032.109                 lazyeval_0.2.2                   
[179] shiny_1.9.1                       htmltools_0.5.8.1                
[181] GO.db_3.18.0                      sctransform_0.4.1                
[183] rappdirs_0.3.3                    ensembldb_2.26.0                 
[185] glue_1.7.0                        TFMPvalue_0.0.9                  
[187] spam_2.10-0                       googlesheets4_1.1.1              
[189] XVector_0.42.0                    RCurl_1.98-1.16                  
[191] scran_1.30.0                      BSgenome_1.70.1                  
[193] gridExtra_2.3                     JASPAR2020_0.99.10               
[195] igraph_2.0.3                      R6_2.5.1                         
[197] SingleCellExperiment_1.24.0       tidyr_1.3.1                      
[199] labeling_0.4.3                    RcppRoll_0.3.1                   
[201] GenomicFeatures_1.54.1            cluster_2.1.6                    
[203] Rhdf5lib_1.24.0                   gargle_1.5.2                     
[205] ipred_0.9-15                      DirichletMultinomial_1.44.0      
[207] DelayedArray_0.28.0               tidyselect_1.2.1                 
[209] vipor_0.4.7                       ProtGenerics_1.34.0              
[211] xml2_1.3.6                        AnnotationDbi_1.64.1             
[213] future_1.34.0                     ModelMetrics_1.2.2.2             
[215] rsvd_1.0.5                        munsell_0.5.1                    
[217] KernSmooth_2.23-24                data.table_1.15.4                
[219] htmlwidgets_1.6.4                 RColorBrewer_1.1-3               
[221] biomaRt_2.58.0                    rlang_1.1.4                      
[223] spatstat.sparse_3.1-0             spatstat.explore_3.2-6           
[225] fansi_1.0.6                       hardhat_1.4.0                    
[227] beeswarm_0.4.0                    prodlim_2024.06.25