class: center, middle, inverse, title-slide .title[ # Base R graphics ] .subtitle[ ## R Foundations for Data Analysis ] .author[ ### Lokesh Mano ] --- exclude: true count: false <link href="https://fonts.googleapis.com/css?family=Roboto|Source+Sans+Pro:300,400,600|Ubuntu+Mono&subset=latin-ext" rel="stylesheet"> <link rel="stylesheet" href="https://use.fontawesome.com/releases/v5.3.1/css/all.css" integrity="sha384-mzrmE5qonljUremFsqc01SB46JvROS7bZs3IO2EmfFsd15uHvIt+Y8vEf7N7fWAU" crossorigin="anonymous"> <!-- ------------ Only edit title, subtitle & author above this ------------ --> --- name: ex2_graphics # Example graphics .pull-left-70[ 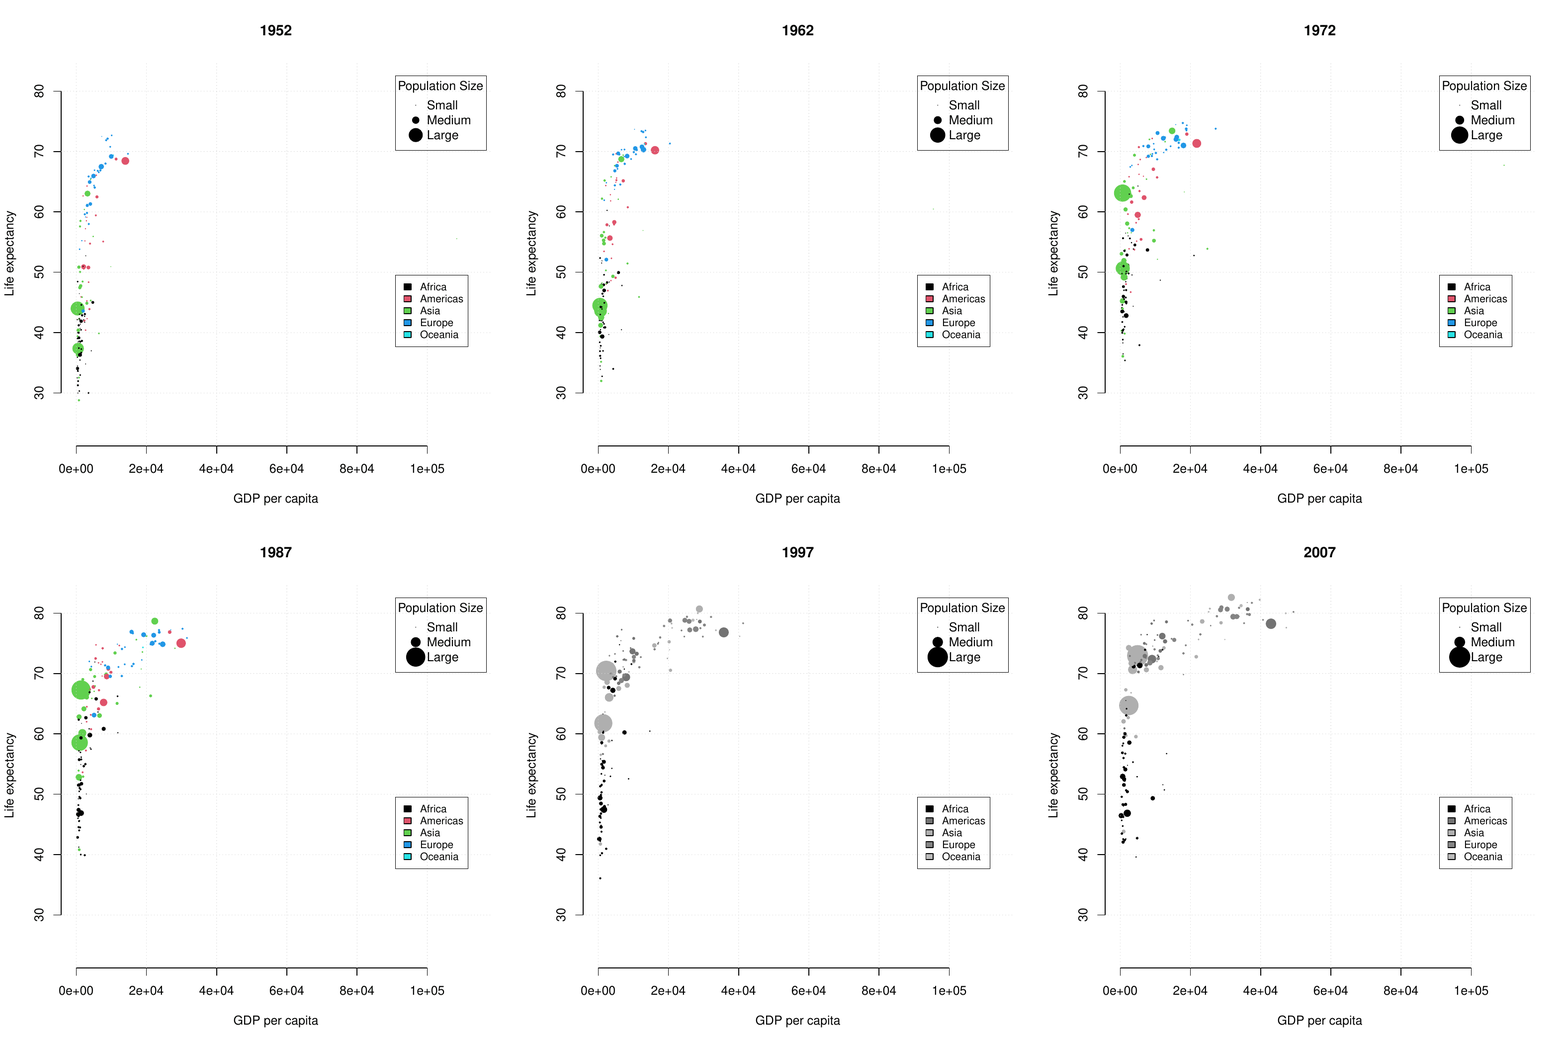 ] --- name: graphical_devices class: spaced # Graphical devices The concept of a **graphical device** is crucial for understanding R graphics. -- A device can be a screen (default) or a file. -- Creating a plot entails: * opening a graphical device (not necessary for plotting on screen), -- * plotting to the graphical device, -- * closing the graphical device (very important!) -- # Common graphical devices <table> <thead> <tr> <th style="text-align:left;"> Device.Type </th> <th style="text-align:left;"> Functions </th> <th style="text-align:left;"> Notes </th> </tr> </thead> <tbody> <tr> <td style="text-align:left;"> Screen </td> <td style="text-align:left;"> default device </td> <td style="text-align:left;"> Displays plot on screen </td> </tr> <tr> <td style="text-align:left;"> Bitmap/Raster </td> <td style="text-align:left;"> png(), bmp(), tiff(), jpeg() </td> <td style="text-align:left;"> Use for images with pixel data </td> </tr> <tr> <td style="text-align:left;"> Vector </td> <td style="text-align:left;"> svg(), pdf() </td> <td style="text-align:left;"> High-quality, scalable graphics </td> </tr> <tr> <td style="text-align:left;"> Cairo </td> <td style="text-align:left;"> cairo_pdf(), cairo_ps() </td> <td style="text-align:left;"> Enhanced quality, especially on Windows </td> </tr> </tbody> </table> For more information visit [this link](http://stat.ethz.ch/R-manual/R-devel/library/grDevices/html/Devices.html). --- name: working_with_graphical_devs class: spaced # Working with graphical devices ``` r png(filename = 'myplot.png', width = 320, height = 320, antialias = T) # anti-aliasing, a technique that smooths the edges of shapes and text in the plot, # making them appear less pixelated or jagged. plot(x=c(1,2,7), y=c(2,3,5)) dev.off() ``` -- What we did was, in sequence: * open a graphical device, here `png()` with some parameters, * do the actual plotting to the device using `plot()` and * close the graphical device using `dev.off()`. -- > It is of paramount importance to remember to close graphical devices. Otherwise, our plots may end up in some random weird files or on screens. --- name: plot_basics # `base::plot()` basics `base::plot()` is a basic command that lets you visualize your data and results. It is very powerful yet takes some effort to fully master it. Let's begin with plotting three points: * A(1,2); * B(2,3); * C(7,5); .size-40[ ``` r plot(x=c(1,2,7), y=c(2,3,5)) ``` <img src="slide_base_graphics_files/figure-html/plot1-1.png" width="504" style="display: block; margin: auto;" /> ] --- name: plot_data_frame # Anatomy of a plot — episode 1 For convenience, we will create a data frame with our points: .pull-left-50[ ``` ## x y ## A 1 2 ## B 2 3 ## C 7 5 ``` ] .pull-right-50[ ``` r plot(df) ``` <img src="slide_base_graphics_files/figure-html/unnamed-chunk-3-1.png" width="504" style="display: block; margin: auto;" /> ] --- name: plot_anatomy_2 # Anatomy of a plot — episode 2 .pull-left-50[ There are many parameters one can set in `plot()`. Let's have a closer look at some of them: * `pch` – type of the plotting symbol * `col` – color of the points * `cex` – scale for points * `main` – main title of the plot * `sub` – subtitle of the plot * `xlab` – X-axis label * `ylab` – Y-axis label * `las` – axis labels orientation * `cex.axis` – axis lables scale * `xlim` – X-axis limits or range * `ylim` – Y-axis limits or range ] .pull-right-50[ Let's make our plot a bit fancier... ``` r # recycling rule in action! plot(df, pch=c(15,17,19), col=c("tomato", "slateblue"), main="Three points", sub="Stage 1") ``` <img src="slide_base_graphics_files/figure-html/plot2-1.png" width="504" style="display: block; margin: auto;" /> ] --- name: layers_1 # Layers Elements are added to a plot in the same order you plot them. It is like layers in a graphical program. Think about it! For instance the auxiliary grid lines should be plotted before the actual data points. .pull-left-50[ ``` r # make an empty plot plot(1:5, type = "n", las = 1, bty = "n") grid(col = "grey", lty = 3) points(1:5, pch = 19, cex = 3) abline(h = 3, col = "red") ``` ] .pull-right-50[ <img src="slide_base_graphics_files/figure-html/gr.layers.ex-1.png" width="504" style="display: block; margin: auto;" /> ] The line overlaps one data point. It is better to plot it before plotting `points()` --- name: general_thoughts class: spaced # Some thoughts about plotting There is a few points you should have in mind when working with plots: -- * raster (png, jpeg, tiff) or vector graphics (svg, pdf, eps), -- * colors, e.g. color-blind people, warm vs. cool colors and optical illusions (check [colorbrewer2.org](https://colorbrewer2.org/#type=sequential&scheme=BuGn&n=3)), -- * avoid complications, e.g. 3D plots, pie charts etc., -- * use black and shades of grey for things you do not need to emphasize, i.e. basically everything except your main result, -- * avoid 3 axes on one figure. ??? Raster graphics are made of pixels (tiny colored squares). They are resolution-dependent — zooming in makes them blurry. Common formats: PNG, JPEG, TIFF. Vector graphics are made of mathematical paths (lines, curves, shapes). They are resolution-independent — can be scaled without losing quality. Common formats: SVG, PDF, EPS. A bonus note about tiff; tiff is a high-quality raster format — great for preserving detail, but still resolution-dependent (unlike vector graphics). <!-- --------------------- Do not edit this and below --------------------- --> --- name: end_slide class: end-slide, middle count: false # Thank you! Questions? .end-text[ <p class="smaller"> <span class="small" style="line-height: 1.2;">Graphics from </span><img src="./assets/freepik.jpg" style="max-height:20px; vertical-align:middle;"><br> Created: 12-Nov-2026 • <a href="https://www.scilifelab.se/">SciLifeLab</a> • <a href="https://nbis.se/">NBIS</a> </p> ]