
Admixture
Admixture: underlying assumptions
- genetic clustering algorithm
- at least two unadmixed populations
- at least one admixed population
- Maximum Likelihood: ADMIXTURE
- Bayesian: STRUCTURE
- delivers admixture proportions Q
- delivers allele frequencies F for all loci for all K populations
Genotype matrices and data
Code genotypes as integers (we count the number of derived alleles per genotype):
AA\rightarrow 0 Aa\rightarrow 1 aa\rightarrow 2
Let G_i denote a single row: genotype of individual i
Genotype clustering
Early work performed hierarchical clustering on row-wise differences.
Simple idea that clustered individuals to continent.

The admixture model
Population matrix

Assumptions:
- within populations SNPs are in HWE
- linkage equilibrium between remote SNPs
We also assume K populations, L SNPs and record allele frequencies in P

Q is the ancestry matrix. The row Q_i corresponds to the ancestry components of an individual.
A generative model
We want to model the genotypes of an individual given ancestry components and population allele frequencies.
No admixture
Assume no admixture, e.g., Q={0,0,0,1,0}
Genotype at SNP l results from sampling genotypes from the corresponding population allele frequency.

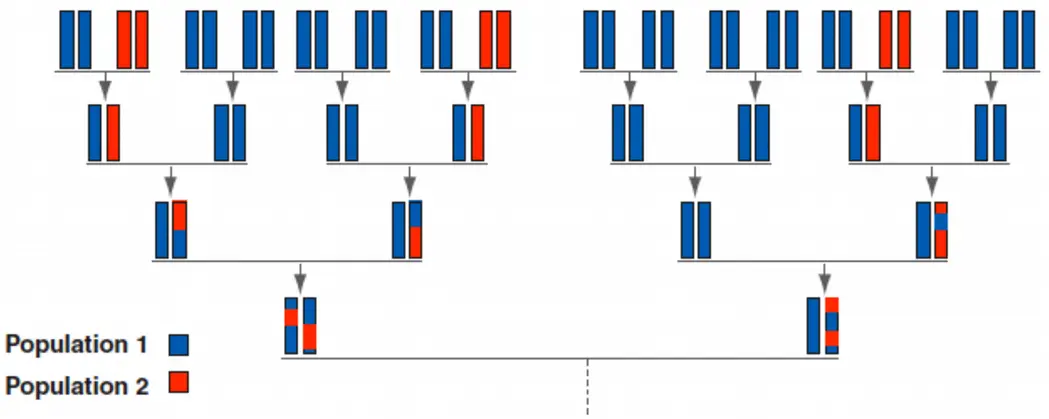
Admixture
Now an individual has ancestry from multiple populations. First therefore it must sample the population, and given the population, can sample random genotypes from the population entry. Here we assume Q_i={0,0.25,0,0.75,0}.

Here we assume P, Q known - we could for instance use compiled databases of population allele frequencies. But we can estimate P and Q directly from data - and this is what software packages ADMIXTURE(Alexander et al., 2009) and STRUCTURE(Pritchard et al., 2000) do.
Admixture in practice

Admixture in practice

Don’t overinterpret admixture bar plots

Bibliography
Alexander, D. H., Novembre, J., & Lange, K. (2009). Fast model-based estimation of ancestry in unrelated individuals. Genome Research, 19(9), 1655–1664. https://doi.org/10.1101/gr.094052.109
Lawson, D. J., van Dorp, L., & Falush, D. (2018). A tutorial on how not to over-interpret STRUCTURE and ADMIXTURE bar plots. Nature Communications, 9(1), 3258. https://doi.org/10.1038/s41467-018-05257-7
Mountain, J. L., & Cavalli-Sforza, L. L. (1997). Multilocus Genotypes, a Tree of Individuals, and Human Evolutionary History. The American Journal of Human Genetics, 61(3), 705–718. https://doi.org/10.1086/515510
Pritchard, J. K., Stephens, M., & Donnelly, P. (2000). Inference of population structure using multilocus genotype data. Genetics, 155(2), 945–959. https://www.ncbi.nlm.nih.gov/pmc/articles/PMC1461096/