Selection
Selection
Selection and fitness
Much confusion exists in the literature regarding how various types of selection are defined, in particular because some of the terminology is used slightly differently within different scientific communities (Nielsen, 2005)
\begin{matrix} \mathrm{Genotype} & AA & Aa & aa \\ \mathrm{Frequency\ in\ newborns} & p^2 & 2pq & q^2\\ \mathrm{Viability} & w_{AA} & w_{Aa} & w_{aa}\\ \mathrm{Frequency\ after\ selection} & p^2w_{AA} / \bar{w} & 2pqw_{Aa} / \bar{w} & q^2w_{aa} / \bar{w} \\ \mathrm{Relative\ fitness} & 1 & 1-hs & 1-s\\ \end{matrix}
where \bar{w} = p^2w_{AA} + 2pqw_{Aa} + q^2w_{aa} is the mean fitness.
| h=0 | A dominant, a recessive |
| h=1 | a dominant, A recessive |
| 0<h<1 | incomplete dominance |
| h<0 | overdominance (heterozygote advantage) |
| h>1 | underdominance |
Notation follows Gillespie (2004), pp. 61–64.
The most important equation in population genetics
p^\prime - p = \Delta_sp = \frac{pq[p(w_{AA} - w_{Aa}) + q(w_{Aa} - w_{aa})]}{p^2w_{AA} + 2pqw_{Aa} + q^2w_{aa}}
Selection and drift - population size matters
In red region (|N_es|<0.05) the probability of fixation is within 10% of neutral fixation.
Consequence: for any population size there exists range of selection coefficients where mutant alleles \approx neutral (effective neutrality).
Direct selection can be inferred from protein substitutions
For genes, the ratio of nonsynonymous to synonymous substitutions can tell us about protein evolution:
Synonymous substitution

Protein          L
DNA         --- CTT ---
                  *
DNA         --- CTC ---
Protein          L
Nonsynonymous substitution
Protein L
DNA --- CTT ---
*
DNA --- CHT ---
Protein H- \mathbf{d_N/d_S << 1}
- negative (purifying) selection
- \mathbf{d_N/d_S < 1}
- majority nonsynonymous deleterious, some advantageous
- \mathbf{d_N/d_S = 1}
- neutral or mix neutral / advantageous / deleterious mutations
- \mathbf{d_N/d_S > 1}
- positive selection
Not all mutations fall in genes. Methods for detecting direct selection not applicable to studying selection on single mutation, or e.g., balancing. This requires looking for specific patterns of diversity surrounding locus under selection.
Linked selection reduces diversity at neighbour loci
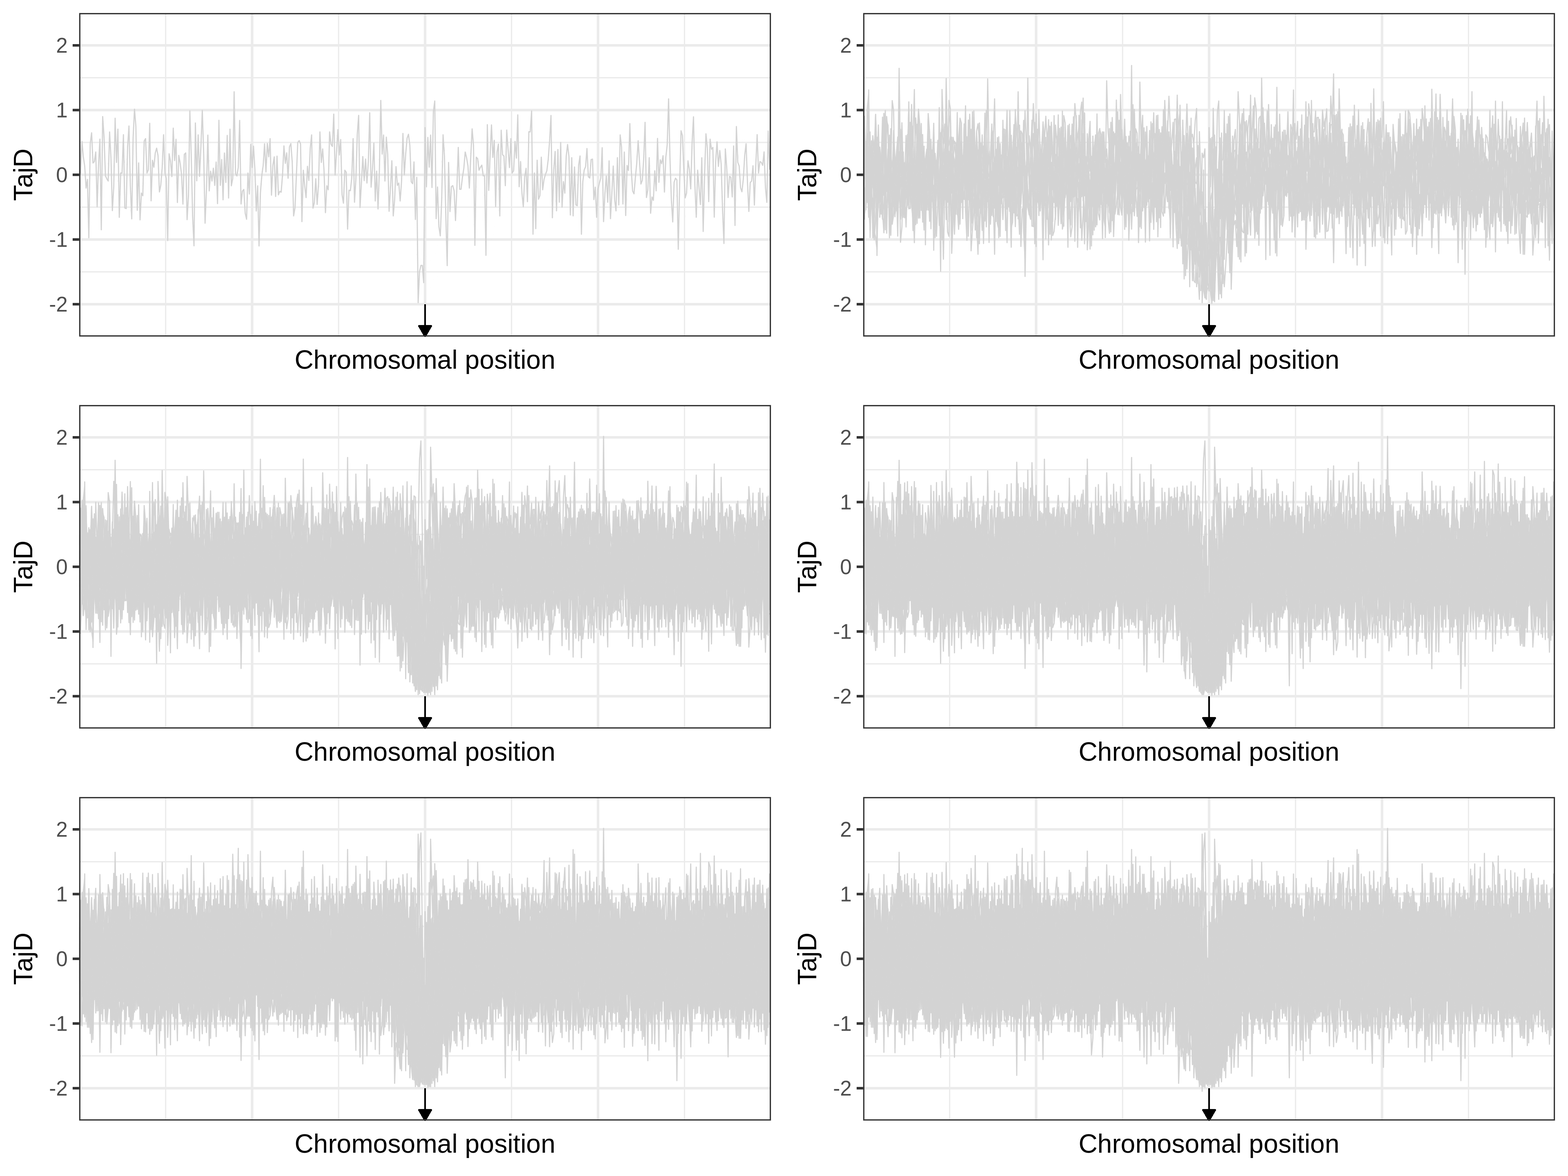
Example of a selective sweep. If a sweep completes at a locus, it will become monomorphic, as will the neighbouring sites. Mutation could reintroduce variation. Recombination could increase diversity in neighbourhood, but in a manner that depends on the distance from the locus under selection.
The effect of a selective sweep on diversity
The effect of a selective sweep on diversity
The effect of a selective sweep on diversity
The phases of a selective sweep
Amount of diversity depends on fixation time. A neutral locus fixes in 4N_e generations; for s=0.0001, it takes approximately 0.29N_e generations.
Selections changes the genealogy (different topology, shorter branches), an aspect used in many linkage-based tests for selection.
Linked selection may constrain levels of diversity
Hitchhiking
- alleles linked to locus under selection “hitchhike” to high frequencies (Smith & Haigh, 1974)
- evidence: positive correlation between putative neutral diversity and recombination (Corbett-Detig et al., 2015)
Background selection
- loci linked to a deleterious locus will be purged from population and thus reduce diversity (Charlesworth et al., 1993)
- similar patterns to hitchhiking
Summary
We have looked at the Wright-Fisher model as a model of populations and genealogies
Genetic drift moves allele frequencies up and down at random and removes variation at rate \propto 1/2N
Mutation reintroduces variation. The Neutral theory posits most mutations are neutral and dynamics follow mutation drift equilibrium.
Methods to detect selection are based on direct selection or studying patterns of variation caused by linked selection.
Bibliography
Selection


