Bulk RNASeq Analysis
16-Nov-2023
What is RNA?
![]()
- The transcriptome is spatially and temporally dynamic
- Data comes from functional units (coding regions)
- Only a tiny fraction of the genome
Workflow

Conesa et al. (2016)
Experimental design
- Biological replicates: 6 - 12 Schurch et al. (2016)
- Sample size estimation Hart et al. (2013)
- Power analysis Zhao et al. (2018) RNASeqPower web app
- Balanced design to avoid batch effects
- RIN values have strong effect Gallego Romero et al. (2014)

Library & Sequencing


- polyA selection / Ribosomal RNA depletion
- Single-end / Paired-end
Workflow • DGE

Read QC
- Number of reads
- Per base sequence quality
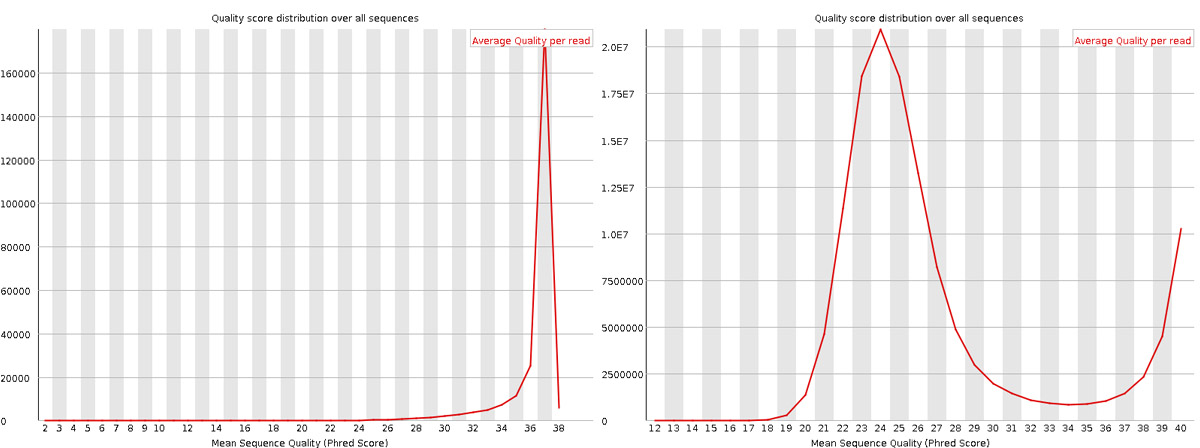
- Per sequence quality score
- Per base sequence content
- Per sequence GC content
- Per base N content
- Sequence length distribution
- Sequence duplication levels
- Overrepresented sequences
- Adapter content
- Kmer content

https://sequencing.qcfail.com/

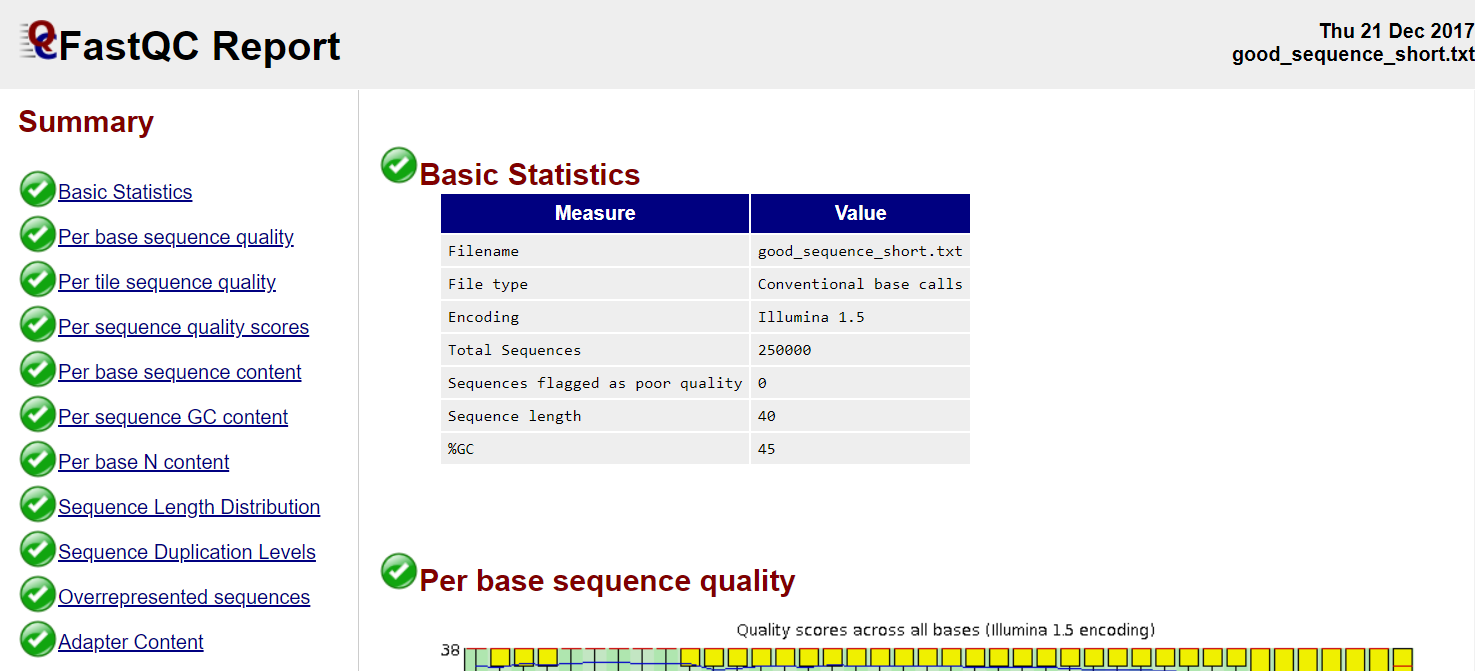
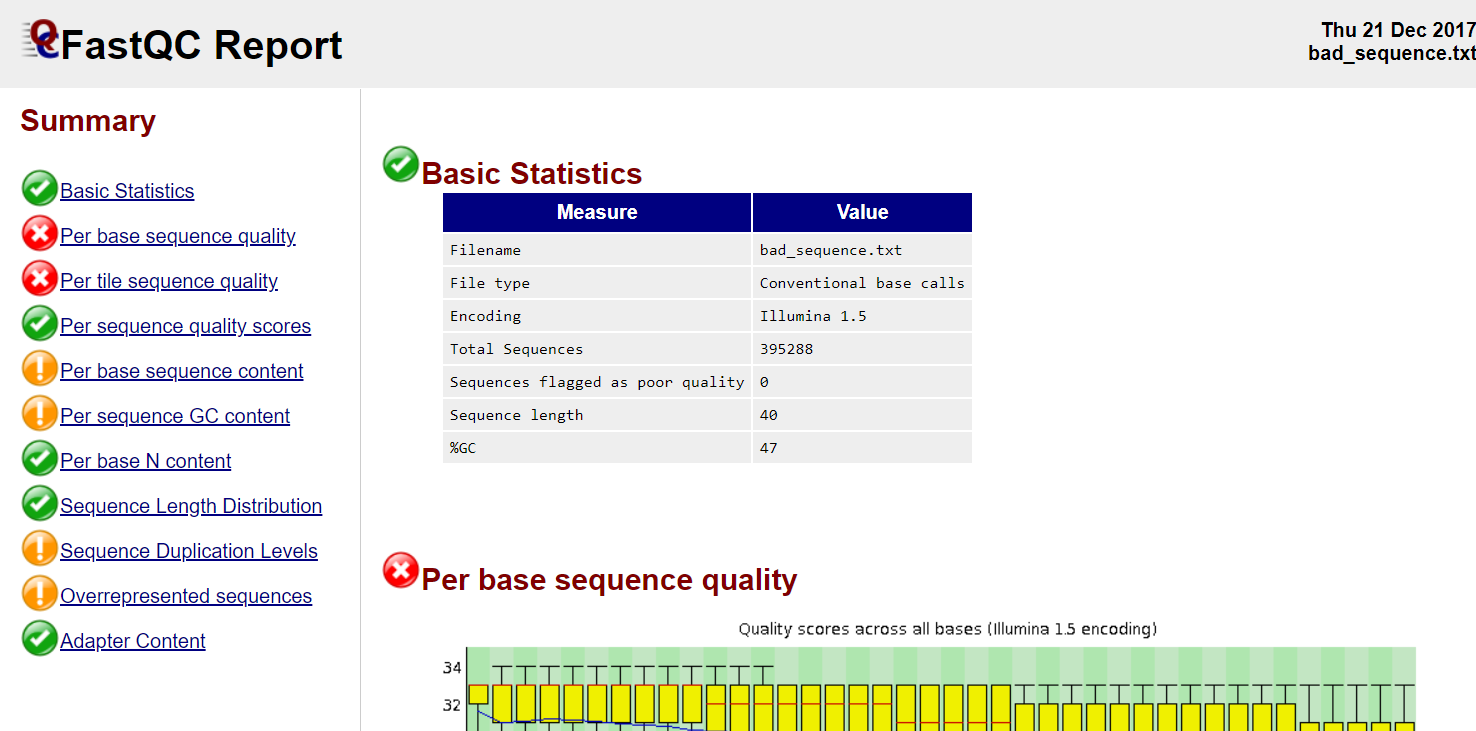
FastQC
Good quality
Poor quality
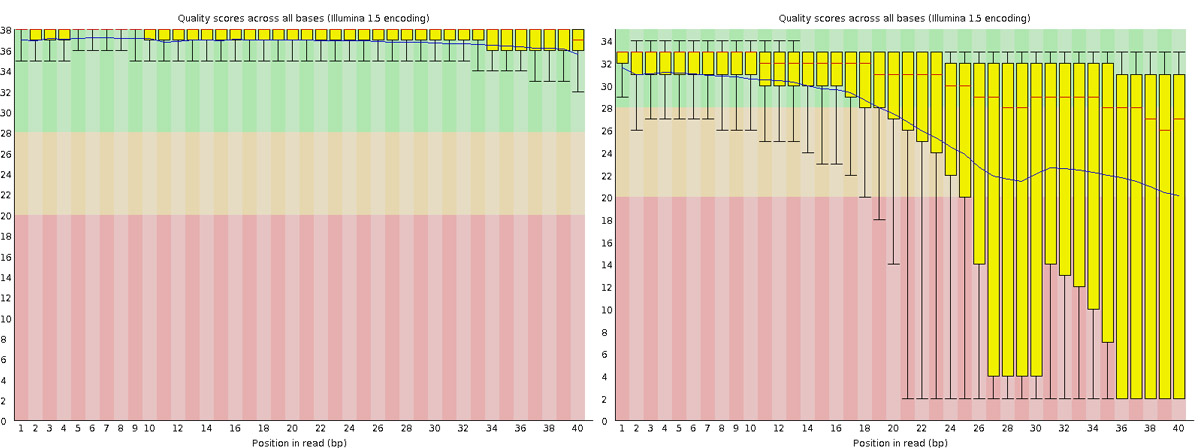
Read QC • PBSQ, PSQS
Per base sequence quality
Per sequence quality scores
Trimming
- Trimming reads to remove adapter/readthrough or low quality bases
- Related options are hard clipping, filtering reads
- Sliding window trimming
- Filter by min/max read length
- Remove reads less than ~18nt
- Demultiplexing/Splitting
When to avoid trimming?
- Read trimming may not always be necessary Liao & Shi (2020)
- Fixed read length may sometimes be more important
- Expected insert size distribution may be more important for assemblers

Mapping

- Aligning reads back to a reference sequence
- Mapping to genome vs transcriptome
- Splice-aware alignment (genome) (STAR, HISAT2 etc)
Aligners • Metrics
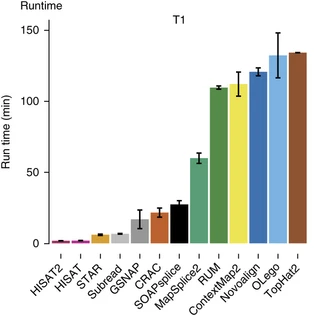
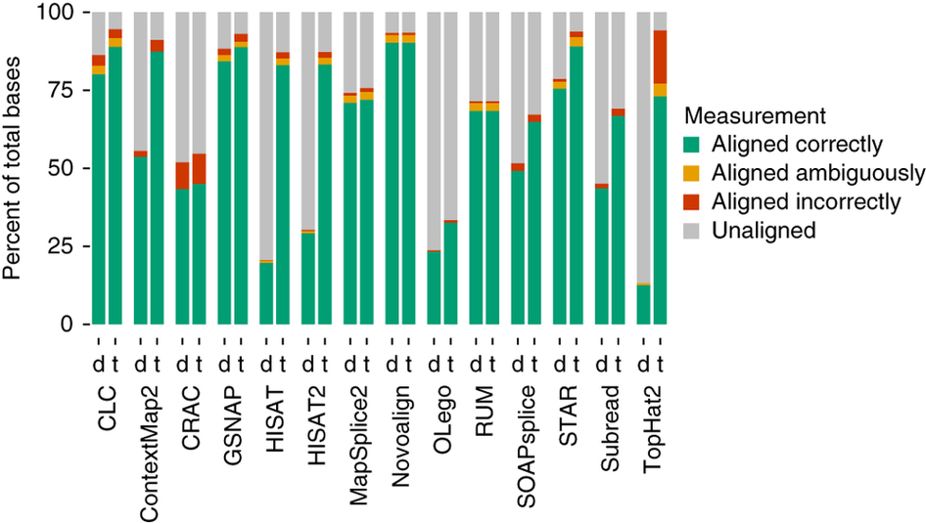

Baruzzo et al. (2017)
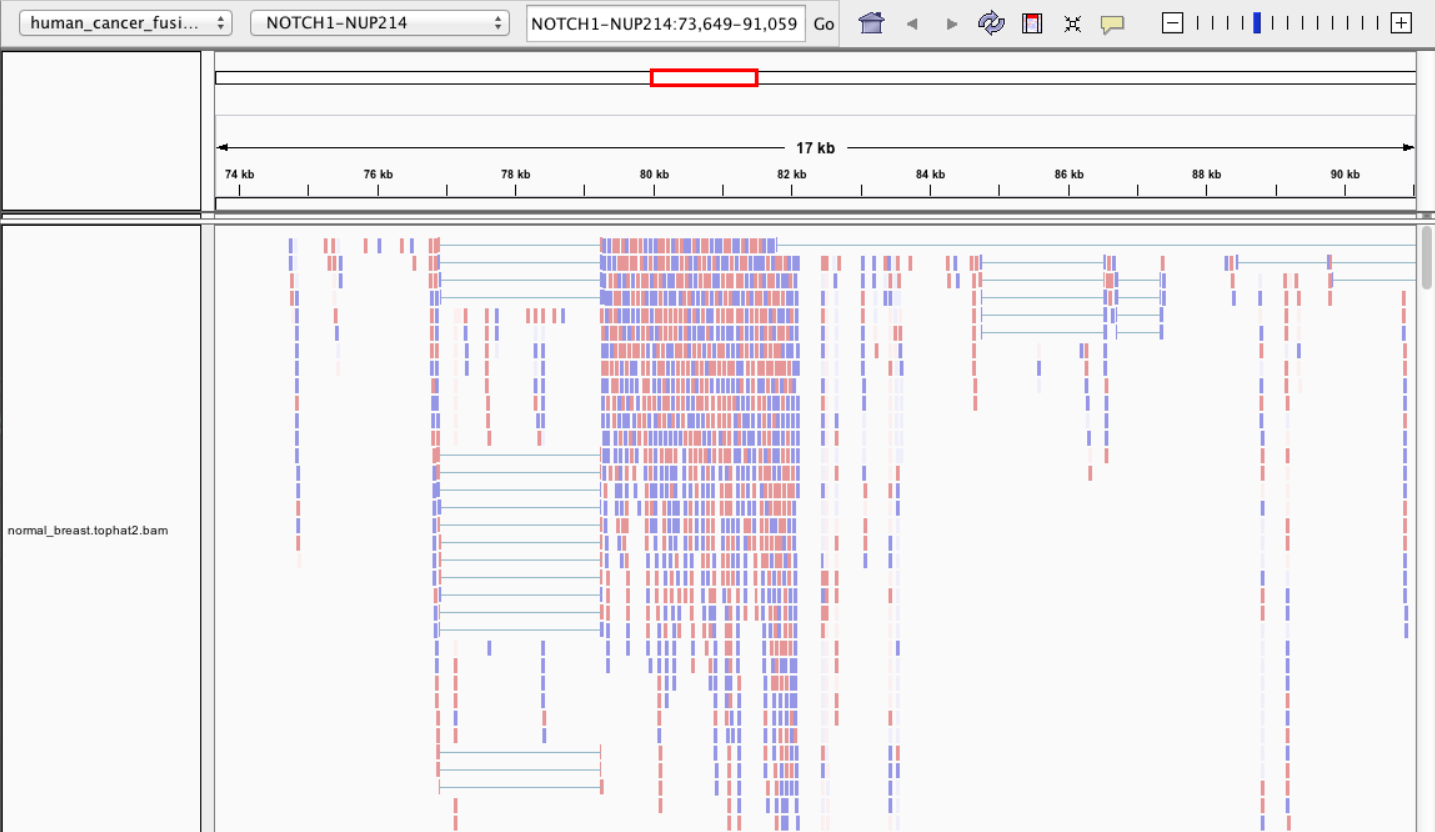
Visualisation • IGV
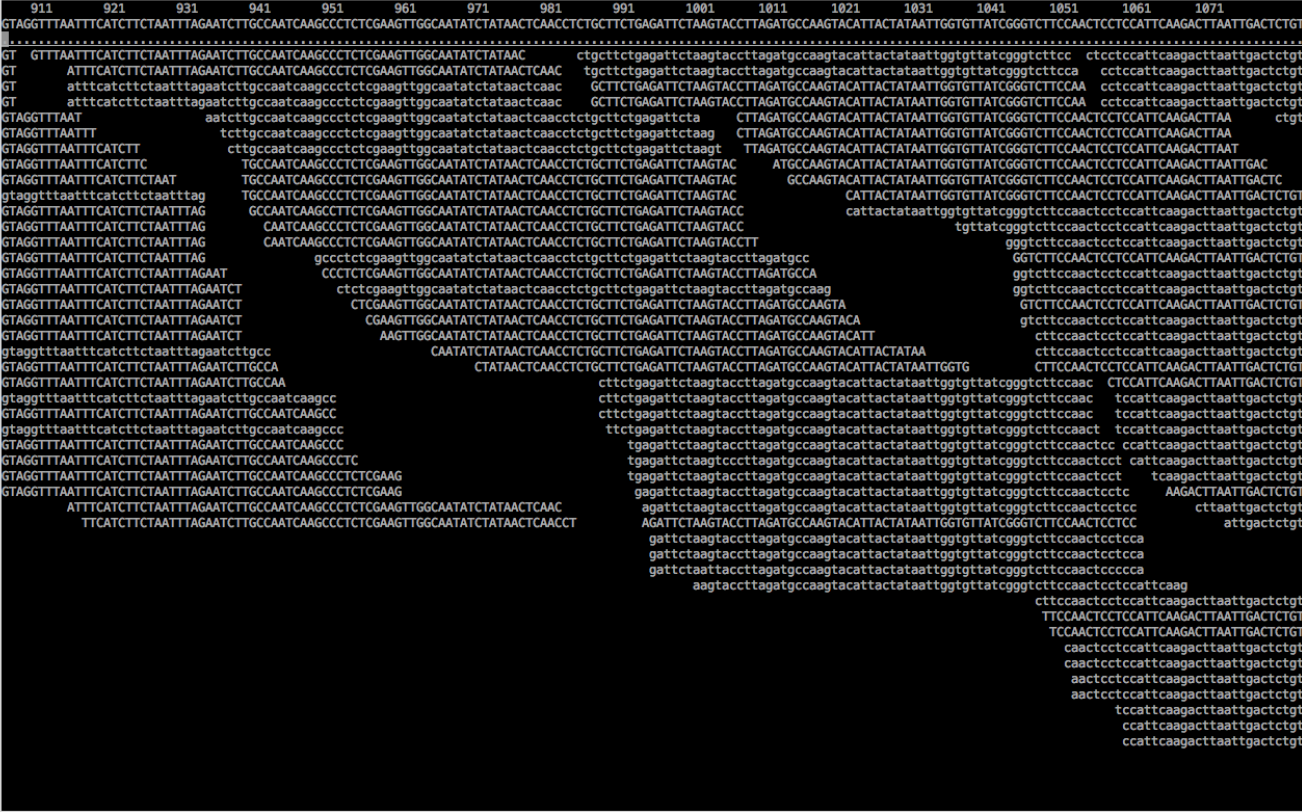
Visualisation • tview
samtools tview alignment.bam genome.fasta
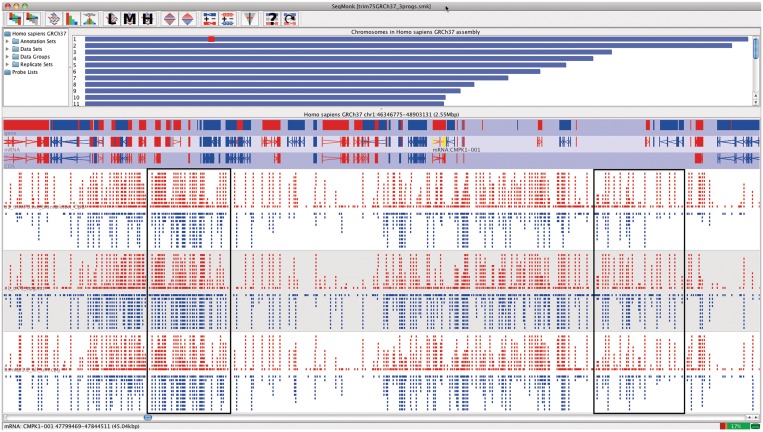
Visualisation • SeqMonk
Alignment QC • STAR Log
MultiQC can be used to summarise and plot STAR log files.

Alignment QC • Features
QoRTs was run on all samples and summarised using MultiQC.

Alignment QC • QoRTs
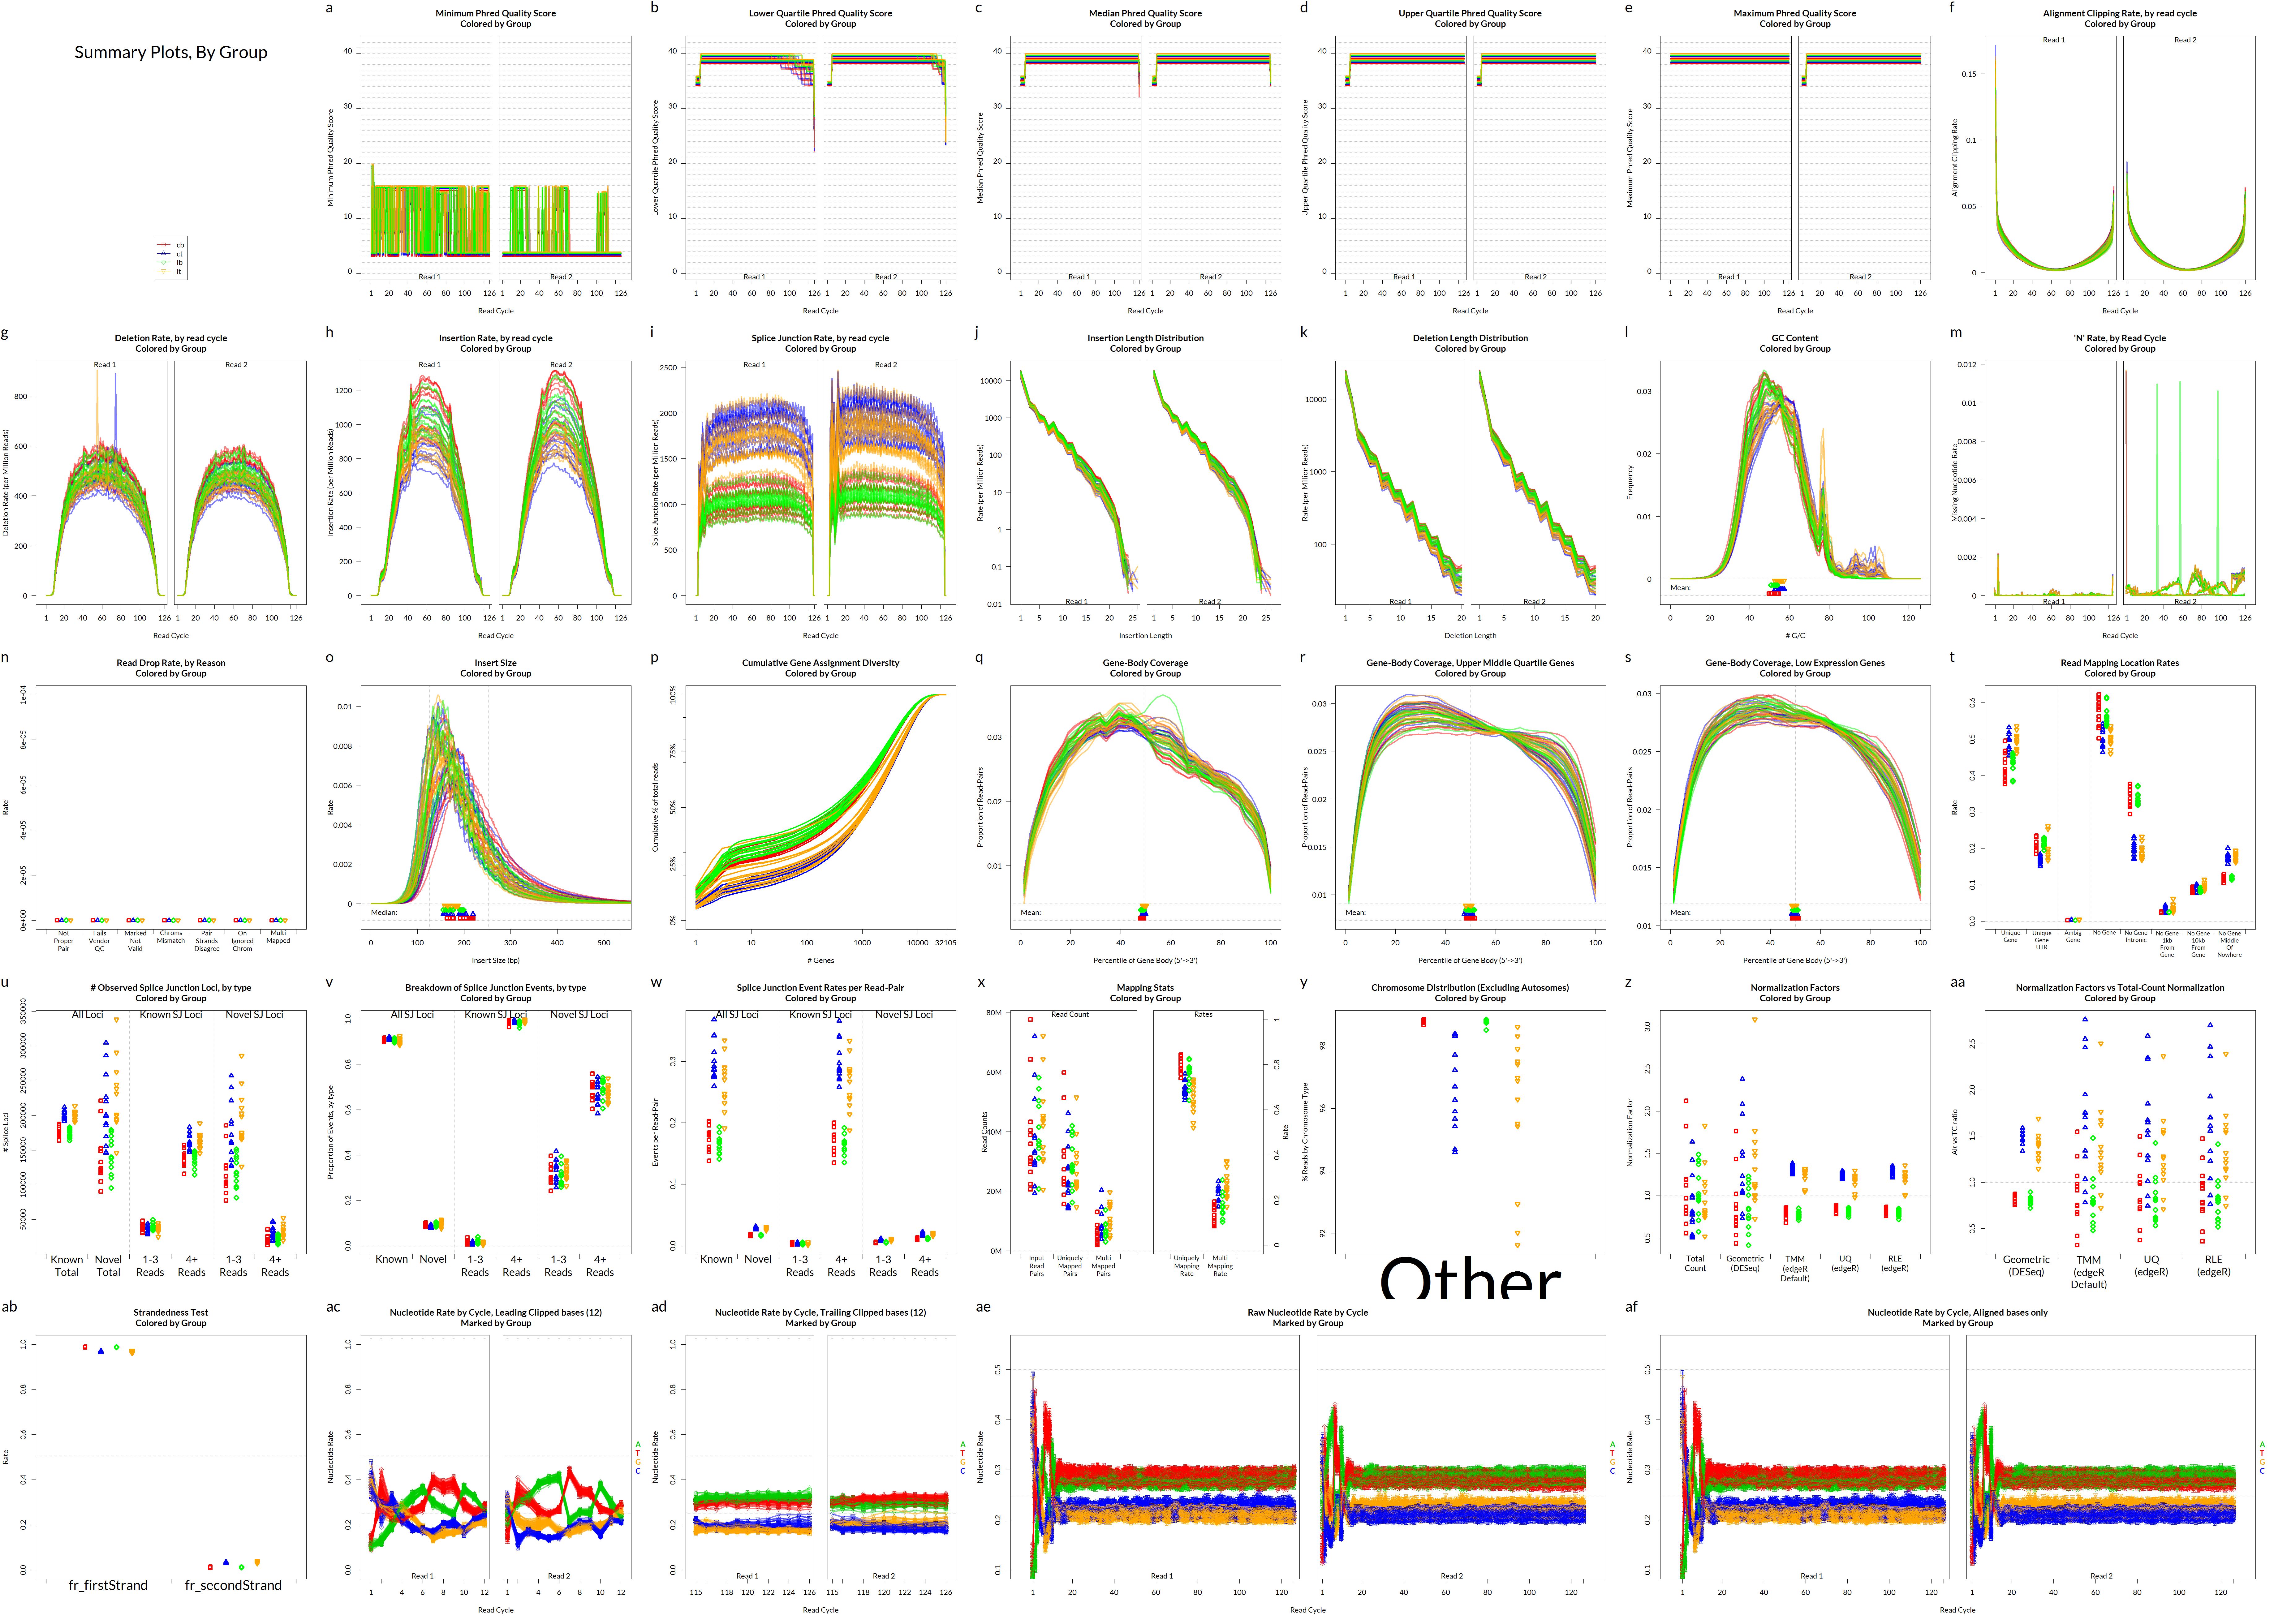
Alignment QC • Examples
Read mapping profile 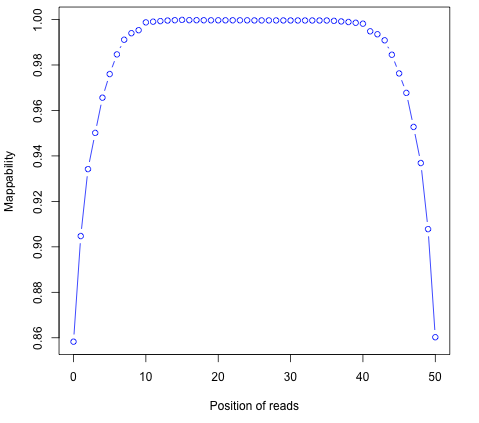
Gene body coverage 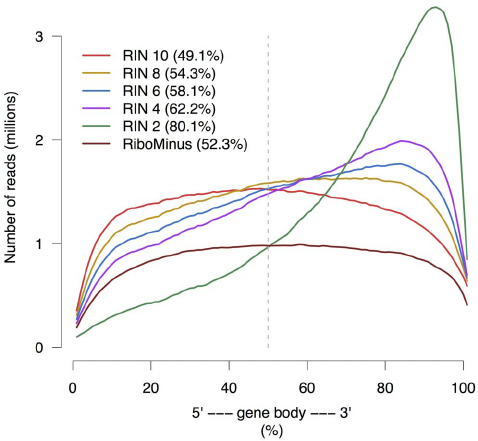
Sigurgeirsson et al. (2014)
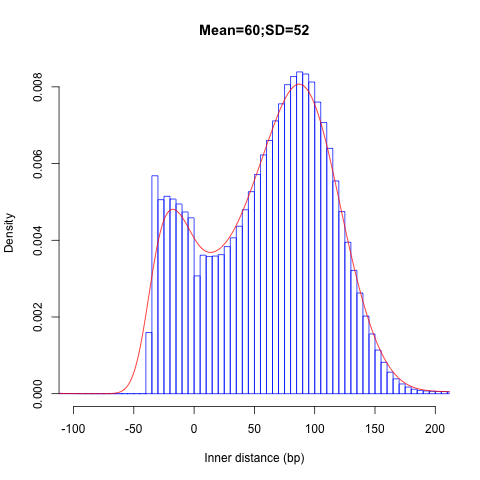
Alignment QC • Examples
Insert size
Saturation curve
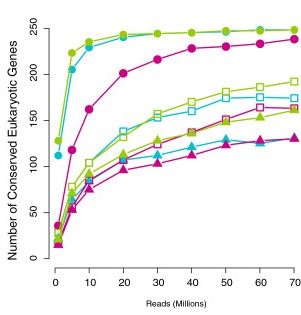
Francis et al. (2013)
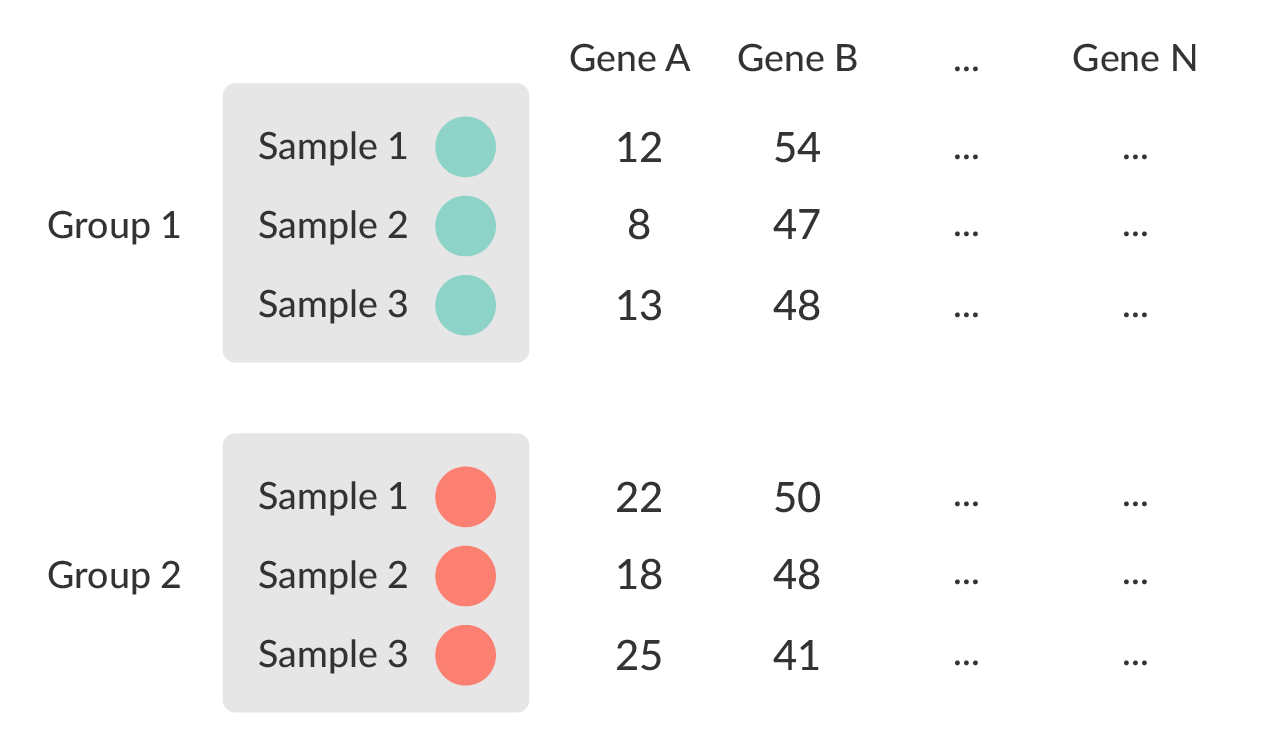
Quantification • Counts
- Read counts = gene expression
- Intersection on gene models
- Reads can be quantified on any feature (gene, transcript, exon etc)


Quantification
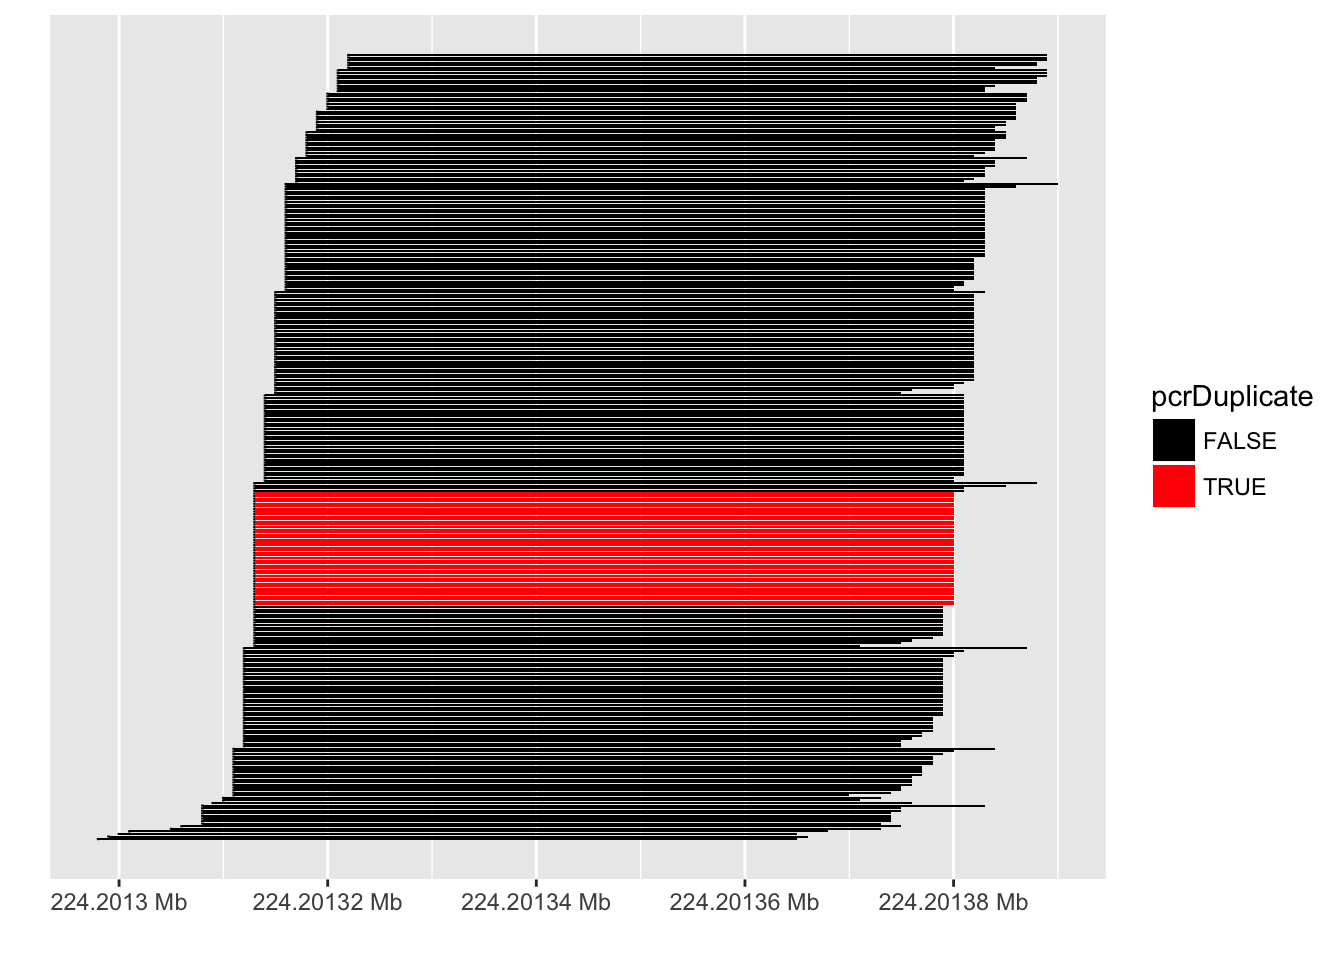
PCR duplicates
- Computational deduplication not recommended Klepikova et al. (2017), Parekh et al. (2016)
- Use PCR-free library-prep kits
- Use UMIs during library-prep Fu et al. (2018)
Multi-mapping
- Added (BEDTools multicov)
- Discard (featureCounts, HTSeq)
- Distribute counts (Cufflinks, featureCounts)
- Rescue
- Probabilistic assignment (Rcount, Cufflinks)
- Prioritise features (Rcount)
- Probabilistic assignment with EM (RSEM)
Quantification QC
ENSG00000000003    140   242   188   143   287   344   438   280   253
ENSG00000000005    0     0     0     0     0     0     0     0     0
ENSG00000000419    69    98    77    55    52    94    116   79    69
ENSG00000000457    56    75    104   79    157   205   183   178   153
ENSG00000000460 33 27 23 19 27 42 69 44 40- Pairwise correlation between samples must be high (>0.9)
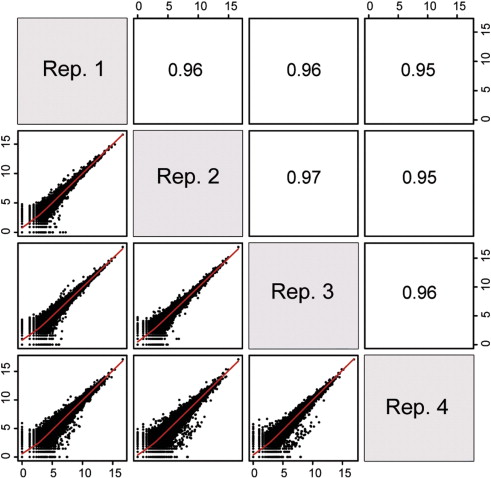
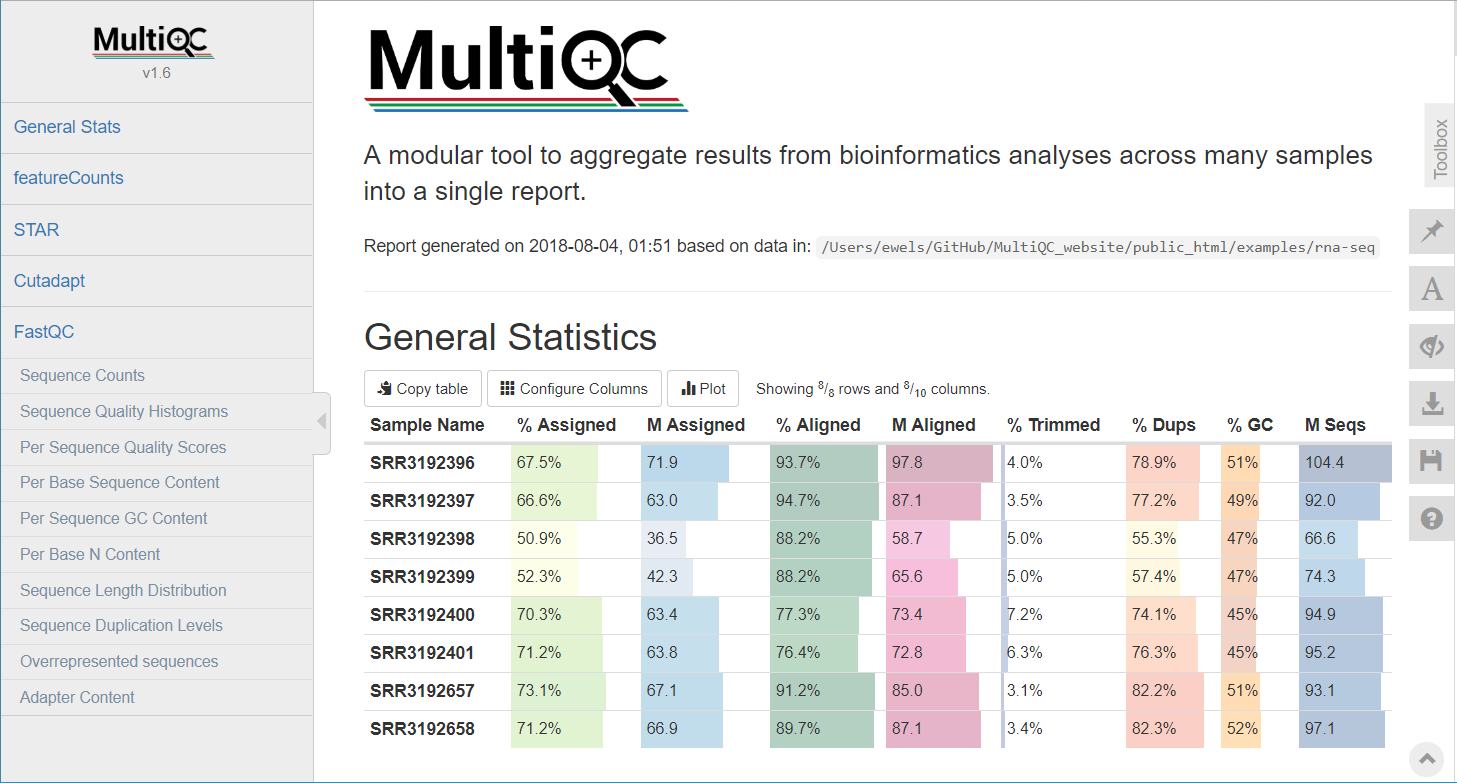
MultiQC
Normalisation
- Control for Sequencing depth, compositional bias and more
- Median of Ratios (DESeq2) and TMM (edgeR) perform the best
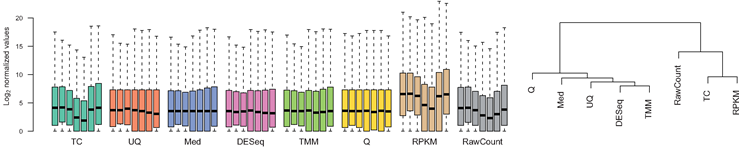
- For DGE using DGE packages, use raw counts
- For clustering, heatmaps etc use VST, VOOM or RLOG
- For own analysis, plots etc, use TPM
- Other solutions: spike-ins/house-keeping genes
Dillies et al. (2013), Evans et al. (2018), Wagner et al. (2012)
Exploratory
- Transform raw counts to VST, VOOM, RLOG, TPM etc
Batch correction
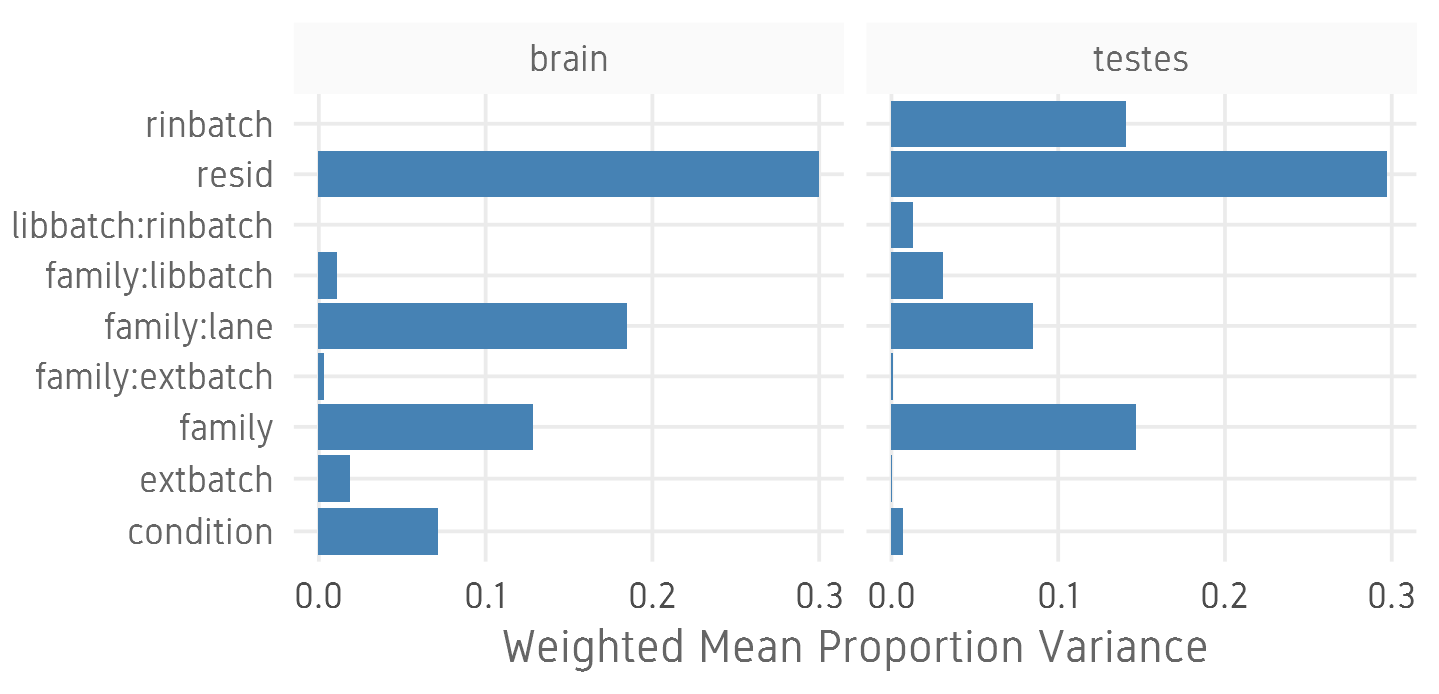
- Estimate variation explained by variables (PVCA)
Differential expression
- Univariate testing gene-by-gene
- More descriptive, less predictive
Differential expression
- DESeq2, edgeR (Neg-binom > GLM > Test)
- Limma-Voom (Neg-binom > Voom-transform > LM > Test)
- DESeq2
~age+condition- Estimate size factors
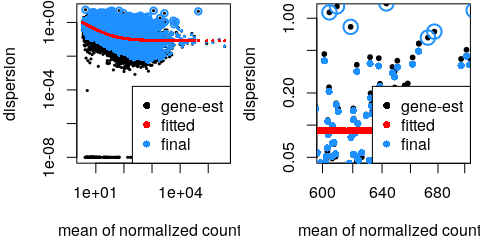
estimateSizeFactors() - Estimate gene-wise dispersion
estimateDispersions() - Fit curve to gene-wise dispersion estimates
- Shrink gene-wise dispersion estimates
- GLM fit for each gene
- Wald test
nbinomWaldTest()
- Estimate size factors
DGE
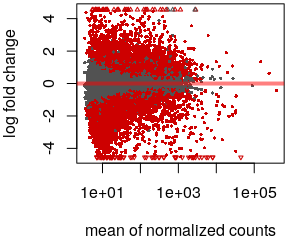
- MA plot
plotMA()
- Volcano plot
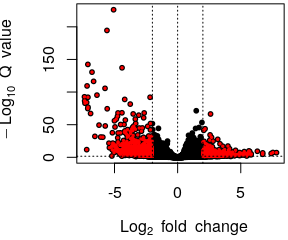
- Normalised counts
plotCounts()
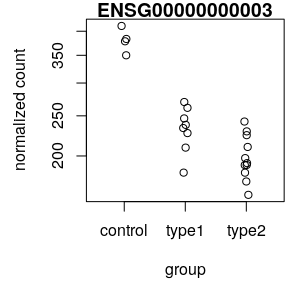
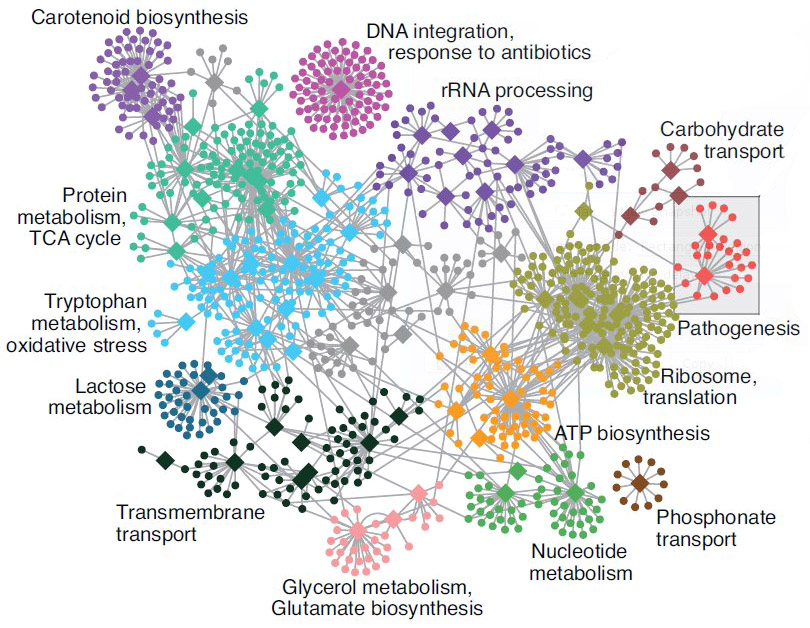
Functional analysis • GO
- Gene set analysis (GSA)
- Gene set enrichment analysis (GSEA)
- Gene ontology / Reactome databases
Functional analysis • Kegg
- Pathway analysis (Kegg)
Further learning
- Griffith lab RNA-Seq using HiSat & StringTie tutorial
- HBC Training DGE using DeSeq2 tutorial
- Hemberg lab scRNA-Seq tutorial
- RNA-Seq Blog
- SciLifeLab courses

Hands-On tutorial
- Course data directory
/sw/courses/ngsintro/rnaseq/
rnaseq/
+-- bonus/
|   +-- assembly/
|   +-- exon/
|   +-- funannot/
|   +-- plots/
+-- documents/
+-- main/
    +-- 1_raw/
    +-- 2_fastqc/
    +-- 3_mapping/
    +-- 4_qualimap/
    +-- 5_dge/
    +-- 6_multiqc/
    +-- reference/
    |   +-- mouse_chr19_hisat2/
+-- scripts/- Your work directory
/proj/naiss2023-22-862/nobackup/user/rnaseq/
[user]/
rnaseq/
  +-- 1_raw/
  +-- 2_fastqc/
  +-- 3_mapping/
  +-- 4_qualimap/
  +-- 5_dge/
  +-- 6_multiqc/
  +-- reference/
  |   +-- mouse_chr19_hisat2/
  +-- scripts/
  +-- funannot/
  +-- plots/