1 Introduction

RNA-seq has become a powerful approach to study the continually changing cellular transcriptome. Here, one of the most common questions is to identify genes that are differentially expressed between two conditions, e.g. controls and treatment. The main exercise in this tutorial will take you through a basic bioinformatic analysis pipeline to answer just that, it will show you how to find differentially expressed (DE) genes.

Main exercise

  • 01 Check the quality of the raw reads with FastQC
  • 02 Map the reads to the reference genome using HISAT2
  • 03 Assess the post-alignment quality using QualiMap
  • 04 Count the reads overlapping with genes using featureCounts
  • 05 Find DE genes using DESeq2 in R

RNA-seq experiment does not necessarily end with a list of DE genes. If you have time after completing the main exercise, try one (or more) of the bonus exercises. The bonus exercises can be run independently of each other, so choose the one that matches your interest. Bonus sections are listed below.

Bonus exercises

  • 01 Functional annotation of DE genes using GO/Reactome databases
  • 02 RNA-Seq figures and plots using R
  • 03 Visualisation of RNA-seq BAM files using IGV genome browser

General guide

  • In paths, remember to change username with your actual UPPMAX username.

  • You are welcome to try your own solutions to the problems, before checking the solution. Click the button to see the suggested solution. There is more than one way to complete a task. Discuss with person next to you and ask us when in doubt.

  • Input code blocks are displayed like shown below. The code language is displayed above the block. Shell scripts (SH) are to be executed in the linux terminal such as bash. R scripts are to be run in R after running R` in the terminal or in R/RStudio locally. Output text blocks are marked as OUTPUT.

sh
command

2 Data description

The data used in this exercise is from the paper: Poitelon, Yannick, et al. YAP and TAZ control peripheral myelination and the expression of laminin receptors in Schwann cells. Nature neuroscience 19.7 (2016): 879. In this study, YAP and TAZ genes were knocked-down in Schwann cells to study myelination, using the sciatic nerve in mice as a model.

Myelination is essential for nervous system function. Schwann cells interact with neurons and the basal lamina to myelinate axons using receptors, signals and transcription factors. Hippo pathway is a conserved pathway involved in cell contact inhibition, and it acts to promote cell proliferation and inhibits apoptosis. The pathway integrates mechanical signals (cell polarity, mechanotransduction, membrane tension) and gene expression response. In addition to its role in organ size control, the Hippo pathway has been implicated in tumorigenesis, for example its deregulation occurs in a broad range of human carcinomas. Transcription co-activators YAP and TAZ are two major downstream effectors of the Hippo pathway, and have redundant roles in transcriptional activation.

The material for RNA-seq was collected from 2 conditions (Wt and KO), each with 3 biological replicates.

Accession Condition Replicate
SRR3222409 KO 1
SRR3222410 KO 2
SRR3222411 KO 3
SRR3222412 Wt 1
SRR3222413 Wt 2
SRR3222414 Wt 3

For the purpose of this tutorial, to shorten the time needed to run various bioinformatics steps, we have picked reads for a single chromosome (Chr 19) and downsampled the reads. We randomly sampled, without replacement, 25% reads from each sample, using fastq-sample from the toolset fastq-tools.

3 Main exercise

The main exercise covers Differential Gene Expression (DGE) workflow from raw reads to a list of differentially expressed genes.

3.1 Using Uppmax

Use ThinLinc

It is recommended to use ThinLinc as this tutorial involves opening GUI windows through the terminal. If you are using MobaXterm on Windows or xQuartz on Mac, this may not apply.

If you are not on ThinLinc, connect to UPPMAX first. Remember to replace username.

sh
ssh -Y username@rackham.uppmax.uu.se

Book a node.

For the RNA-Seq part of the course, we will work on the Rackham cluster. A standard compute node on cluster Rackham has 128 GB of RAM and 20 cores. We will use 1 core per person for this session. Therefore, each core gives you 6.4 GB of RAM. The code below is valid to run at the start of the day. If you are running it in the middle of a day, you need to decrease the time (-t). Do not run this twice and also make sure you are not running computations on a login node.

Book compute resources for RNA-Seq lab.

sh
salloc -A snic2022-22-1124 -t 03:00:00 -p core -n 1 --no-shell

Check allocation. Remember to replace username.

squeue -u username

Once allocation is granted, log on to the compute node. Remember to replace nodename.

ssh -Y nodename

3.1.1 Set-up directory

Setting up the directory structure is an important step as it helps to keep our raw data, intermediate data and results in an organised manner. All work must be carried out at this location /proj/snic2022-22-1124/nobackup/username/ where username is your user name.

Create a directory named rnaseq. All RNA-Seq related activities must be carried out in this sub-directory named rnaseq.

sh
mkdir rnaseq

Create the directory structure as shown below.

username/
rnaseq/
  +-- 1_raw/
  +-- 2_fastqc/
  +-- 3_mapping/
  +-- 4_qualimap/
  +-- 5_dge/
  +-- 6_multiqc/
  +-- reference/
  |   +-- mouse_chr19_hisat2/
  +-- scripts/
  +-- funannot/
  +-- plots

sh
cd rnaseq
mkdir 1_raw 2_fastqc 3_mapping 4_qualimap 5_dge 6_multiqc reference scripts funannot plots
cd reference
mkdir mouse_chr19_hisat2
cd ..

The 1_raw directory will hold the raw fastq files (soft-links). 2_fastqc will hold FastQC outputs. 3_mapping will hold the mapping output files. 4_qualimap will hold the QualiMap output files. 5_dge will hold the counts from featureCounts and all differential gene expression related files. 6_multiqc will hold MultiQC outputs. reference directory will hold the reference genome, annotations and aligner indices. The funannot and plots directory are optional for bonus steps.

It might be a good idea to open an additional terminal window. One to navigate through directories and another for scripting in the scripts directory.

3.2 FastQC

Quality check using FastQC

After receiving raw reads from a high throughput sequencing centre it is essential to check their quality. FastQC provides a simple way to do some quality control check on raw sequence data. It provides a modular set of analyses which you can use to get a quick impression of whether your data has any problems of which you should be aware before doing any further analysis.

Change into the 2_fastqc directory. Use pwd to check if you are standing in the correct directory.

sh
cd ../2_fastqc
pwd
/proj/snic2022-22-1124/nobackup/username/rnaseq/2_fastqc

Load Uppmax modules bioinfo-tools and FastQC FastQC/0.11.9.

sh
module load bioinfo-tools
module load FastQC/0.11.9

Once the module is loaded, FastQC program is available through the command fastqc. Use fastqc --help to see the various parameters available to the program. We will use -o to specify the output directory path and finally, the name of the input fastq file to analyse. The syntax to run one file will look like below.

Don’t run this. It’s just a template.

sh
fastqc -o . ../1_raw/filename.fq.gz

Based on the above command, we will write a bash loop script to process all fastq files in the directory. Writing multi-line commands through the terminal can be a pain. Therefore, we will run larger scripts from a bash script file. Move to your scripts directory and create a new file named fastqc.sh.

sh
cd ../scripts
pwd
/proj/snic2022-22-1124/nobackup/username/rnaseq/scripts

The command below creates a new file in the current directory.

sh
touch fastqc.sh

Use a text editor (nano,Emacs,gedit etc.) to edit fastqc.sh.

gedit behaves like a regular text editor with a standard graphical interface.

sh
gedit fastqc.sh &

Adding & at the end sends that process to the background, so that the console is free to accept new commands.

Then add the lines below and save the file.

sh
#!/bin/bash

module load bioinfo-tools
module load FastQC/0.11.9

for i in ../1_raw/*.gz
do
    echo "Running $i ..."
    fastqc -o . "$i"
done

This script loops through all files ending in .gz. In each iteration of the loop, it executes fastqc on the file. The -o . flag to fastqc indicates that the output must be exported in this current directory (ie; the directory where this script is run).

Change to the 2_fastqc directory. Use pwd to check if you are standing in the correct directory. Run the script file fastqc.sh

sh
cd ../2_fastqc
pwd
/proj/snic2022-22-1124/nobackup/username/rnaseq/2_fastqc
sh
bash ../scripts/fastqc.sh

After the fastqc run, there should be a .zip file and a .html file for every fastq file. The .html file is the report that you need. Download the .html files to your computer and open them in a web browser. You do not need to necessarily look at all files now. We will do a comparison with all samples when using the MultiQC tool.

Run this step in a LOCAL terminal and NOT on Uppmax. Open a terminal locally on your computer, move to a suitable download directory and run the command below to download one html report.

Remember to replace username (twice).

sh
scp username@rackham.uppmax.uu.se:/proj/snic2022-22-1124/nobackup/username/rnaseq/2_fastqc/SRR3222409-19_1_fastqc.html .

or download the whole directory.

sh
scp -r username@rackham.uppmax.uu.se:/proj/snic2022-22-1124/nobackup/username/rnaseq/2_fastqc .

Downloading using a GUI

You can optionally use an SFTP browser like Filezilla or Cyberduck for a GUI interface. Those using MobaXterm, it has an embedded SFTP file browser to drag and drop.

Go back to the FastQC website and compare your report with the sample report for Good Illumina data and Bad Illumina data.

Discuss based on your reports, whether your data is of good enough quality and/or what steps are needed to fix it.

3.3 HISAT2

Mapping reads using HISAT2

After verifying that the quality of the raw sequencing reads is acceptable, we will map the reads to the reference genome. There are many mappers/aligners available, so it may be good to choose one that is adequate for your type of data. Here, we will use a software called HISAT2 (Hierarchical Indexing for Spliced Alignment of Transcripts) as it is a good general purpose splice-aware aligner. It is fast and does not require a lot of RAM. Before we begin mapping, we need to obtain genome reference sequence (.fasta file) and build an aligner index. Due to time constraints, we will build an index only on chromosome 19.

3.3.1 Get reference

It is best if the reference genome (.fasta) and annotation (.gtf) files come from the same source to avoid potential naming conventions problems. It is also good to check in the manual of the aligner you use for hints on what type of files are needed to do the mapping. We will not be using the annotation (.gtf) during mapping, but we will use it during quantification.

What is the idea behind building an aligner index? What files are needed to build one? Where do we take them from? Could one use an index that was generated for another project? Check out the HISAT2 manual indexer section for answers. Browse through Ensembl and try to find the files needed. Note that we are working with Mouse (Mus musculus).

Move into the reference directory and download the Chr 19 genome (.fasta) file and the genome-wide annotation file (.gtf) from Ensembl.

You should be standing here to run this:

/proj/snic2022-22-1124/nobackup/username/rnaseq/reference

You are most likely to use the latest version of ensembl release genome and annotations when starting a new analysis. For this exercise, we will choose ensembl version 99.

sh
wget ftp://ftp.ensembl.org/pub/release-99/fasta/mus_musculus/dna/Mus_musculus.GRCm38.dna.chromosome.19.fa.gz
wget ftp://ftp.ensembl.org/pub/release-99/gtf/mus_musculus/Mus_musculus.GRCm38.99.gtf.gz

Decompress the files for use.

sh
gunzip Mus_musculus.GRCm38.dna.chromosome.19.fa.gz
gunzip Mus_musculus.GRCm38.99.gtf.gz

From the full gtf file, we will also extract chr 19 alone to create a new gtf file for use later.

sh
cat Mus_musculus.GRCm38.99.gtf | grep -E "^#|^19" > Mus_musculus.GRCm38.99-19.gtf

The grep command is set to use regular expression with the -E argument. And it’s looking for lines starting with # or 19. # fetches the header and comments while 19 denotes all rows with annotations for chromosome 19.

Check what you have in your directory.

sh
ls -l
output
drwxrwsr-x 2 user gXXXXXXX 4.0K Jan 22 21:59 mouse_chr19_hisat2
-rw-rw-r-- 1 user gXXXXXXX  26M Jan 22 22:46 Mus_musculus.GRCm38.99-19.gtf
-rw-rw-r-- 1 user gXXXXXXX 771M Jan 22 22:10 Mus_musculus.GRCm38.99.gtf
-rw-rw-r-- 1 user gXXXXXXX  60M Jan 22 22:10 Mus_musculus.GRCm38.dna.chromosome.19.fa

3.3.2 Build index

Move into the reference directory if not already there. Load module HISAT2. Remember to load bioinfo-tools if you haven’t done so already.

sh
module load bioinfo-tools
module load HISAT2/2.1.0

To search for the tool or other versions of a tool, use module spider hisat.

Create a new bash script in your scripts directory named hisat2_index.sh and add the following lines:

sh
#!/bin/bash

# load module
module load bioinfo-tools
module load HISAT2/2.1.0

hisat2-build \
  -p 1 \
  Mus_musculus.GRCm38.dna.chromosome.19.fa \
  mouse_chr19_hisat2/mouse_chr19_hisat2

The above script builds a HISAT2 index using the command hisat2-build. It should use 1 core for computation. The paths to the FASTA (.fa) genome file is specified. And the output path is specified. The output describes the output directory and the prefix for output files. The output directory must be present before running this script. Check hisat2-build --help for the arguments and descriptions.

Use pwd to check if you are standing in the correct directory. Then, run the script from the reference directory.

sh
bash ../scripts/hisat2_index.sh

Once the indexing is complete, move into the mouse_chr19_hisat2 directory and make sure you have all the files.

sh
ls -l mouse_chr19_hisat2/
output
-rw-rw-r-- 1 user gXXXXXXX 23M Sep 19 12:30 mouse_chr19_hisat2.1.ht2
-rw-rw-r-- 1 user gXXXXXXX 14M Sep 19 12:30 mouse_chr19_hisat2.2.ht2
-rw-rw-r-- 1 user gXXXXXXX  53 Sep 19 12:29 mouse_chr19_hisat2.3.ht2
-rw-rw-r-- 1 user gXXXXXXX 14M Sep 19 12:29 mouse_chr19_hisat2.4.ht2
-rw-rw-r-- 1 user gXXXXXXX 25M Sep 19 12:30 mouse_chr19_hisat2.5.ht2
-rw-rw-r-- 1 user gXXXXXXX 15M Sep 19 12:30 mouse_chr19_hisat2.6.ht2
-rw-rw-r-- 1 user gXXXXXXX  12 Sep 19 12:29 mouse_chr19_hisat2.7.ht2
-rw-rw-r-- 1 user gXXXXXXX   8 Sep 19 12:29 mouse_chr19_hisat2.8.ht2

The index for the whole genome would be created in a similar manner. It just requires more time to run.

3.3.3 Map reads

Now that we have the index ready, we are ready to map reads. Move to the directory 3_mapping. Use pwd to check if you are standing in the correct directory.

You should be standing here to run this:

/proj/snic2022-22-1124/nobackup/username/rnaseq/3_mapping

We will create softlinks to the fastq files from here to make things easier.

sh
cd 3_mapping
ln -s ../1_raw/* .

These are the parameters that we want to specify for the mapping run:

  • Specify the number of threads
  • Specify the full genome index path
  • Specify a summary file
  • Indicate read1 and read2 since we have paired-end reads
  • Direct the output (SAM) to a file

HISAT2 aligner arguments can be obtained by running hisat2 --help. We should end with a script that looks like below to run one of the samples.

sh
hisat2 \
  -p 1 \
  -x ../reference/mouse_chr19_hisat2/mouse_chr19_hisat2 \
  --summary-file "SRR3222409-19.summary" \
  -1 SRR3222409-19_1.fq.gz \
  -2 SRR3222409-19_2.fq.gz \
  -S SRR3222409-19.sam

Let’s break this down a bit. -p options denotes that it will use 1 thread. In a real world scenario, we might want to use 8 to 12 threads. -x denotes the full path (with prefix) to the aligner index we built in the previous step. --summary-file specifies a summary file to write alignments metrics such as mapping rate etc. -1 and -2 specifies the input fastq files. Both are used here because this is a paired-end sequencing. -S denotes the output SAM file.

But, we will not run it as above. We will make some more changes to it. We want to make the following changes:

  • Rather than writing the output as a SAM file, we want to direct the output to another tool samtools to order alignments by coordinate and to export in BAM format
  • Generalise the above script to be used as a bash script to read any two input files and to automatically create the output filename.

Now create a new bash script file named hisat2_align.sh in your scripts directory and add the script below to it.

sh
#!/bin/bash

module load bioinfo-tools
module load HISAT2/2.1.0
module load samtools/1.8

# get output filename prefix
prefix=$( basename $1 | sed -E 's/_.+$//' )

hisat2 \
  -p 1 \
  -x ../reference/mouse_chr19_hisat2/mouse_chr19_hisat2 \
  --summary-file "${prefix}.summary" \
  -1 $1 \
  -2 $2 | samtools sort -O BAM > "${prefix}.bam"

In the above script, the two input fasta files are not hard coded, rather we use $1 and $2 because they will be passed in as arguments.

The output filename prefix is automatically created using this line prefix=$( basename $1 | sed -E 's/_.+$//' ) from input filename of $1. For example, a file with path /bla/bla/sample_1.fq.gz will have the directory stripped off using the function basename to get sample_1.fq.gz. This is piped (|) to sed where all text starting from _ to end of string (specified by this regular expression _.+$ matching _1.fq.gz) is removed and the prefix will be just sample. This approach will work only if your filenames are labelled suitably.

Lastly, the SAM output is piped (|) to the tool samtools for sorting and written in BAM format.

Now we can run the bash script like below while standing in the 3_mapping directory.

sh
bash ../scripts/hisat2_align.sh sample_1.fq.gz sample_2.fq.gz

Similarly run the other samples.

Optional

Try to create a new bash loop script (hisat2_align_batch.sh) to iterate over all fastq files in the directory and run the mapping using the hisat2_align.sh script. Note that there is a bit of a tricky issue here. You need to use two fastq files (_1 and _2) per run rather than one file. There are many ways to do this and here is one.

sh
## find only files for read 1 and extract the sample name
lines=$(find *_1.fq.gz | sed "s/_1.fq.gz//")

for i in ${lines}
do
  ## use the sample name and add suffix (_1.fq.gz or _2.fq.gz)
  echo "Mapping ${i}_1.fq.gz and ${i}_2.fq.gz ..."
  bash ../scripts/hisat2_align.sh ${i}_1.fq.gz ${i}_2.fq.gz
done

Run the hisat2_align_batch.sh script in the 3_mapping directory.

sh
bash ../scripts/hisat2_align_batch.sh

At the end of the mapping jobs, you should have the following list of output files for every sample:

sh
ls -l
output
-rw-rw-r-- 1 user gXXXXXXX 16M Sep 19 12:30 SRR3222409-19.bam
-rw-rw-r-- 1 user gXXXXXXX 604 Sep 19 12:30 SRR3222409-19.summary

The .bam file contains the alignment of all reads to the reference genome in binary format. BAM files are not human readable directly. To view a BAM file in text format, you can use samtools view functionality.

sh
module load samtools/1.8
samtools view SRR3222409-19.bam | head
output
SRR3222409.13658290 163 19  3084385 60  95M3S   =   3084404 120 CTTTAAGATAAGTGCCGGTTGCAGCCAGCTGTGAGAGCTGCACTCCCTTCTCTGCTCTAAAGTTCCCTCTTCTCAGAAGGTGGCACCACCCTGAGCTG  DB@D@GCHHHEFHIIG<CHHHIHHIIIIHHHIIIIGHIIIIIFHIGHIHIHIIHIIHIHIIHHHHIIIIIIHFFHHIIIGCCCHHHH1GHHIIHHIII  AS:i:-3 ZS:i:-18    XN:i:0  XM:i:0  XO:i:0  XG:i:0  NM:i:0  MD:Z:95 YS:i:-6 YT:Z:CP NH:i:1
SRR3222409.13658290 83  19  3084404 60  101M    =   3084385 -120    TGCAGCCAGCTGTGAGAGCTGCACTCCCTTCTCTGCTCTAAAGTTCCCTCTTCTCAGAAGGTGGCACCACCCTGAGCTGCTGGCAGTGAGTCTGTTCCAAG   IIIIHECHHH?IHHHIIIHIHIIIHEHHHCHHHIHIIIHHIHIIIHHHHHHIHEHIIHIIHHIIHHIHHIGHIGIIIIIIIHHIIIHHIHEHCHHG@<<BD   AS:i:-6 ZS:i:-16    XN:i:0  XM:i:1  XO:i:0  XG:i:0  NM:i:1  MD:Z:76T24  YS:i:-3 YT:Z:CP NH:i:1
SRR3222409.13741570 163 19  3085066 60  15M2I84M    =   3085166 201 ATAGTACCTGGCAACAAAAAAAAAAAAGCTTTTGGCTAAAGACCAATGTGTTTAAGAGATAAAAAAAGGGGTGCTAATACAGAAGCTGAGGCCTTAGAAGA   0B@DB@HCCH1<<CGECCCGCHHIDD?01<<G1</<1<FH1F11<1111<<<<11<CGC1<G1<F//DHHI0/01<<1FG11111111<111<1D1<1D1<   AS:i:-20    XN:i:0  XM:i:3  XO:i:1  XG:i:2  NM:i:5  MD:Z:40T19C27T10    YS:i:0  YT:Z:CP NH:i:1

Can you identify what some of these columns are? SAM format description is available here. SAM output specifically from HISAT is described here, especially the tags.

The summary file gives a summary of the mapping run. This file is used by MultiQC later to collect mapping statistics. Inspect one of the mapping log files to identify the number of uniquely mapped reads and multi-mapped reads.

sh
cat SRR3222409-19.summary
output
156992 reads; of these:
  156992 (100.00%) were paired; of these:
    7984 (5.09%) aligned concordantly 0 times
    147178 (93.75%) aligned concordantly exactly 1 time
    1830 (1.17%) aligned concordantly >1 times
    ----
    7984 pairs aligned concordantly 0 times; of these:
      690 (8.64%) aligned discordantly 1 time
    ----
    7294 pairs aligned 0 times concordantly or discordantly; of these:
      14588 mates make up the pairs; of these:
        5987 (41.04%) aligned 0 times
        4085 (28.00%) aligned exactly 1 time
        4516 (30.96%) aligned >1 times
98.09% overall alignment rate

Next, we need to index these BAM files. Indexing creates .bam.bai files which are required by many downstream programs to quickly and efficiently locate reads anywhere in the BAM file.

Index all BAM files. Write a for-loop to index all BAM files using the command samtools index file.bam.

sh
module load samtools/1.8

for i in *.bam
  do
    echo "Indexing $i ..."
    samtools index $i
  done

Now, we should have .bai index files for all BAM files.

sh
ls -l
output
-rw-rw-r-- 1 user gXXXXXXX 16M Sep 19 12:30 SRR3222409-19.bam
-rw-rw-r-- 1 user gXXXXXXX 43K Sep 19 12:32 SRR3222409-19.bam.bai

If you are running short of time or unable to run the mapping, you can copy over results for all samples that have been prepared for you before class. They are available at this location: /sw/courses/ngsintro/rnaseq/main/3_mapping/.

sh
cp -r /sw/courses/ngsintro/rnaseq/main/3_mapping/* /proj/snic2022-22-1124/nobackup/username/rnaseq/3_mapping/


3.4 QualiMap

Post-alignment QC using QualiMap

Some important quality aspects, such as saturation of sequencing depth, read distribution between different genomic features or coverage uniformity along transcripts, can be measured only after mapping reads to the reference genome. One of the tools to perform this post-alignment quality control is QualiMap. QualiMap examines sequencing alignment data in SAM/BAM files according to the features of the mapped reads and provides an overall view of the data that helps to the detect biases in the sequencing and/or mapping of the data and eases decision-making for further analysis.

There are other tools with similar functionality such as RNASeqQC or QoRTs.

Read through QualiMap documentation and see if you can figure it out how to run it to assess post-alignment quality on the RNA-seq mapped samples.

Load the QualiMap module version 2.2.1 and create a bash script named qualimap.sh in your scripts directory.

Add the following script to it. Note that we are using the smaller GTF file with chr19 only.

sh
#!/bin/bash

# load modules
module load bioinfo-tools
module load QualiMap/2.2.1

# get output filename prefix
prefix=$( basename "$1" .bam)

unset DISPLAY

qualimap rnaseq -pe \
  -bam $1 \
  -gtf "../reference/Mus_musculus.GRCm38.99-19.gtf" \
  -outdir "../4_qualimap/${prefix}/" \
  -outfile "$prefix" \
  -outformat "HTML" \
  --java-mem-size=6G >& "${prefix}-qualimap.log"

The line prefix=$( basename "$1" .bam) is used to remove directory path and .bam from the input filename and create a prefix which will be used to label output. The export unset DISPLAY forces a ‘headless mode’ on the JAVA application, which would otherwise throw an error about X11 display. If that doesn’t work, one can also try export DISPLAY=:0 or export DISPLAY="". The last part >& "${prefix}-qualimap.log" saves the standard-out as a log file.

Create a new bash loop script named qualimap_batch.sh with a bash loop to run the qualimap script over all BAM files. The loop should look like below.

sh
for i in ../3_mapping/*.bam
do
    echo "Running QualiMap on $i ..."
    bash ../scripts/qualimap.sh $i
done

Run the loop script qualimap_batch.sh in the directory 4_qualimap.

sh
bash ../scripts/qualimap_batch.sh

Qualimap should have created a directory for every BAM file.

output
drwxrwsr-x 5 user gXXXXXXX 4.0K Jan 22 22:53 SRR3222409-19
-rw-rw-r-- 1 user gXXXXXXX  669 Jan 22 22:53 SRR3222409-19-qualimap.log

Inside every directory, you should see:

sh
ls -l
output
drwxrwsr-x 2 user gXXXXXXX 4.0K Jan 22 22:53 css
drwxrwsr-x 2 user gXXXXXXX 4.0K Jan 22 22:53 images_qualimapReport
-rw-rw-r-- 1 user gXXXXXXX  12K Jan 22 22:53 qualimapReport.html
drwxrwsr-x 2 user gXXXXXXX 4.0K Jan 22 22:53 raw_data_qualimapReport
-rw-rw-r-- 1 user gXXXXXXX 1.2K Jan 22 22:53 rnaseq_qc_results.txt

Download the results.

When downloading the HTML files, note that you MUST also download the dependency files (ie; css folder and images_qualimapReport folder), otherwise the HTML file may not render correctly. Remember to replace username (twice).

sh
scp -r username@rackham.uppmax.uu.se:/proj/snic2022-22-1124/nobackup/username/rnaseq/4_qualimap .

Check the QualiMap report for one sample and discuss if the sample is of good quality. You only need to do this for one file now. We will do a comparison with all samples when using the MultiQC tool.

If you are running out of time or were unable to run QualiMap, you can also copy pre-run QualiMap output from this location: /sw/courses/ngsintro/rnaseq/main/4_qualimap/.

sh
cp -r /sw/courses/ngsintro/rnaseq/main/4_qualimap/* /proj/snic2022-22-1124/nobackup/username/rnaseq/4_qualimap/


3.5 featureCounts

Counting mapped reads using featureCounts

After ensuring mapping quality, we can move on to enumerating reads mapping to genomic features of interest. Here we will use featureCounts, an ultrafast and accurate read summarisation program, that can count mapped reads for genomic features such as genes, exons, promoter, gene bodies, genomic bins and chromosomal locations.

Read featureCounts documentation and see if you can figure it out how to use paired-end reads using an unstranded library to count fragments overlapping with exonic regions and summarise over genes.

Load the subread module on Uppmax. Create a bash script named featurecounts.sh in the directory scripts.

We could run featureCounts on each BAM file, produce a text output for each sample and combine the output. But the easier way is to provide a list of all BAM files and featureCounts will combine counts for all samples into one text file.

Below is the script that we will use:

sh
#!/bin/bash

# load modules
module load bioinfo-tools
module load subread/2.0.0

featureCounts \
  -a "../reference/Mus_musculus.GRCm38.99.gtf" \
  -o "counts.txt" \
  -F "GTF" \
  -t "exon" \
  -g "gene_id" \
  -p \
  -s 0 \
  -T 1 \
  ../3_mapping/*.bam

In the above script, we indicate the path of the annotation file (-a "../reference/Mus_musculus.GRCm38.99.gtf"), specify the output file name (-o "counts.txt"), specify that that annotation file is in GTF format (-F "GTF"), specify that reads are to be counted over exonic features (-t "exon") and summarised to the gene level (-g "gene_id"). We also specify that the reads are paired-end (-p), the library is unstranded (-s 0) and the number of threads to use (-T 1).

Run the featurecounts bash script in the directory 5_dge. Use pwd to check if you are standing in the correct directory.

You should be standing here to run this:

/proj/snic2022-22-1124/nobackup/username/rnaseq/5_dge

sh
bash ../scripts/featurecounts.sh

You should have two output files:

sh
ls -l
output
-rw-rw-r-- 1 user gXXXXXXX 2.8M Sep 15 11:05 counts.txt
-rw-rw-r-- 1 user gXXXXXXX  658 Sep 15 11:05 counts.txt.summary

Inspect the files and try to make sense of them.

Important

For downstream steps, we will NOT use this counts.txt file. Instead we will use counts_full.txt from the back-up folder. This contains counts across all chromosomes. This is located here: /sw/courses/ngsintro/rnaseq/main/5_dge/. Copy this file to your 5_dge directory.

Remember to replace username.

sh
cp /sw/courses/ngsintro/rnaseq/main/5_dge/counts_full.txt /proj/snic2022-22-1124/nobackup/username/rnaseq/5_dge/


3.6 MultiQC

Combined QC report using MultiQC

We will use the tool MultiQC to crawl through the output, log files etc from FastQC, HISAT2, QualiMap and featureCounts to create a combined QC report.

Move to the 6_multiqc directory. You should be standing here to run this:

/proj/snic2022-22-1124/nobackup/username/rnaseq/6_multiqc

And run this in the terminal.

sh
module load bioinfo-tools
module load MultiQC/1.11

multiqc --interactive ../
output
  /// MultiQC 🔍 | v1.11

|           multiqc | Search path : /crex/proj/XXXXXXX/nobackup/username/rnaseq
|         searching | ━━━━━━━━━━━━━━━━━━━━━━━━━━━━━━━━━━━━━━━━ 100% 298/298  
|          qualimap | Found 6 RNASeq reports
|    feature_counts | Found 6 reports
|           bowtie2 | Found 6 reports
|            fastqc | Found 12 reports
|           multiqc | Compressing plot data
|           multiqc | Report      : multiqc_report.html
|           multiqc | Data        : multiqc_data
|           multiqc | MultiQC complete

The output should look like below:

sh
ls -l
output
drwxrwsr-x 2 user gXXXXXXX 4.0K Sep  6 22:33 multiqc_data
-rw-rw-r-- 1 user gXXXXXXX 1.3M Sep  6 22:33 multiqc_report.html

Download the MultiQC HTML report to your computer and inspect the report.

Run this step in a LOCAL terminal and NOT on Uppmax. Remember to replace username (twice).

sh
scp username@rackham.uppmax.uu.se:/proj/snic2022-22-1124/nobackup/username/rnaseq/6_multiqc/multiqc_report.html .


3.7 DESeq2

Differential gene expression using DESeq2

The easiest way to perform differential expression is to use one of the statistical packages, within R environment, that were specifically designed for analyses of read counts arising from RNA-seq, SAGE and similar technologies. Here, we will use one such package called DESeq2. Learning R is beyond the scope of this course so we prepared basic ready to run R scripts to find DE genes between conditions KO and Wt.

Move to the 5_dge directory and load R modules for use.

sh
module load R/4.0.0
module load R_packages/4.0.0

Use pwd to check if you are standing in the correct directory. Copy the following file to the 5_dge directory: /sw/courses/ngsintro/rnaseq/main/5_dge/dge.R

Make sure you have the counts_full.txt. If not, you can copy this file too: /sw/courses/ngsintro/rnaseq/main/5_dge/counts_full.txt

sh
cp /sw/courses/ngsintro/rnaseq/main/5_dge/dge.R .
cp /sw/courses/ngsintro/rnaseq/main/5_dge/counts_full.txt .

Now, run the R script from the schell in 5_dge directory.

sh
Rscript dge.R

If you are curious what’s inside dge.R, you are welcome to explore it using a text editor.

This should have produced the following output files:

sh
ls -l
output
-rw-rw-r-- 1 user gXXXXXXX 282K Jan 22 23:16 counts_vst_full.Rds
-rw-rw-r-- 1 user gXXXXXXX 1.7M Jan 22 23:16 counts_vst_full.txt
-rw-rw-r-- 1 user gXXXXXXX 727K Jan 22 23:16 dge_results_full.Rds
-rw-rw-r-- 1 user gXXXXXXX 1.7M Jan 22 23:16 dge_results_full.txt

Essentially, we have two outputs: dge_results_full and counts_vst_full. dge_results_full is the list of differentially expressed genes. This is available in human readable tab-delimited .txt file and R readable binary .Rds file. The counts_vst_full is variance-stabilised normalised counts, useful for exploratory analyses.

Copy the results text file (dge_results_full.txt) to your computer and inspect the results. What are the columns? How many differentially expressed genes are present after adjusted p-value of 0.05? How many genes are upregulated and how many are down-regulated? How does this change if we set a fold-change cut-off of 1?

Open in a spreadsheet editor like Microsoft Excel or LibreOffice Calc.

If you do not have the results or were unable to run the DGE step, you can copy these two here which will be required for functional annotation (optional).

sh
cp /sw/courses/ngsintro/rnaseq/main/5_dge/dge_results_full.txt .
cp /sw/courses/ngsintro/rnaseq/main/5_dge/dge_results_full.Rds .
cp /sw/courses/ngsintro/rnaseq/main/5_dge/counts_vst_full.txt .
cp /sw/courses/ngsintro/rnaseq/main/5_dge/counts_vst_full.Rds .

4 Bonus exercises

These exercises are optional and to be run only if you have time and if it interests you.

4.1 Functional annotation

In this part of the exercise we will address the question which biological processes are affected in the experiment; in other words we will functionally annotate the results of the analysis of differential gene expression (performed in the main part of the exercise). We will use Gene Ontology (GO) and Reactome databases.

When performing this type of analysis, one has to keep in mind that the analysis is only as accurate as the annotation available for your organism. So, if working with non-model organisms which do have experimentally-validated annotations (computationally inferred), the results may not be fully reflecting the actual situation.

There are many methods to approach the question as to which biological processes and pathways are over-represented amongst the differentially expressed genes, compared to all the genes included in the DE analysis. They use several types of statistical tests (e.g. hypergeometric test, Fisher’s exact test etc.), and many have been developed with microarray data in mind. Not all of these methods are appropriate for RNA-seq data, which as you remember from the lecture, exhibit length bias in power of detection of differentially expressed genes (i.e. longer genes, which tend to gather more reads, are more likely to be detected as differentially expressed than shorter genes, solely because of the length).

We will use the R / Bioconductor package goseq, specifically designed to work with RNA-seq data. This package provides methods for performing Gene Ontology and pathway analysis of RNA-seq data, taking length bias into account.

In this part, we will use the same data as in the main workflow. The starting point of the exercise is the file with results of the differential expression produced in the main part of the exercise.

4.1.1 Preparation

Change to the funannot directory in your rnaseq directory.

sh
cd funannot

Copy this file /sw/courses/ngsintro/rnaseq/bonus/funannot/annotate_de_results.R to your rnaseq/funannot directory.

Remember to replace username.

sh
cp /sw/courses/ngsintro/rnaseq/bonus/funannot/annotate_de_results.R /proj/snic2022-22-1124/nobackup/username/rnaseq/funannot/

We need some annotation information, so we will copy this file /sw/courses/ngsintro/rnaseq/main/reference/mm-biomart99-genes.txt.gz to your rnaseq/reference directory.

sh
cp /sw/courses/ngsintro/rnaseq/main/reference/mm-biomart99-genes.txt.gz /proj/snic2022-22-1124/nobackup/username/rnaseq/reference/

Then uncompress the file. gunzip ../reference/mm-biomart99-genes.txt.gz

Load R module and R packages

sh
module load R/4.0.0
module load R_packages/4.0.0

Run the functional annotation script from the linux terminal.

sh
Rscript annotate_de_results.R

It will fetch dge_results_full.Rds from 5_dge/ and annotation files from reference/. When completed, you should find a directory named funannot_results.

sh
ls -l
output
-rw-rw-r-- 1 user gXXXXXXX 44K Jan 22 23:37 go_down.txt
-rw-rw-r-- 1 user gXXXXXXX 15K Jan 22 23:37 go_up.txt
-rw-rw-r-- 1 user gXXXXXXX 800 Jan 22 23:37 reactome_down.txt
-rw-rw-r-- 1 user gXXXXXXX 794 Jan 22 23:37 reactome_up.txt

4.1.2 Interpretation

The results are saved as tables in the directory funannot_results. There are four tables: GO terms for up-regulated genes (go_up.txt), GO terms for down-regulated genes (go_down.txt) and similarily, Reactome pathways for up-regulated genes (reactome_up.txt) and Reactome pathways for down-regulated genes (reactome_down.txt).

Take a quick look at some of these files.

sh
head go_down.txt

The columns of the results tables are:

output
# go
category over_represented_pvalue under_represented_pvalue numDEInCat numInCat term ontology
# reactome
category over_represented_pvalue under_represented_pvalue numDEInCat numInCat path_name

You can view the tables in a text editor (nano,gedit etc), and try to find GO terms and pathways relevant to the experiment using a word search functionality. You could download these files to your computer and import them into a spreadsheet program like MS Excel or LibreOffice Calc.

Try to use grep to find a match using a keyword, say phosphorylation.

sh
cat go_down.txt | grep "phosphorylation"

Have a look at the GO terms and see if you think the functional annotation reflects the biology of the experiments we have just analysed?

4.2 RNA-Seq plots

Creating high quality plots of RNA-seq analysis are most easily done using R. Depending on your proficiency in reading R code and using R, you can in this section either just call scripts from the command lines with a set of arguments or you can open the R script in a text editor, and run the code step by step from an interactive R session.

Copy the R script files from the following directory: /sw/courses/ngsintro/rnaseq/bonus/plots/ to your plots directory.

Remember to replace username.

sh
cp /sw/courses/ngsintro/rnaseq/bonus/plots/*.R /proj/snic2022-22-1124/nobackup/username/rnaseq/plots/

You should have the following files:

sh
ls -l
output
-rw-rw-r-- 1 user gXXXXXXX 2.0K Sep 20  2016 gene.R
-rw-rw-r-- 1 user gXXXXXXX  842 Sep 22  2016 heatmap.R
-rw-rw-r-- 1 user gXXXXXXX  282 Sep 22  2016 ma.R
-rw-rw-r-- 1 user gXXXXXXX  340 Sep 22  2016 pca.R
-rw-rw-r-- 1 user gXXXXXXX  669 Sep 22  2016 volcano.R

It is important that you load module R and R_packages.

sh
module load R/4.0.0
module load R_packages/4.0.0

4.2.1 PCA plot

A popular way to visualise general patterns of gene expression in your data is to produce either PCA (Principal Component Analysis) or MDS (Multi Dimensional Scaling) plots. These methods aim at summarising the main patterns of expression in the data and display them on a two-dimensional space and still retain as much information as possible. To properly evaluate these kind of results is non-trivial, but in the case of RNA-seq data we often use them to get an idea of the difference in expression between treatments and also to get an idea of the similarity among replicates. If the plots shows clear clusters of samples that corresponds to treatment it is an indication of treatment actually having an effect on gene expression. If the distance between replicates from a single treatment is very large it suggests large variance within the treatment, something that will influence the detection of differentially expressed genes between treatments.

Move to the plots/ directory. Then run the pca.R script like below.

sh
Rscript pca.R

This generates a file named pca.png in the plots folder. To view it, use eog pca.png & or copy it to your local disk.

Do samples cluster as expected? Are there any odd or mislabelled samples? Based on these results, would you expect to find a large number of significant DE genes?

4.2.2 MA plot

An MA-plot plots the mean expression and estimated log-fold-change for all genes in an analysis.

Run the ma.R script in the plots directory.

sh
Rscript ma.R

This generates a file named ma.png in the plots folder. To view it, use eog ma.png & or copy it to your local disk.

What do you think the blue dots represent?

4.2.3 Volcano plot

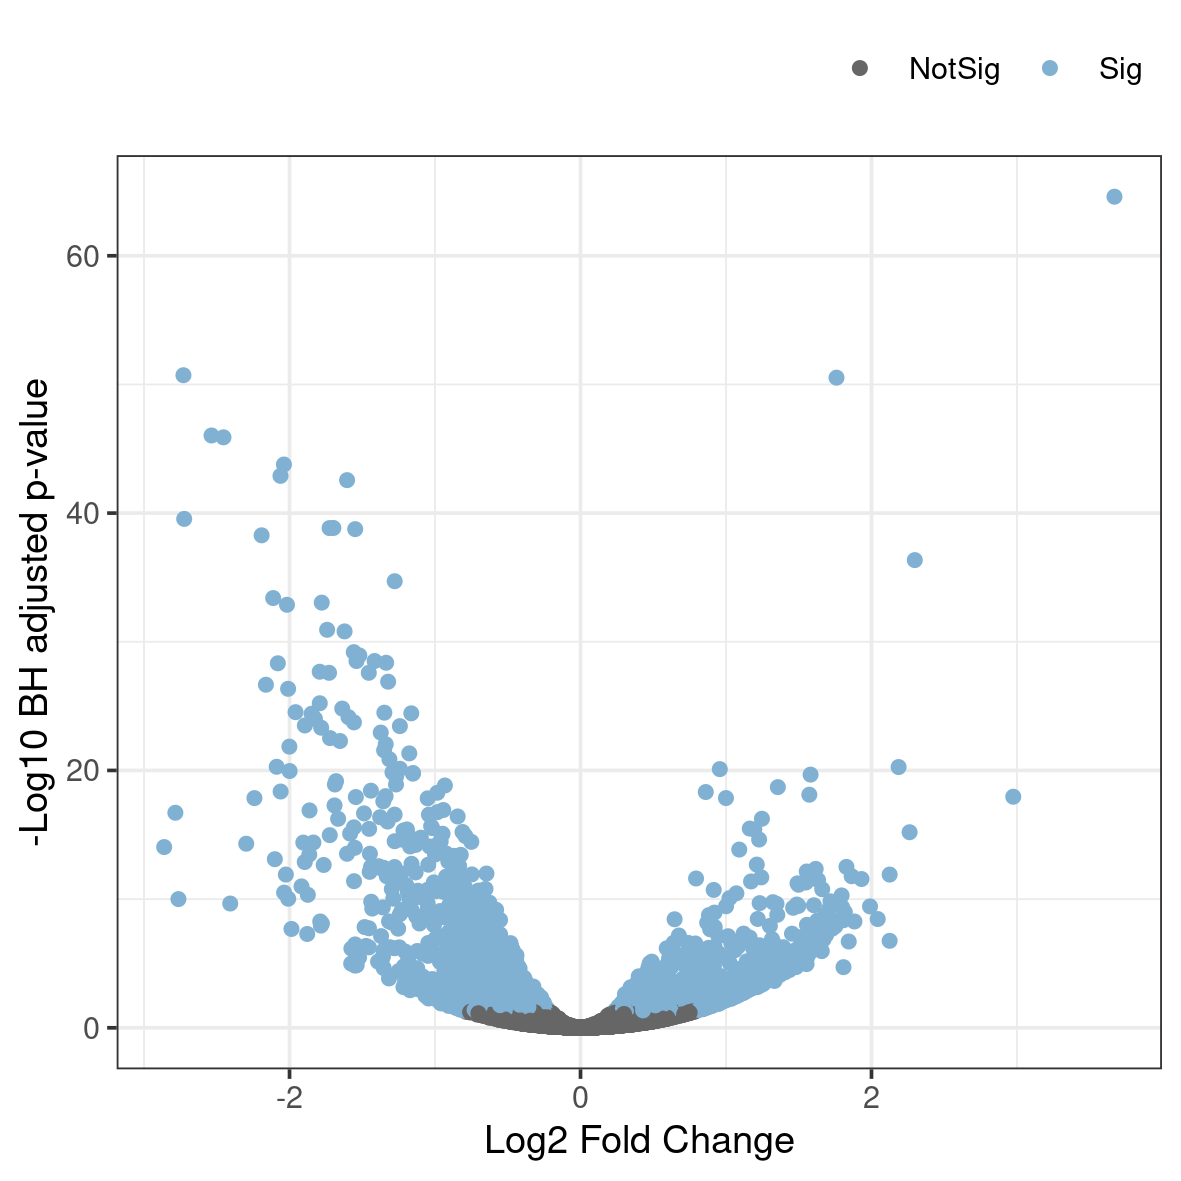
A related type of figure will instead plot fold change (on log2 scale) on the x-axis and -log10 p-value on the y-axis. Scaling like this means that genes with lowest p-value will be found at the top of the plot. In this example we will highlight (in blue) the genes that are significant (p-val 0.05 after correction for multiple testing).

Run the script named volcano.R in the plots directory.

sh
Rscript volcano.R

This generates a file named volcano.png in the plots folder. To view it, use eog volcano.png & or copy it to your local disk.

Anything noteworthy about the patterns in the plot? Is there a general trend in the direction of change in gene expression as a consequence of the experiment?

4.2.4 Heatmap

Another popular plots for genome-wide expression patterns is heatmap for a set of genes. If you run the script called heatmap.R, it will extract the top 50 genes that have the lowest p-value in the experiment and create a heatmap from these. In addition to color-coding the expression levels over samples for the genes it also clusters the samples and genes based on inferred distance between them.

Run the script named heatmap.R in the plots directory.

sh
Rscript heatmap.R

This generates a file named heatmap.png in the plots folder. To view it, use eog heatmap.png & or copy it to your local disk.

Compare this plot to a similar plot in the paper behind the data.

4.3 IGV browser

Data visualisation is important to be able to clearly convey results, but can also be very helpful as tool for identifying issues and note-worthy patterns in the data. In this part you will use the BAM files you created earlier in the RNA-seq lab and use IGV (Integrated Genomic Viewer) to visualise the mapped reads and genome annotations. In addition we will produce high quality plots of both the mapped read data and the results from differential gene expression.

If you are already familiar with IGV you can load the mouse genome and at least one BAM file from each of the treatments that you created earlier. The functionality of IGV is the same as if you look at genomic data, but there are a few of the features that are more interesting to use for RNA-seq data.

Integrated genomics viewer from Broad Institute is a nice graphical interface to view bam files and genome annotations. It also has tools to export data and some functionality to look at splicing patterns in RNA-seq data sets. Even though it allows for some basic types of analysis it should be used more as a nice way to look at your mapped data. Looking at data in this way might seem like a daunting approach as you can not check more than a few regions, but in in many cases it can reveal mapping patterns that are hard to catch with just summary statistics.

For this tutorial you can chose to run IGV directly on your own computer or on Uppmax . If you chose to run it on your own computer you will have to download some of the BAM files (and the corresponding index files) from Uppmax. If you have not yet installed IGV you also have to download the program.

Local

Copy two BAM files (one from each experimental group, for example; SRR3222409-19 and SRR3222412-19) and the associated index (.bam.bai) files to your computer by running the below command in a LOCAL terminal and NOT on Uppmax.

Remember to replace username.

sh
scp username@rackham.uppmax.uu.se:/proj/snic2022-22-1124/nobackup/username/rnaseq/3_mapping/SRR3222409-19.bam ./
scp username@rackham.uppmax.uu.se:/proj/snic2022-22-1124/nobackup/username/rnaseq/3_mapping/SRR3222409-19.bam.bai ./
scp username@rackham.uppmax.uu.se:/proj/snic2022-22-1124/nobackup/username/rnaseq/3_mapping/SRR3222412-19.bam ./
scp username@rackham.uppmax.uu.se:/proj/snic2022-22-1124/nobackup/username/rnaseq/3_mapping/SRR3222412-19.bam.bai ./

Alternatively, you can use an SFTP browser like Filezilla or Cyberduck for a GUI interface. Windows users can also use the MobaXterm SFTP file browser to drag and drop.

Uppmax

For Linux and Mac users, Log in to Uppmax in a way so that the generated graphics are exported via the network to your screen. This will allow any graphical interface that you start on your compute node to be exported to your computer. However, as the graphics are exported over the network, it can be fairly slow in redrawing windows and the experience can be fairly poor.

Login in to Uppmax with X-forwarding enabled:

sh
ssh -Y username@rackham.uppmax.uu.se
ssh -Y computenode

An alternative method is to login through Rackham-GUI. Once you log into this interface you will have a linux desktop interface in a browser window. This interface is running on the login node, so if you want to do any heavy lifting you need to login to your reserved compute node also here. This is done by opening a terminal in the running linux environment and log on to your compute node as before. NB! If you have no active reservation you have to do that first.

Load necessary modules and start IGV

sh
module load bioinfo-tools
module load IGV/2.8.13
igv-core

This should start the IGV so that it is visible on your screen. If not please try to reconnect to Uppmax or consider running IGV locally as that is often the fastest and most convenient solution.

Once we have the program running, you select the genome that you would like to load. Choose Mouse mm10. Note that if you are working with a genome that are not part of the available genomes in IGV, one can create genome files from within IGV. Please check the manual of IGV for more information on that.

To open your BAM files, go to File > Load from file... and select your BAM file and make sure that you have a .bai index for that BAM file in the same folder. You can repeat this and open multiple BAM files in the same window, which makes it easy to compare samples. Then select Chr19 since we only have data for that one chromosome.

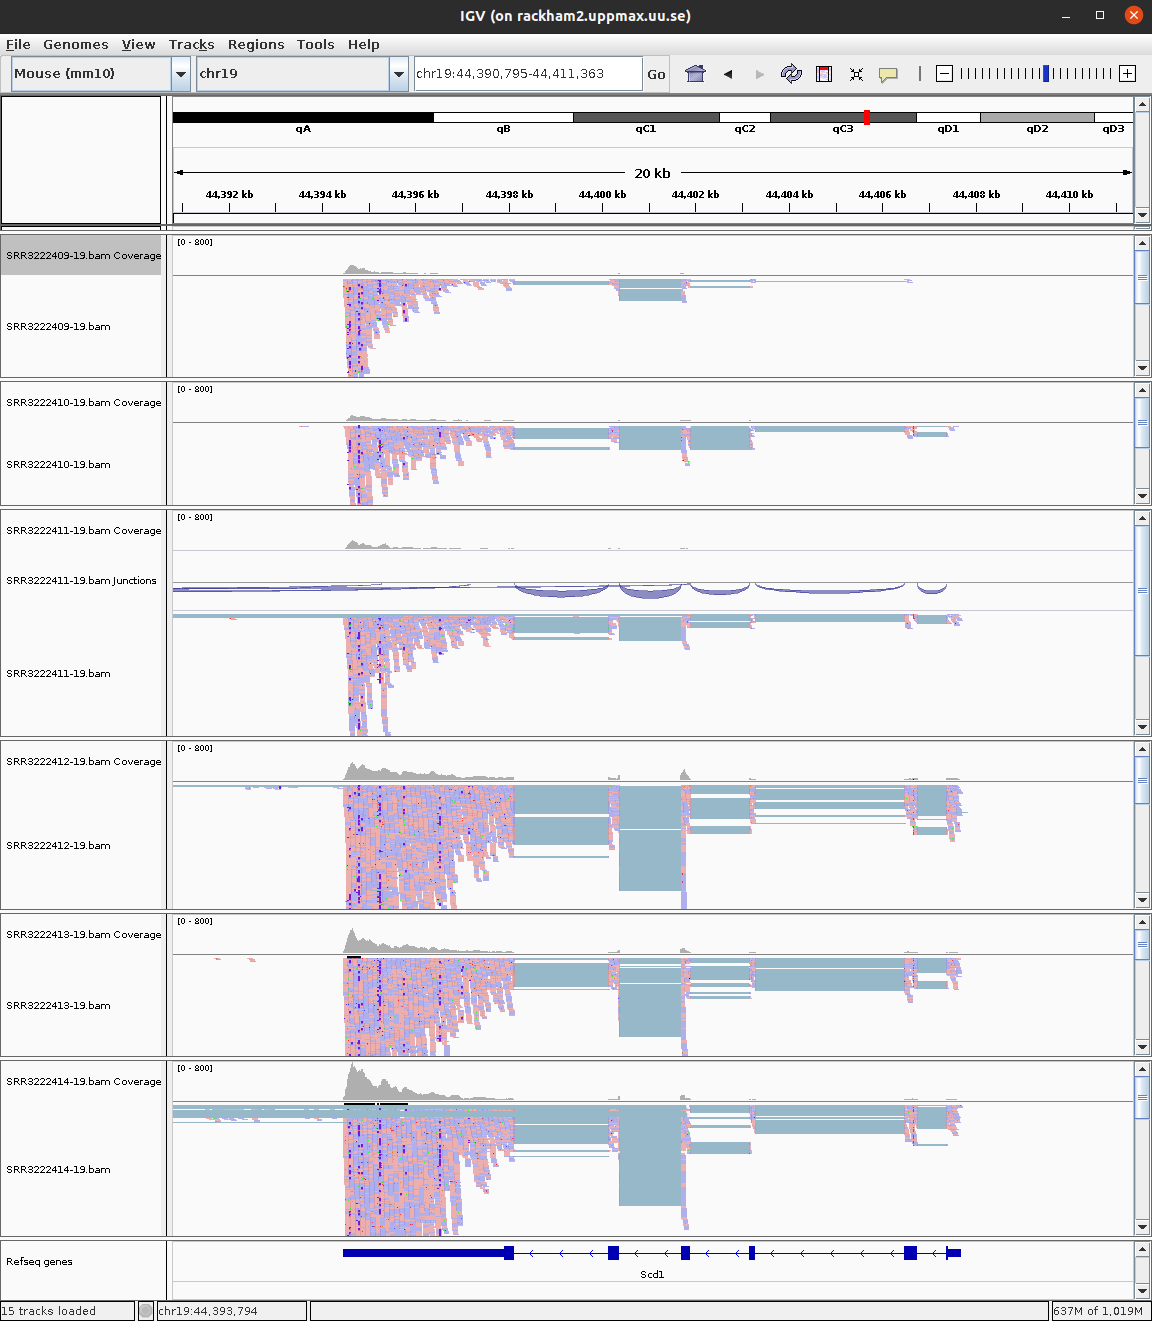
For every file you open a number of panels are opened that visualise the data in different ways. The first panel named Coverage summarises the coverage of base-pairs in the window you have zoomed to. The second panel shows the reads as they are mapped to the genome. If one right click with the mouse on the read panel there many options to group and color reads. The bottom panel named Refseq genes shows the gene models from the annotation.

To see actual reads you have to zoom in until the reads are drawn on screen. If you have a gene of interest you can also use the search box to directly go to that gene.

Here is the list of top 30 differentially expressed genes on Chr19 ordered by absolute fold change. The adjusted p value is shown as padj, the average expression of the gene is shown as baseMean.

      ensembl_gene_id external_gene_name    baseMean log2FoldChange         padj   gene_biotype
1  ENSMUSG00000117896           AA387883    59.94083     -2.7846887 1.943690e-17         lncRNA
2  ENSMUSG00000024799             Tm7sf2   947.63388     -2.0385744 1.677171e-44 protein_coding
3  ENSMUSG00000025172             Ankrd2    59.28633      1.7519899 1.261004e-08 protein_coding
4  ENSMUSG00000049134               Nrap   220.59983      1.6993887 1.067822e-08 protein_coding
5  ENSMUSG00000024935             Slc1a1    63.82987      1.6821634 1.652208e-09 protein_coding
6  ENSMUSG00000037071               Scd1  6678.59981     -1.4473717 2.961722e-14 protein_coding
7  ENSMUSG00000024665              Fads2  3269.79425     -1.4152150 3.134559e-29 protein_coding
8  ENSMUSG00000024747            Aldh1a7    65.81205     -1.3544431 1.002599e-06 protein_coding
9  ENSMUSG00000025216               Lbx1    26.03640      1.3356124 1.328372e-04 protein_coding
10 ENSMUSG00000056290             Ms4a4b    23.27050      1.3299845 5.015617e-05 protein_coding
11 ENSMUSG00000025221             Kcnip2    34.13675     -1.3165310 1.463369e-04 protein_coding
12 ENSMUSG00000032648               Pygm  1129.47092      1.2452572 2.736196e-04 protein_coding
13 ENSMUSG00000043639              Rbm20    51.36261      1.1816554 7.774718e-04 protein_coding
14 ENSMUSG00000118032            Gm50147    39.53043     -1.1797580 3.794393e-04         lncRNA
15 ENSMUSG00000036278            Macrod1   244.02353      1.0824415 4.984802e-07 protein_coding
16 ENSMUSG00000025203               Scd2 44054.03491     -1.0504733 1.874759e-11 protein_coding
17 ENSMUSG00000010663              Fads1  4074.38868     -1.0503935 1.470460e-18 protein_coding
18 ENSMUSG00000060675             Plaat3  5284.36470     -1.0462725 2.114719e-13 protein_coding
19 ENSMUSG00000016496              Cd274    35.91671      1.0175443 5.632932e-03 protein_coding
20 ENSMUSG00000024673              Ms4a1    25.80723      1.0130356 6.294275e-03 protein_coding
21 ENSMUSG00000032773              Chrm1    76.11444      0.9262597 7.665519e-04 protein_coding
22 ENSMUSG00000067279            Ppp1r3c   162.14777      0.9018589 3.672613e-04 protein_coding
23 ENSMUSG00000025013               Tll2   108.20333     -0.9012959 1.249858e-03 protein_coding
24 ENSMUSG00000006457              Actn3  1322.01659      0.8988003 1.352229e-02 protein_coding
25 ENSMUSG00000075289             Carns1  1003.91026     -0.8819988 4.982949e-10 protein_coding
26 ENSMUSG00000075010           AW112010    56.94897      0.8128744 4.027595e-02         lncRNA
27 ENSMUSG00000025227            Mfsd13a   107.55434     -0.8126676 1.107050e-03 protein_coding
28 ENSMUSG00000067242               Lgi1   506.42577     -0.7842945 2.570293e-06 protein_coding
29 ENSMUSG00000024812               Tjp2  1478.96029     -0.7627251 9.004722e-07 protein_coding
30 ENSMUSG00000047368            Abhd17b  1562.07350     -0.7625545 5.750875e-07 protein_coding

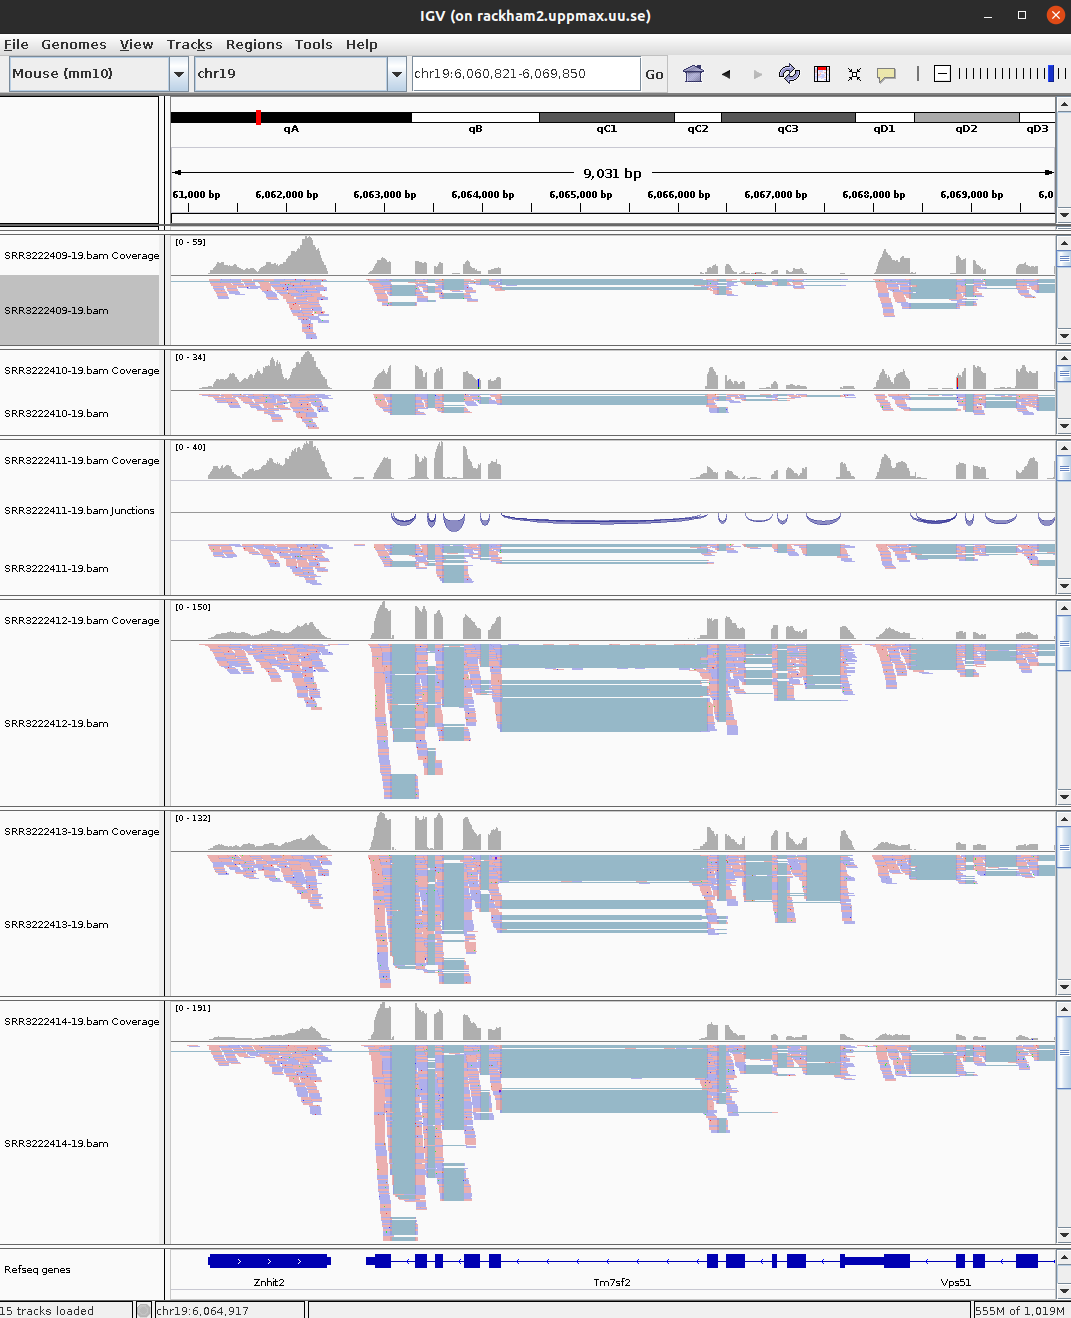
Have a look at few of the interesting genes on Chr19 using the external_gene_name identifier. Look into gene Tm7sf2 or Ankrd2. You might have to right-click and change option to Squished to see more reads.

Do you expect these genes to be differentially expressed?

To see some genes with large number of reads, see Scd1 or Scd2.

IGV view of gene Tm7sf2 across 6 samples.
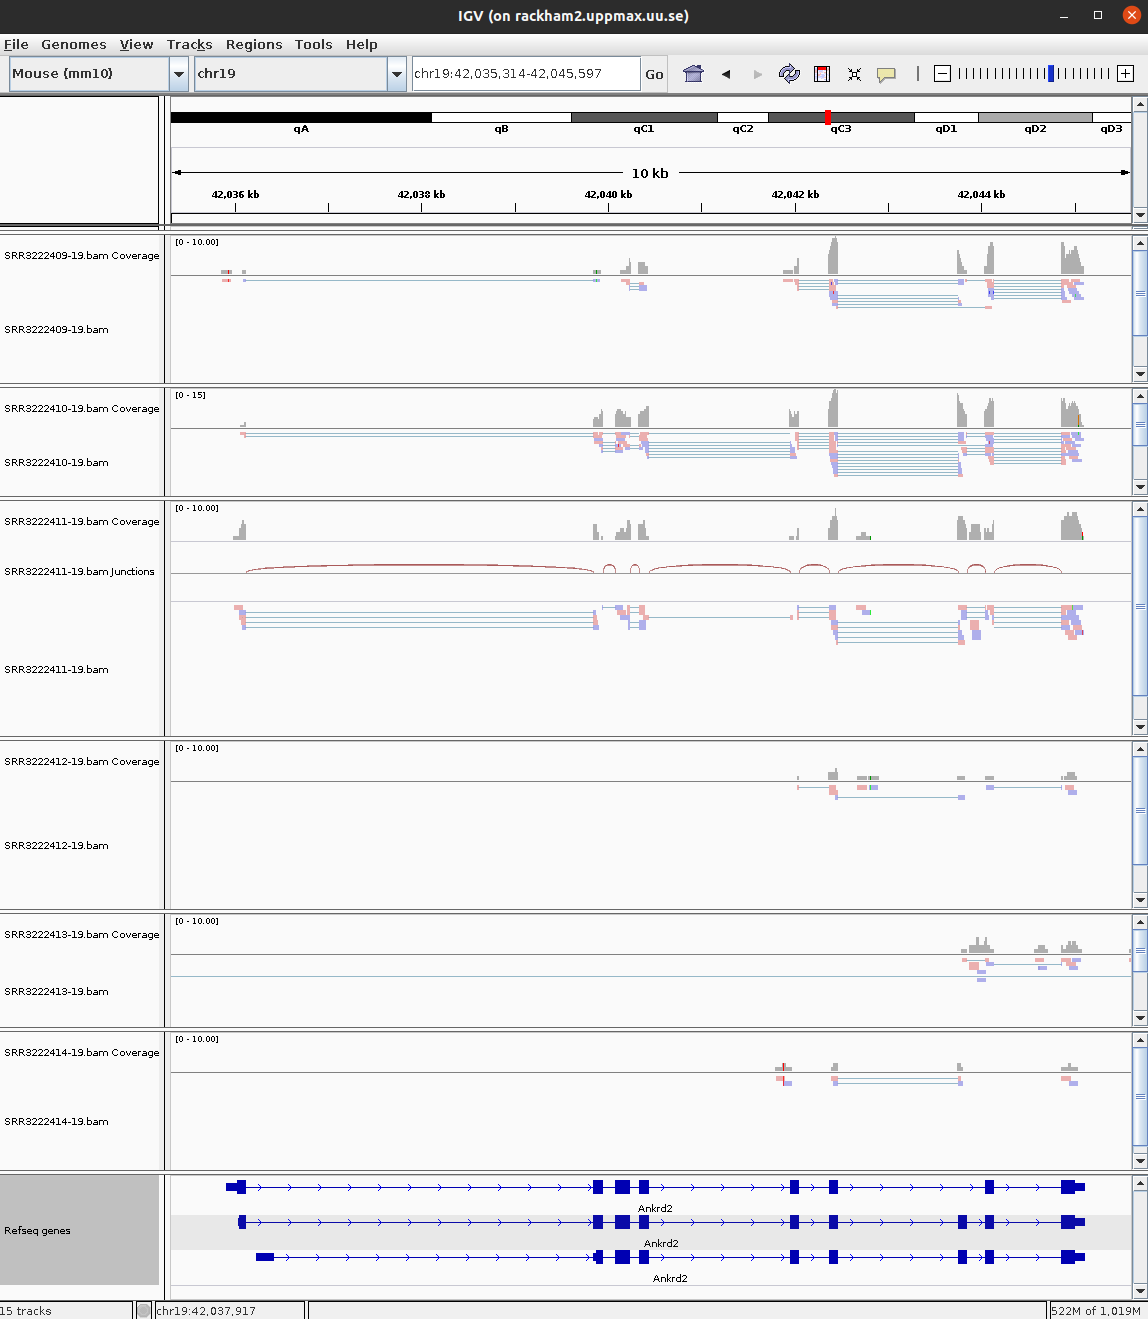
IGV view of gene Ankrd2 across 6 samples.

IGV view of gene Scd1 across 6 samples.

For more detailed information on the splice reads you can instead of just looking at the splice panel right click on the read panel and select Sashimi plots. This will open a new window showing in an easy readable fashion how reads are spliced in mapping and you will also be able to see that there are differences in between what locations reads are spliced. This hence gives some indication on the isoform usage of the gene.

Do you think the reads are from a stranded or unstranded library?

One can visualise all genes in a given pathway using the gene list option under Regions in the menu. If you need hints for how to proceed, see Gene List tutorial at Broad. But, we only have data from one chromosome, so this is not that useful now.

5 sbatch

You are not required to run anything practically in this section. This is just to read and understand.

We have throughout this tutorial written bash scripts and run them from the terminal directly. Remember that we are not running on the login node. We have pre-allocated resources, then logged in to a compute node to run tasks. This is called working interactively on Uppmax. This is fine for tutorials and testing purposes. But, if you were to actually work on Uppmax, you would follow a slightly different approach.

The standard workflow on Uppmax is to login to the login node and then submit tasks as jobs to something called a Slurm queue. We haven’t used this option, because it involves waiting for an unpredictable amount of time for your submitted job to execute. In this section, we will take a look at how to modify a standard bash script to work with Slurm job submission.

This is how our standard bash script for mapping looks like:

sh
#!/bin/bash

# load modules
module load bioinfo-tools
module load HISAT2/2.1.0
module load samtools/1.8

# create output filename prefix
prefix=$( basename "$1" | sed -E 's/_.+$//' )

hisat2 \
-p 8 \
-x ../reference/mouse_chr19_hisat2/mouse_chr19_hisat2 \
--summary-file "${prefix}.summary" \
-1 $1 \
-2 $2 | samtools sort -O BAM > "${prefix}.bam"

We add SBATCH commands to the above script. The new script looks like this:

sh
#!/bin/bash
#SBATCH -A snic2022-22-1124
#SBATCH -p core
#SBATCH -n 8
#SBATCH -t 3:00:00
#SBATCH -J hisat2-align

# load modules
module load bioinfo-tools
module load HISAT2/2.1.0
module load samtools/1.8

# create output filename prefix
prefix=$( basename "$1" | sed -E "s/_.+$//" )

hisat2 \
 -p 8 \
 -x ../reference/mouse_chr19_hisat2/mouse_chr19_hisat2 \
 --summary-file "${prefix}-summary.txt" \
 -1 $1 \
 -2 $2 | samtools sort -O BAM > "${prefix}.bam"

The SBATCH commands in the above script is specifying the account name to use resources from, the required number of cores, the time required for the job and a job name.

If you run this as a normal bash script like this ./hisat2_align.sh ... or bash ./hisat2_align.sh ..., the SBATCH comments have no effect (they are treated as comments) and the contents of the script will immediately start executing. But if you run this as script as sbatch ./hisat2_align.sh ..., the script is submitted as a job to the Uppmax Slurm queue. In this case, the SBATCH lines are interpreted and used by Slurm. At some point, your submitted job will reach the top of the queue and then the script will start to be executed.

You can check your jobs in the queue by running the following command.

sh
jobinfo -u user

And this gives a list like this:

output
CLUSTER: rackham
Running jobs:
   JOBID PARTITION   NAME USER        ACCOUNT ST          START_TIME  TIME_LEFT  NODES CPUS NODELIST(REASON)
 5006225      core (null) user       gXXXXXXX  R 2018-09-12T14:00:03      44:31      1    1 r169
 5006229      core (null) user       gXXXXXXX  R 2018-09-12T14:00:03      44:31      1    1 r169
 5006352      core (null) user       gXXXXXXX  R 2018-09-12T14:04:14      48:42      1    1 r178
 5006355      core (null) user       gXXXXXXX  R 2018-09-12T14:05:17      49:45      1    1 r169
 5006356      core (null) user       gXXXXXXX  R 2018-09-12T14:06:08      50:36      1    5 r179

If the job is pending, then you will see PD in the ST column. If your job is running, you should see R. Once your job starts running, you will see a file named slurm-XXXX.out in the directory in which you submitted the job. This is the standard-out from that job. ie; everything that you would normally see printed to your screen when running locally, is printed to this file when running as a job. Once the job is over, one would inspect the slurm output file.

sh
head slurm-XXXX.out
tail slurm-XXXX.out
cat slurm-XXXX.out

6 Nextflow

You are not required to run anything practically in this section. This is just to read and understand.

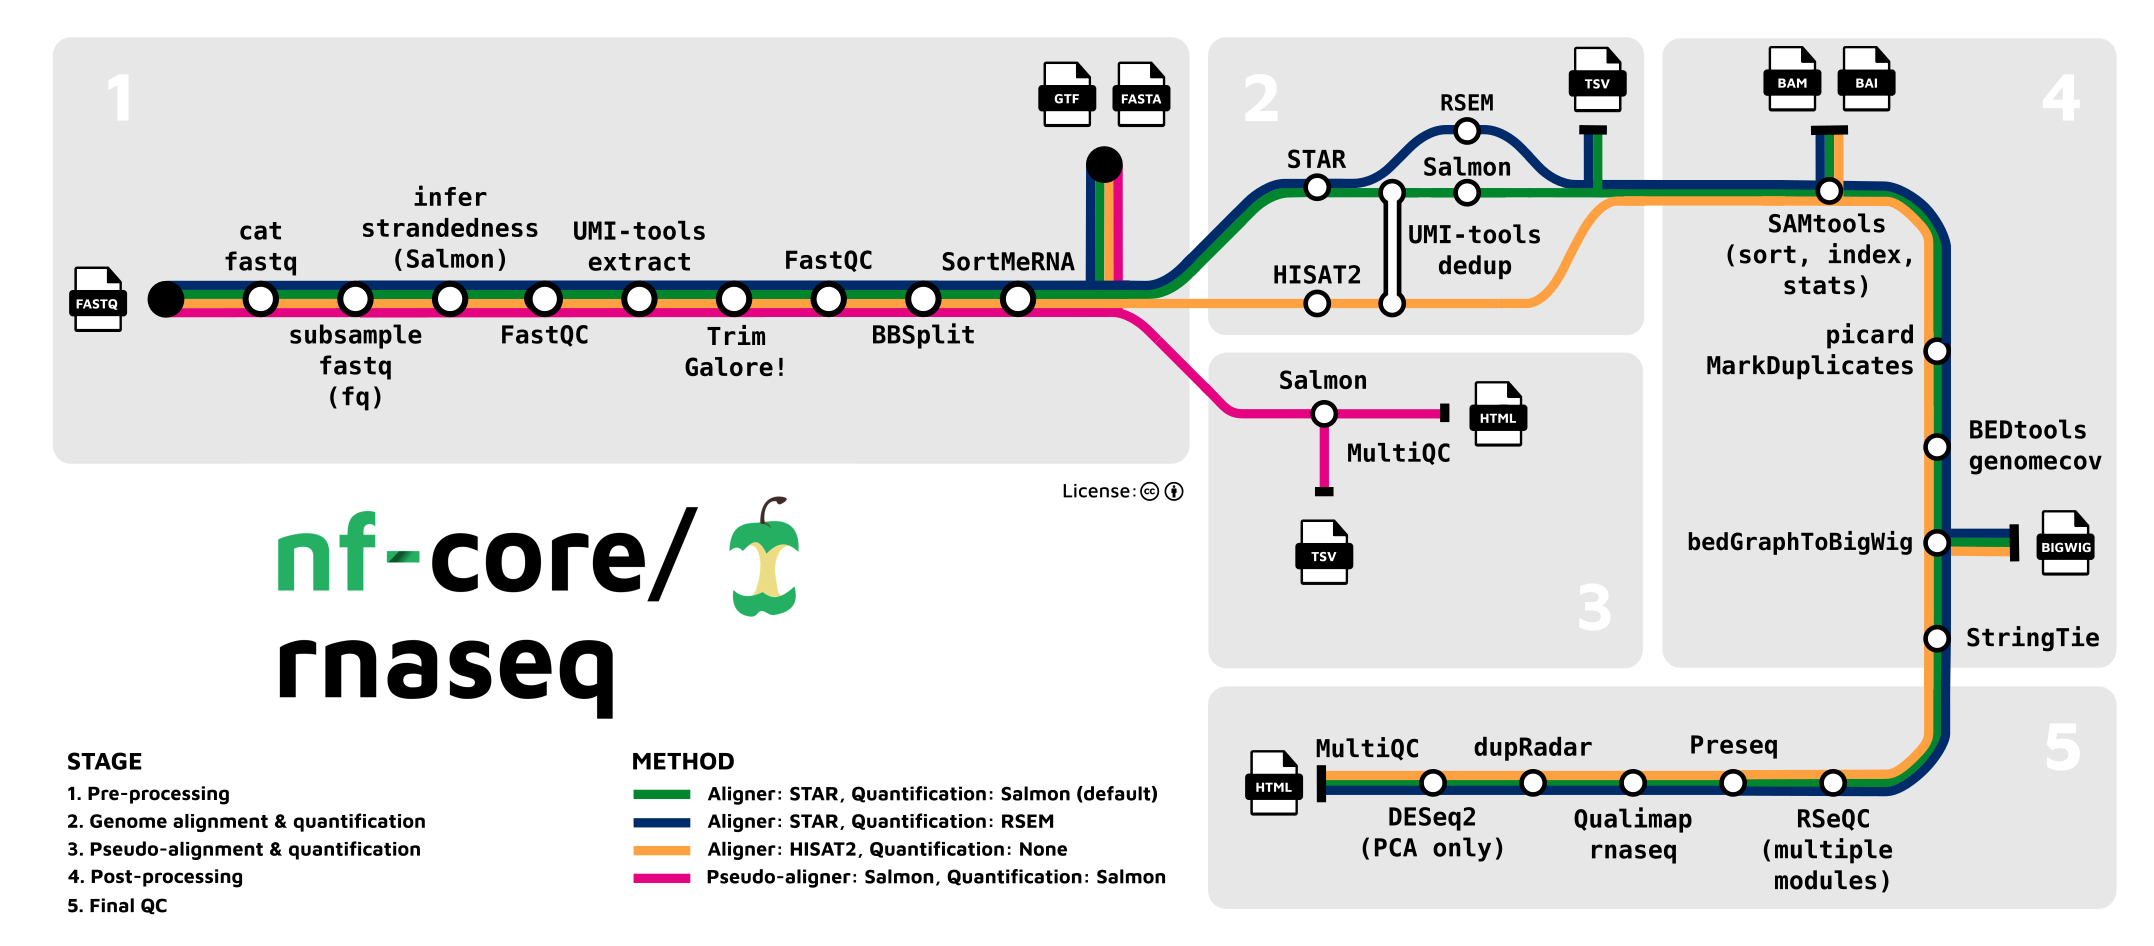
Everything you have done today and more is easily done using structured pipelines. Nextflow is a popular framework for creating bioinformatic pipelines and nf-core is a collection of curated analyses pipelines. Here, we will discuss the steps for analysing our current dataset using the nf-core rnaseq pipeline for bulk RNA-Seq. The nf-core website and pipeline specific pages are good sources of information on what the pipeline does and what parameters can be changed.

We need a samplesheet.csv to define our samples. In this case, the full size samples are used. For single-end reads, fastq_2 column is left empty.

sample,fastq_1,fastq_2,strandedness
ko_1,/crex/course_data/ngsintro/rnaseq/main_full/1_raw/SRR3222409_1.fq.gz,/crex/course_data/ngsintro/rnaseq/main_full/1_raw/SRR3222409_2.fq.gz,unstranded
ko_2,/crex/course_data/ngsintro/rnaseq/main_full/1_raw/SRR3222410_1.fq.gz,/crex/course_data/ngsintro/rnaseq/main_full/1_raw/SRR3222410_2.fq.gz,unstranded
ko_3,/crex/course_data/ngsintro/rnaseq/main_full/1_raw/SRR3222411_1.fq.gz,/crex/course_data/ngsintro/rnaseq/main_full/1_raw/SRR3222411_2.fq.gz,unstranded
wt_1,/crex/course_data/ngsintro/rnaseq/main_full/1_raw/SRR3222412_1.fq.gz,/crex/course_data/ngsintro/rnaseq/main_full/1_raw/SRR3222412_2.fq.gz,unstranded
wt_2,/crex/course_data/ngsintro/rnaseq/main_full/1_raw/SRR3222413_1.fq.gz,/crex/course_data/ngsintro/rnaseq/main_full/1_raw/SRR3222413_2.fq.gz,unstranded
wt_3,/crex/course_data/ngsintro/rnaseq/main_full/1_raw/SRR3222414_1.fq.gz,/crex/course_data/ngsintro/rnaseq/main_full/1_raw/SRR3222414_2.fq.gz,unstranded

We need a params.config file to define parameters such as input, output, genome, annotation etc.

params.input = "samplesheet.csv"
params.outdir = "results"
params.aligner = "star_salmon"

params.fasta = "/sw/data/igenomes/Mus_musculus/Ensembl/GRCm38/Sequence/WholeGenomeFasta/genome.fa"
params.gtf = "/sw/data/igenomes/Mus_musculus/Ensembl/GRCm38/Annotation/Genes/genes.gtf"
gene_bed = "/sw/data/igenomes/Mus_musculus/Ensembl/GRCm38/Annotation/Genes/genes.bed"
star_index = "/sw/data/igenomes/Mus_musculus/Ensembl/GRCm38/Sequence/STARIndex/version2.7.x/"

And lastly we have a nextflow.sh which will be our bash script for launching the job.

sh
#!/bin/bash

#SBATCH -A snic2022-22-1124
#SBATCH -p core
#SBATCH -n 1
#SBATCH -t 4:00:00
#SBATCH -J nf-core

module load bioinfo-tools
module load Nextflow/21.10.6
module load nf-core/2.1
NXF_HOME=.

nextflow run nf-core/rnaseq -r 3.7 -c params.config -profile uppmax --project snic2022-22-1124 -resume

Notice that we use -profile uppmax since this is run on Uppmax. The job is then submitted by simply running sbatch nextflow.sh.

The slurm output from this job looks like this:

Note that NXF_HOME is set to $HOME/.nextflow
Please change NXF_HOME to a place in your project directory (export NXF_HOME=yourprojectfolder)

N E X T F L O W  ~  version 21.10.6
Launching `nf-core/rnaseq` [happy_sammet] - revision: e0dfce9af5 [3.7]


------------------------------------------------------
                                        ,--./,-.
        ___     __   __   __   ___     /,-._.--~'
  |\ | |__  __ /  ` /  \ |__) |__         }  {
  | \| |       \__, \__/ |  \ |___     \`-._,-`-,
                                        `._,._,'
  nf-core/rnaseq v3.7
------------------------------------------------------
Core Nextflow options
  revision                  : 3.7
  runName                   : happy_sammet
  containerEngine           : singularity
  launchDir                 : /crex/course_data/ngsintro/rnaseq/main_full/nextflow
  workDir                   : /crex/course_data/ngsintro/rnaseq/main_full/nextflow/work
  projectDir                : ./assets/nf-core/rnaseq
  userName                  : royfranc
  profile                   : uppmax
  configFiles               : /crex/course_data/ngsintro/rnaseq/main_full/nextflow/assets/nf-core/rnaseq/nextflow.config, /crex/course_data/ngsintro/rnaseq/main_full/nextflow/params.config

Input/output options
  input                     : samplesheet.csv
  outdir                    : results

Reference genome options
  fasta                     : /sw/data/igenomes/Mus_musculus/Ensembl/GRCm38/Sequence/WholeGenomeFasta/genome.fa
  gtf                       : /sw/data/igenomes/Mus_musculus/Ensembl/GRCm38/Annotation/Genes/genes.gtf
  save_reference            : true
  igenomes_base             : /sw/data/igenomes/

Institutional config options
  config_profile_description: UPPMAX (Rackham) cluster profile provided by nf-core/configs.
  config_profile_contact    : Phil Ewels (@ewels)
  config_profile_url        : https://www.uppmax.uu.se/

Max job request options
  max_cpus                  : 20
  max_memory                : 970 GB
  max_time                  : 10d

Generic options
  tracedir                  : null/pipeline_info

!! Only displaying parameters that differ from the pipeline defaults !!
------------------------------------------------------
If you use nf-core/rnaseq for your analysis please cite:

* The pipeline
  https://doi.org/10.5281/zenodo.1400710

* The nf-core framework
  https://doi.org/10.1038/s41587-020-0439-x

* Software dependencies
  https://github.com/nf-core/rnaseq/blob/master/CITATIONS.md
------------------------------------------------------
[-        ] process > NFCORE_RNASEQ:RNASEQ:PREPAR... -

[-        ] process > NFCORE_RNASEQ:RNASEQ:PREPAR... -
[-        ] process > NFCORE_RNASEQ:RNASEQ:PREPAR... -
[-        ] process > NFCORE_RNASEQ:RNASEQ:PREPAR... -
[-        ] process > NFCORE_RNASEQ:RNASEQ:PREPAR... -
[-        ] process > NFCORE_RNASEQ:RNASEQ:PREPAR... -
[-        ] process > NFCORE_RNASEQ:RNASEQ:INPUT_... -
[-        ] process > NFCORE_RNASEQ:RNASEQ:CAT_FASTQ -
[-        ] process > NFCORE_RNASEQ:RNASEQ:FASTQC... -
[-        ] process > NFCORE_RNASEQ:RNASEQ:FASTQC... -
[-        ] process > NFCORE_RNASEQ:RNASEQ:ALIGN_... -
[-        ] process > NFCORE_RNASEQ:RNASEQ:ALIGN_... -

...
skipping many lines here
...

[3d/d294eb] process > NFCORE_RNASEQ:RNASEQ:CUSTOM... [100%] 1 of 1 ✔
[de/a03037] process > NFCORE_RNASEQ:RNASEQ:MULTIQ... [100%] 1 of 1 ✔
-[nf-core/rnaseq] 6/6 samples passed STAR 5% mapped threshold:
    90.41%: ko_2
    89.8%: ko_3
    87.15%: ko_1
    89.7%: wt_2
    90.29%: wt_3
    91.02%: wt_1
    ..see pipeline reports for full list
-
-[nf-core/rnaseq] Pipeline completed successfully-
Completed at: 13-Jan-2023 14:39:08
Duration    : 1h 45m 30s
CPU hours   : 90.4
Succeeded   : 207

The output results directory looks like this:

results/
├── fastqc
├── genome
│   ├── genes.bed
│   ├── genome.fa.fai
│   ├── genome.fa.sizes
│   ├── genome_genes.gtf
│   ├── genome.transcripts.fa
│   ├── index
│   └── rsem
├── multiqc
│   └── star_salmon
├── pipeline_info
│   ├── samplesheet.valid.csv
│   └── software_versions.yml
├── star_salmon
│   ├── bigwig
│   ├── deseq2_qc
│   ├── dupradar
│   ├── featurecounts
│   ├── ko_1
│   ├── ko_1.markdup.sorted.bam
│   ├── ko_1.markdup.sorted.bam.bai
│   ├── ko_2
│   ├── ko_2.markdup.sorted.bam
│   ├── ko_2.markdup.sorted.bam.bai
│   ├── ko_3
│   ├── ko_3.markdup.sorted.bam
│   ├── ko_3.markdup.sorted.bam.bai
│   ├── log
│   ├── picard_metrics
│   ├── preseq
│   ├── qualimap
│   ├── rseqc
│   ├── salmon.merged.gene_counts_length_scaled.rds
│   ├── salmon.merged.gene_counts_length_scaled.tsv
│   ├── salmon.merged.gene_counts.rds
│   ├── salmon.merged.gene_counts_scaled.rds
│   ├── salmon.merged.gene_counts_scaled.tsv
│   ├── salmon.merged.gene_counts.tsv
│   ├── salmon.merged.gene_tpm.tsv
│   ├── salmon.merged.transcript_counts.rds
│   ├── salmon.merged.transcript_counts.tsv
│   ├── salmon.merged.transcript_tpm.tsv
│   ├── salmon_tx2gene.tsv
│   ├── samtools_stats
│   ├── stringtie
│   ├── wt_1
│   ├── wt_1.markdup.sorted.bam
│   ├── wt_1.markdup.sorted.bam.bai
│   ├── wt_2
│   ├── wt_2.markdup.sorted.bam
│   ├── wt_2.markdup.sorted.bam.bai
│   ├── wt_3
│   ├── wt_3.markdup.sorted.bam
│   └── wt_3.markdup.sorted.bam.bai
└── trimgalore

This pipeline takes you from raw reads to counts including read QC, mapping, mapping QC and quantification as well as a complete collated overview of all steps as a MultiQC report (multiqc/star_salmon/multiqc_report.html). The star_salmon/salmon.merged.gene_counts.tsv is the counts file that you would use for downstream differential gene expression using DESeq2.

For standard analyses steps, it is recommended to use a pipeline as the tools are up-to-date and the analyses steps are reproducible using exactly the same versions of tools.

7 Simon’s analysis

We had Simon Andrews from the Babraham institute with us on one of the workshops and he did his own exploration into the dataset from this paper using his tool SeqMonk. It’s an excellent read and highly recommended. His report is available on the Contents page.

8 Conclusion

We hope that you enjoyed getting your hands wet working on some real-ish data. In this tutorial, we have covered the most important data processing steps that may be enough when the libraries are good. If not, there are plenty of troubleshooting procedures to try before discarding the data. And once the count table are in place, the biostatistics and data mining begins. There are no well-defined solutions here, all depends on the experiment and questions to be asked, but we strongly advise learning R. Not only to use the specifically designed statistical packages to analyse NGS count data, but also to be able to handle the data and results as well as to generate high-quality plots. There are many available tools and well-written tutorials with examples to learn from.

For those interested in RNA-Seq analysis, SciLifeLab offers a more advanced course in RNA-Seq analysis each semester. For more information, see SciLifeLab events.