you should be now enrolled and be able to access materials incl. quizzes
Canvas Demo
Schedule
Quiz
Certificate requirements
presence in all sessions during the week
we may allow skipping up to 4h during the week
completing “Daily challenge” quiz
opens daily at 15.00
closes at 09:00 the following day
active participation during the week
Note that we are not able to provide any formal university credits (högskolepoäng). Many universities, however, recognize the attendance in our courses, and award 1.5 HPs, corresponding to 40h of studying. It is up to participants to clarify and arrange credit transfer with the relevant university department.
Course: background & aim
Background
“If you torture the data long enough, it will confess to anything”
Ronald Coase, British Economist
image by Richa Bhatia
Background
Some common problems we have been observing are due to:
incorrect study design e.g. absence of adequate controls
forming incorrect null and alternative hypothesis
applying statistical methods without understanding
misinterpreting the output of the statistical methods
circular analysis, e.g. testing hypotheses on same sample that led to the generation of the hypotheses in the first place
image by Richa Bhatia
Aim
We aim to focus on fundamentals since we believe that getting the basics right will help with:
avoiding common errors
studying more advanced topics.
Aim
What do we want you to gain from this course?
Framework for statistical learning: learn a selection of methods and develop an understanding to apply methods correctly and explore them independently
Appreciation of theory incl. not being afraid of equations
How?
We will look in detail into selected methods
Over the week we will build up our understanding of different aspects of a typical data analysis project and demonstrate how to combine all the steps to build a predictive model.
Course Content
Content
Let’s consider some common cases…
Content
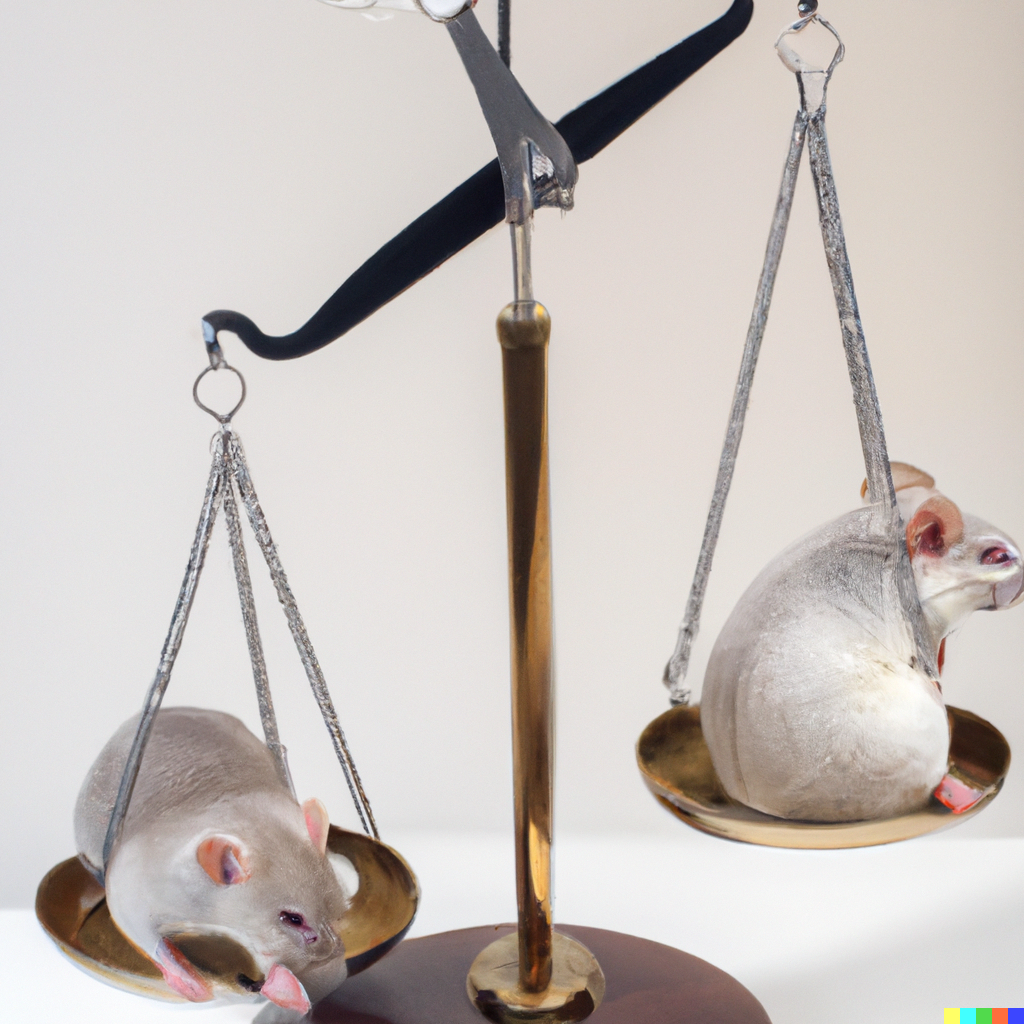
Case 1: Mouse Knockout Experiment
Content: Mouse Knockout Experiment
Case 1: Mouse Knockout Experiment
Does LDL receptor gene affect the total plasma cholesterol?
Setup
We have access to data from an experiment:
10 wild type (WT) mice
10 LDLR knockout (KO) mice
where plasma concentration of total cholesterol was measured at one time point after feeding on high fat diet
generated by DALL \(\cdot\) E 2
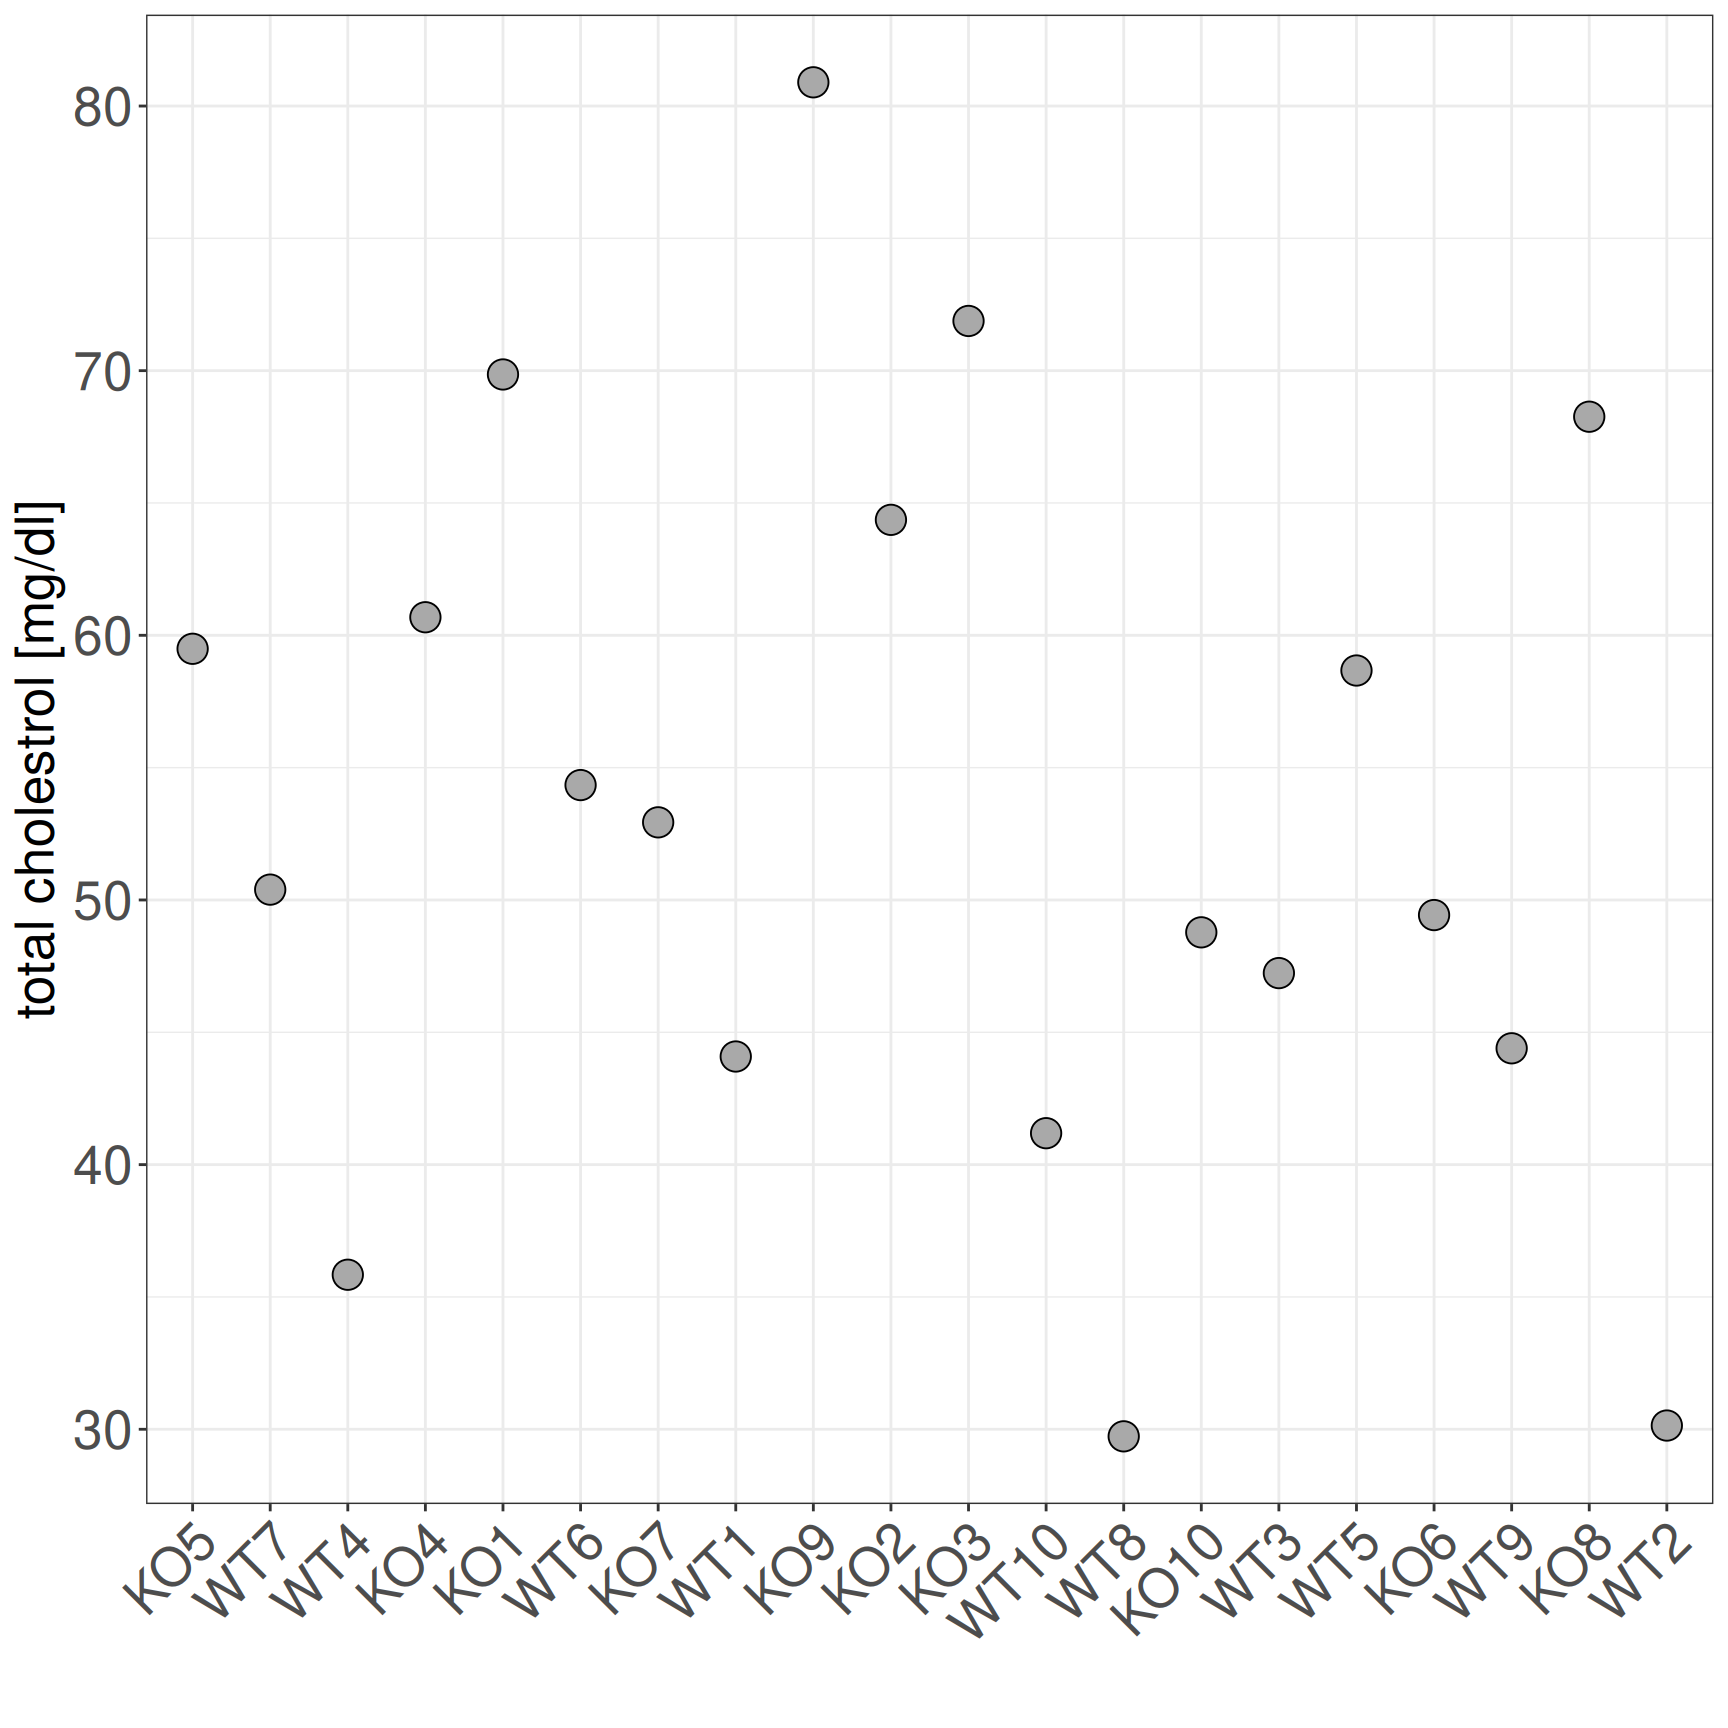
Content: Mouse Knockout Experiment
Visualize results
Not so informative.
Let’s improve!
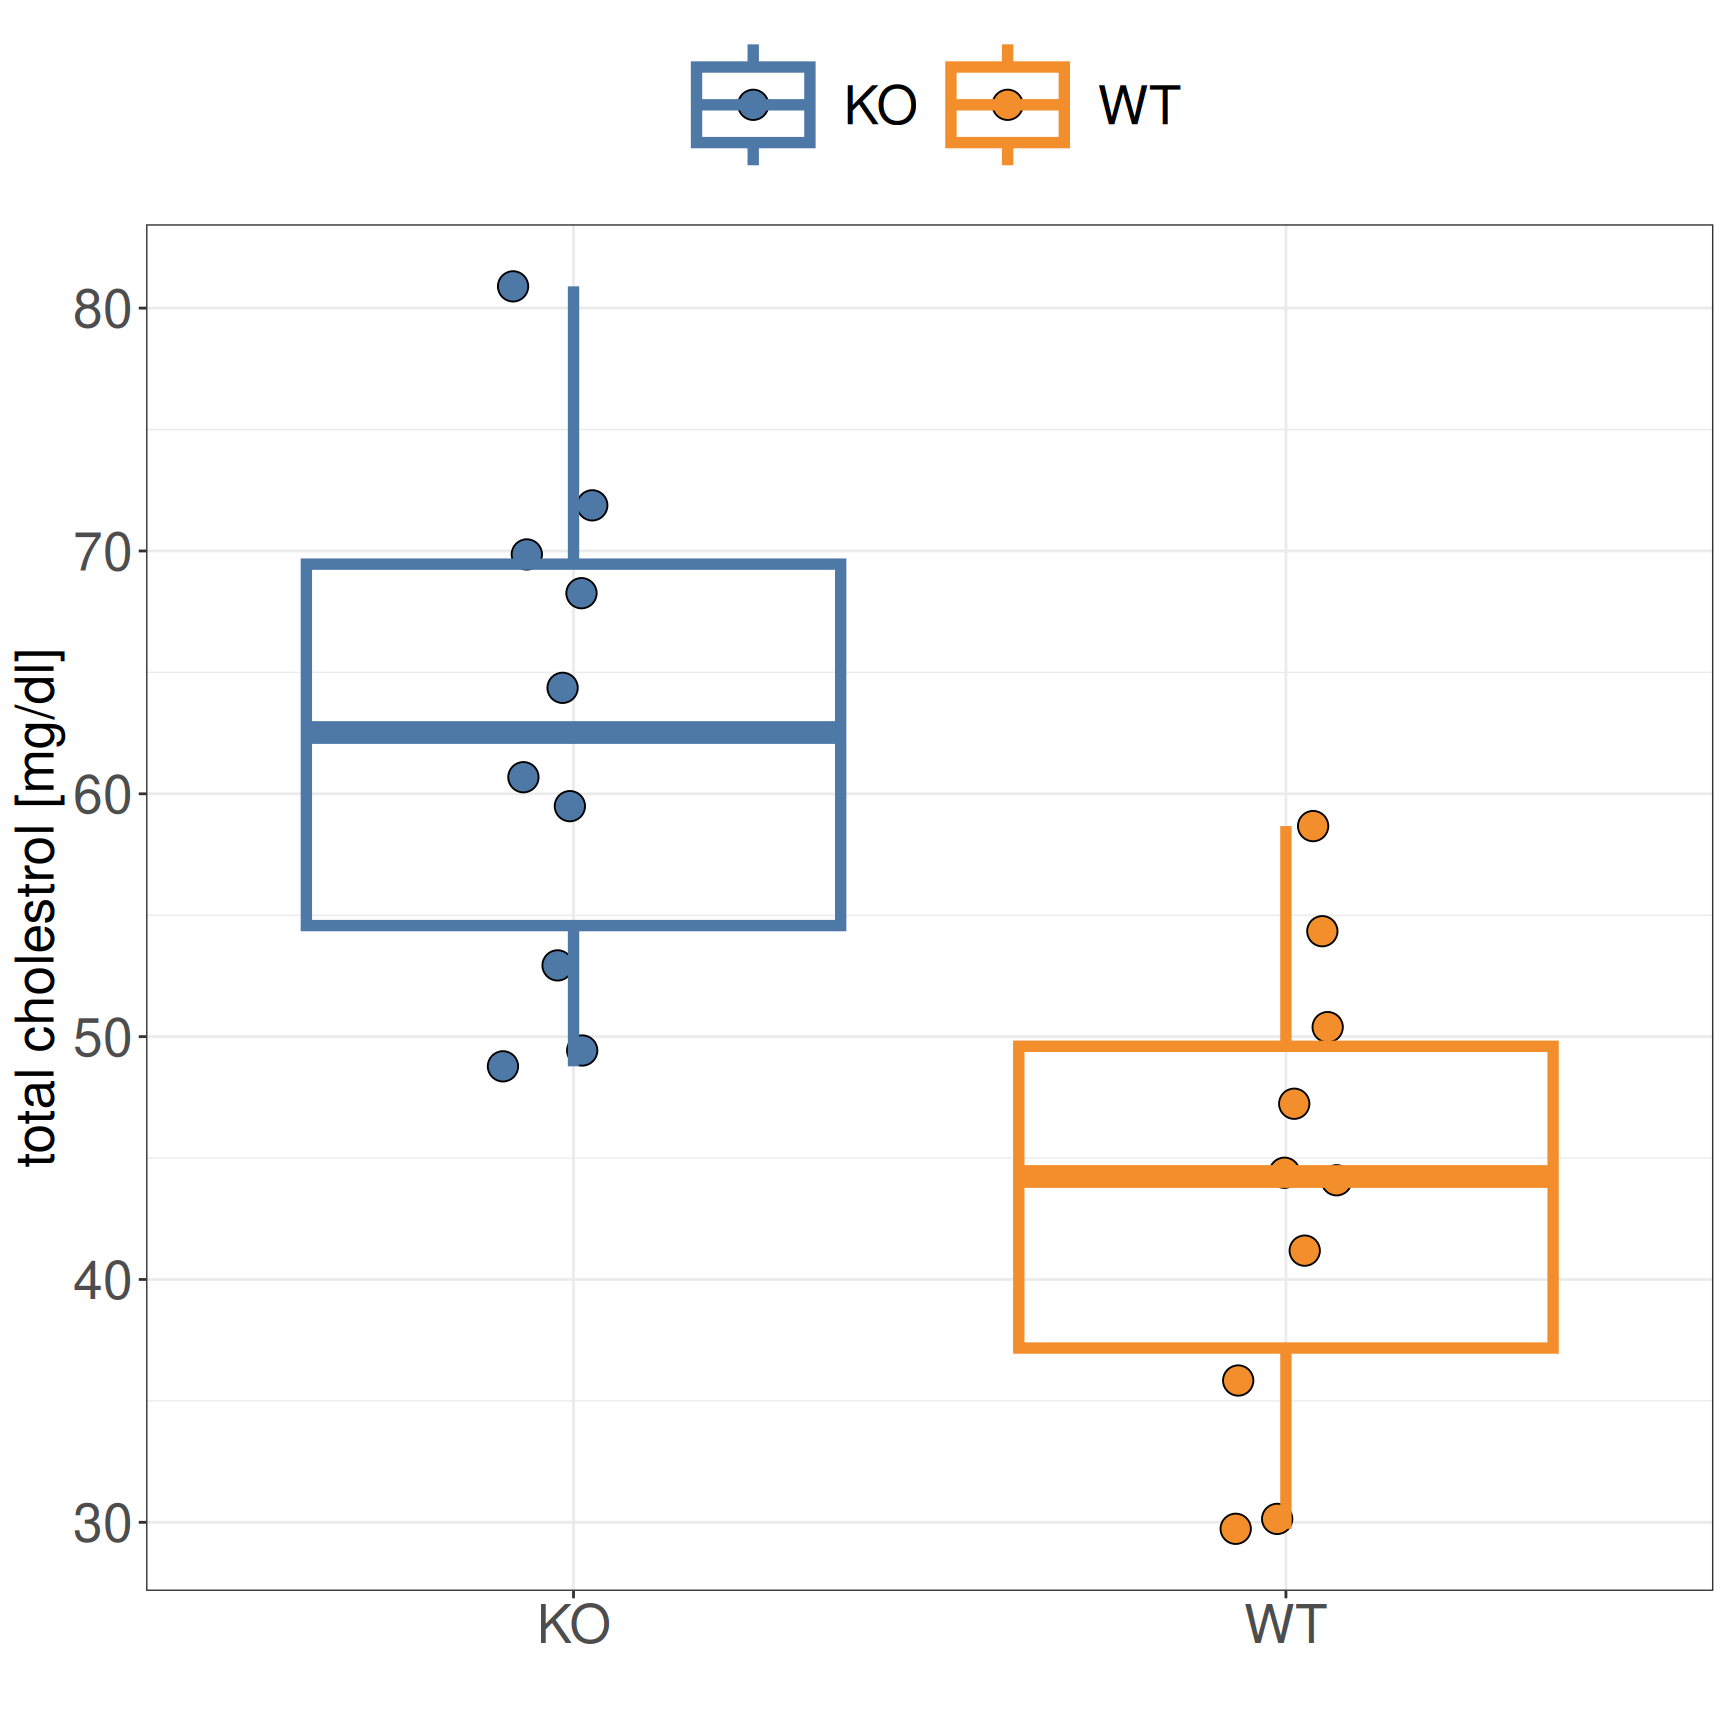
Content: Mouse Knockout Experiment
Improved visualization
Collect KO and WT separately as columns in a box plot
Visualize distribution of sample values using descriptive statistics such as median and quartiles
We will talk more:
exploratory data analysis
summarizing data with descriptive statistics
visualizing data
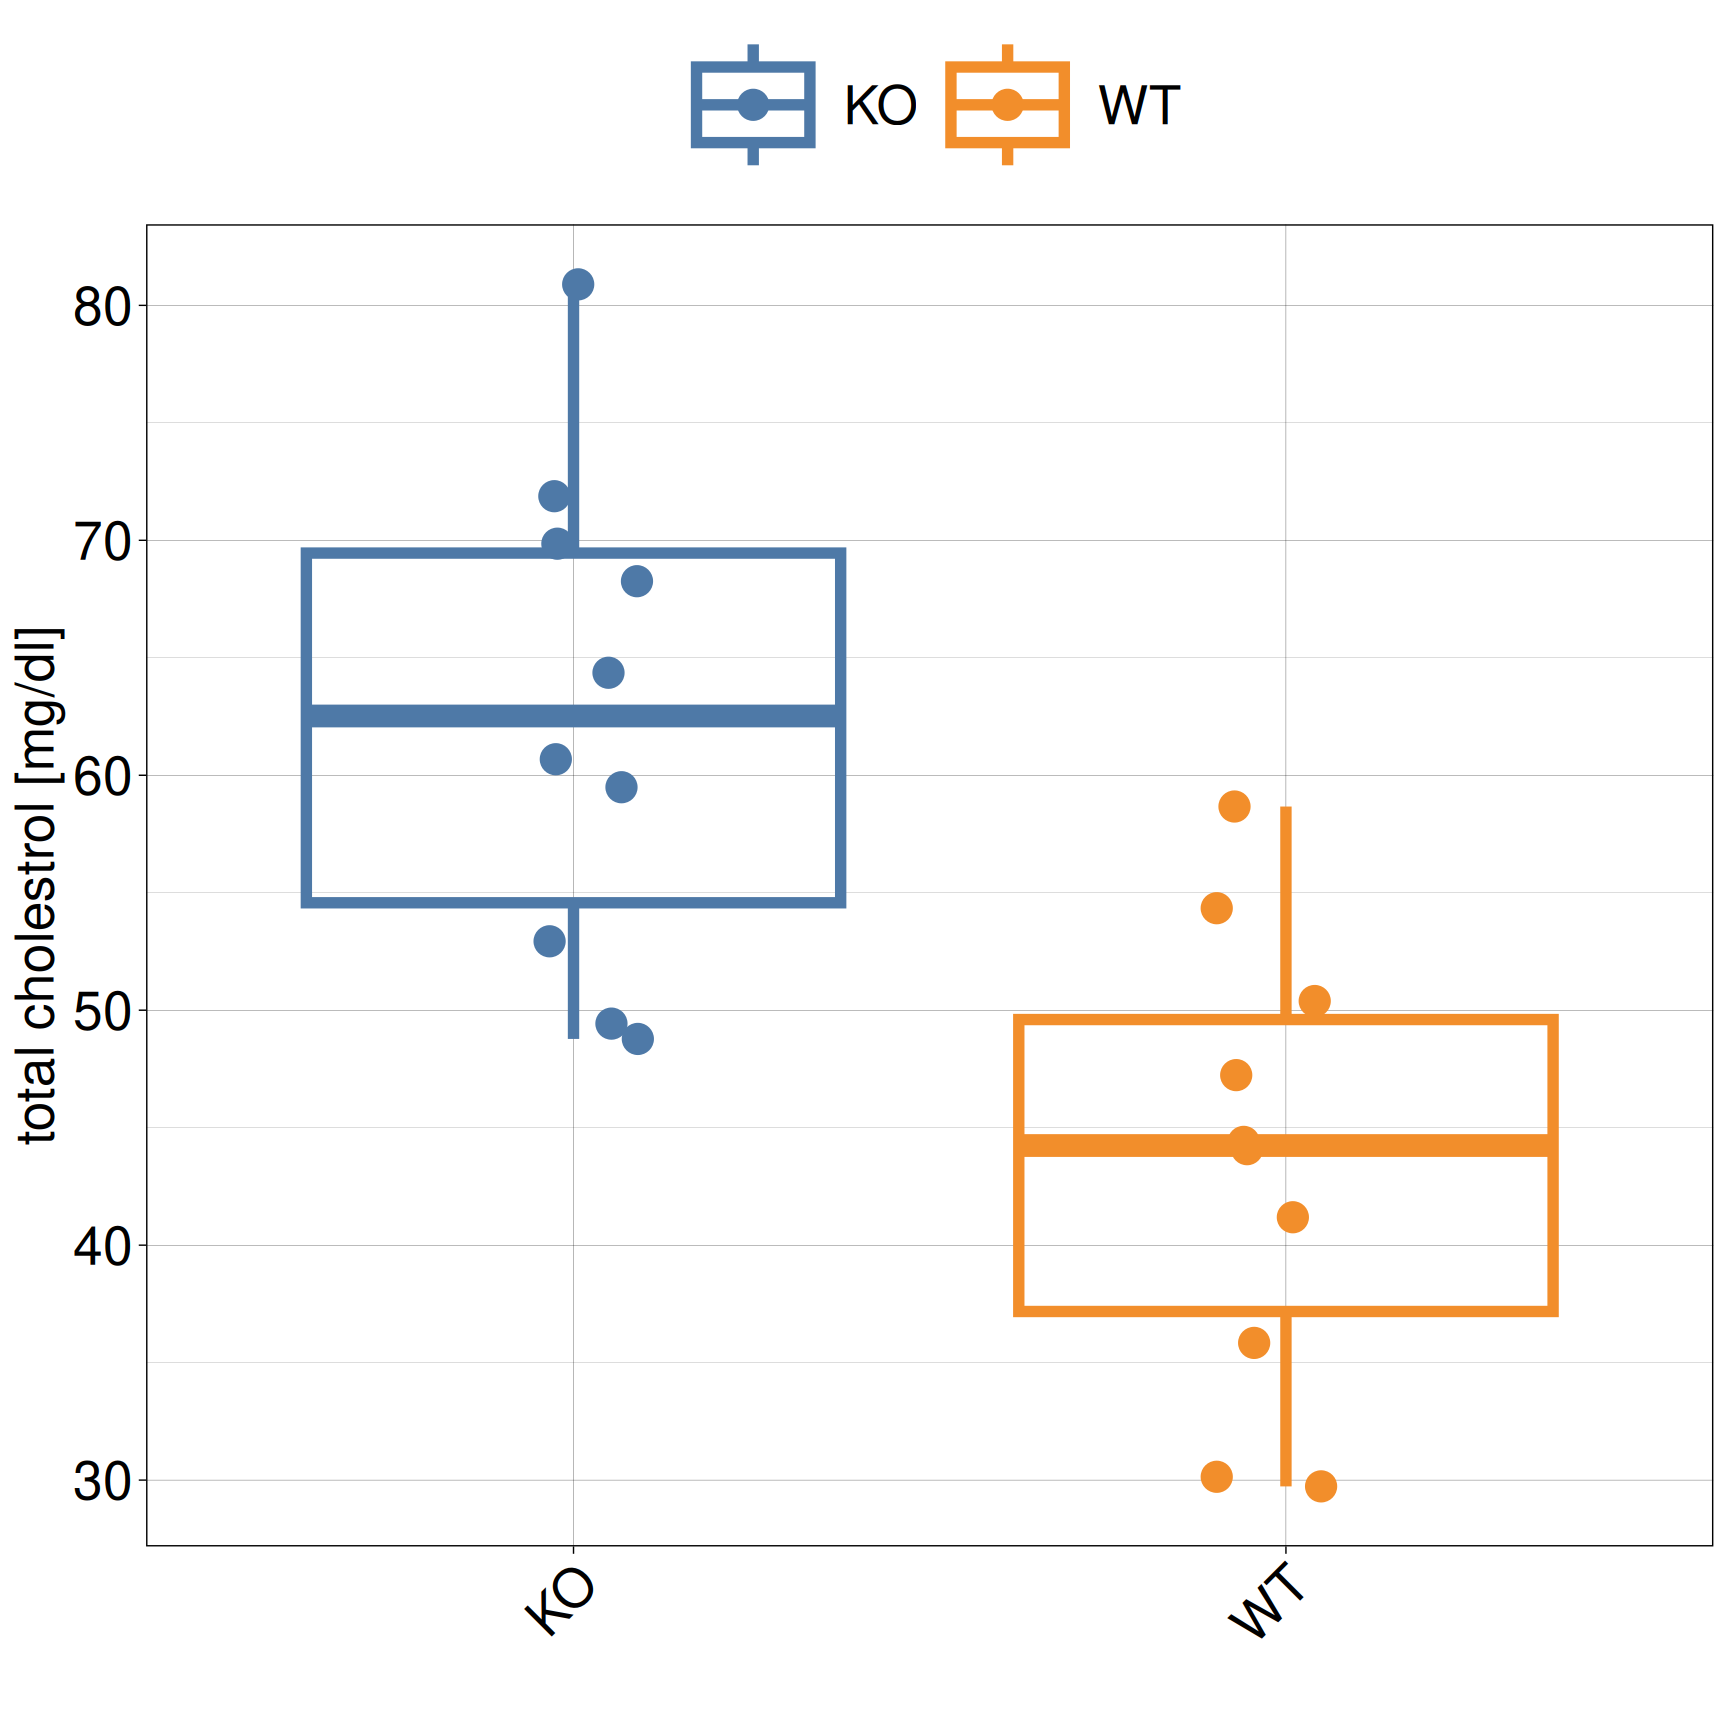
Content: Mouse Knockout Experiment
Interpretation
Intuitively, there is a clear difference between KO and WT based on the box plot
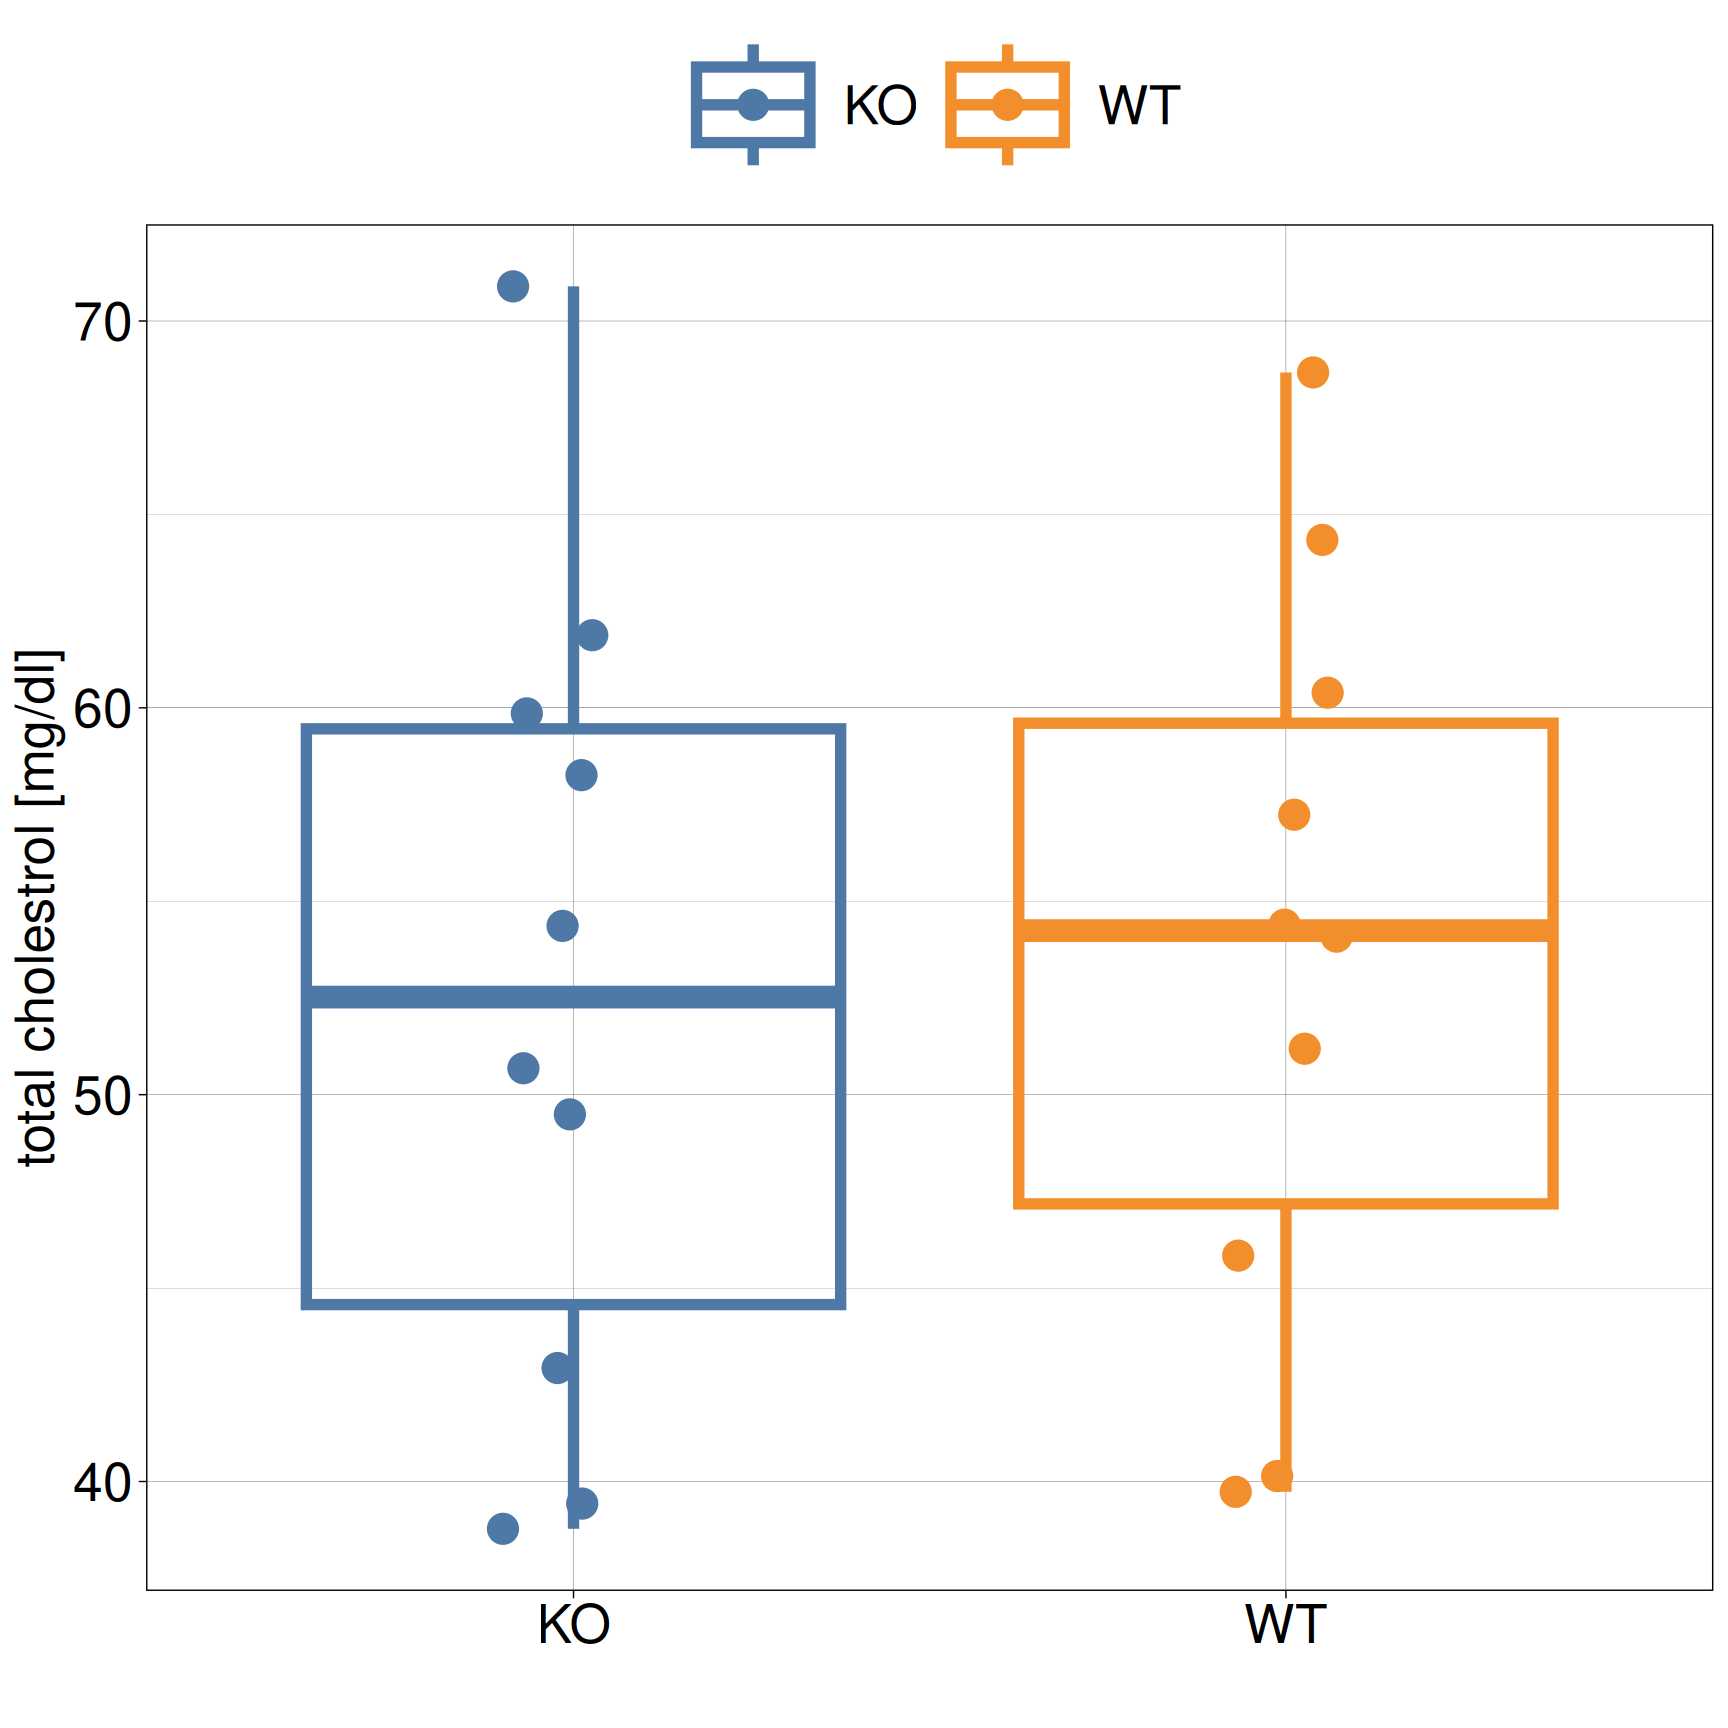
Content: Mouse Knockout Experiment
Interpretation
Intuitively, there is no difference between KO and WT based on the box plot
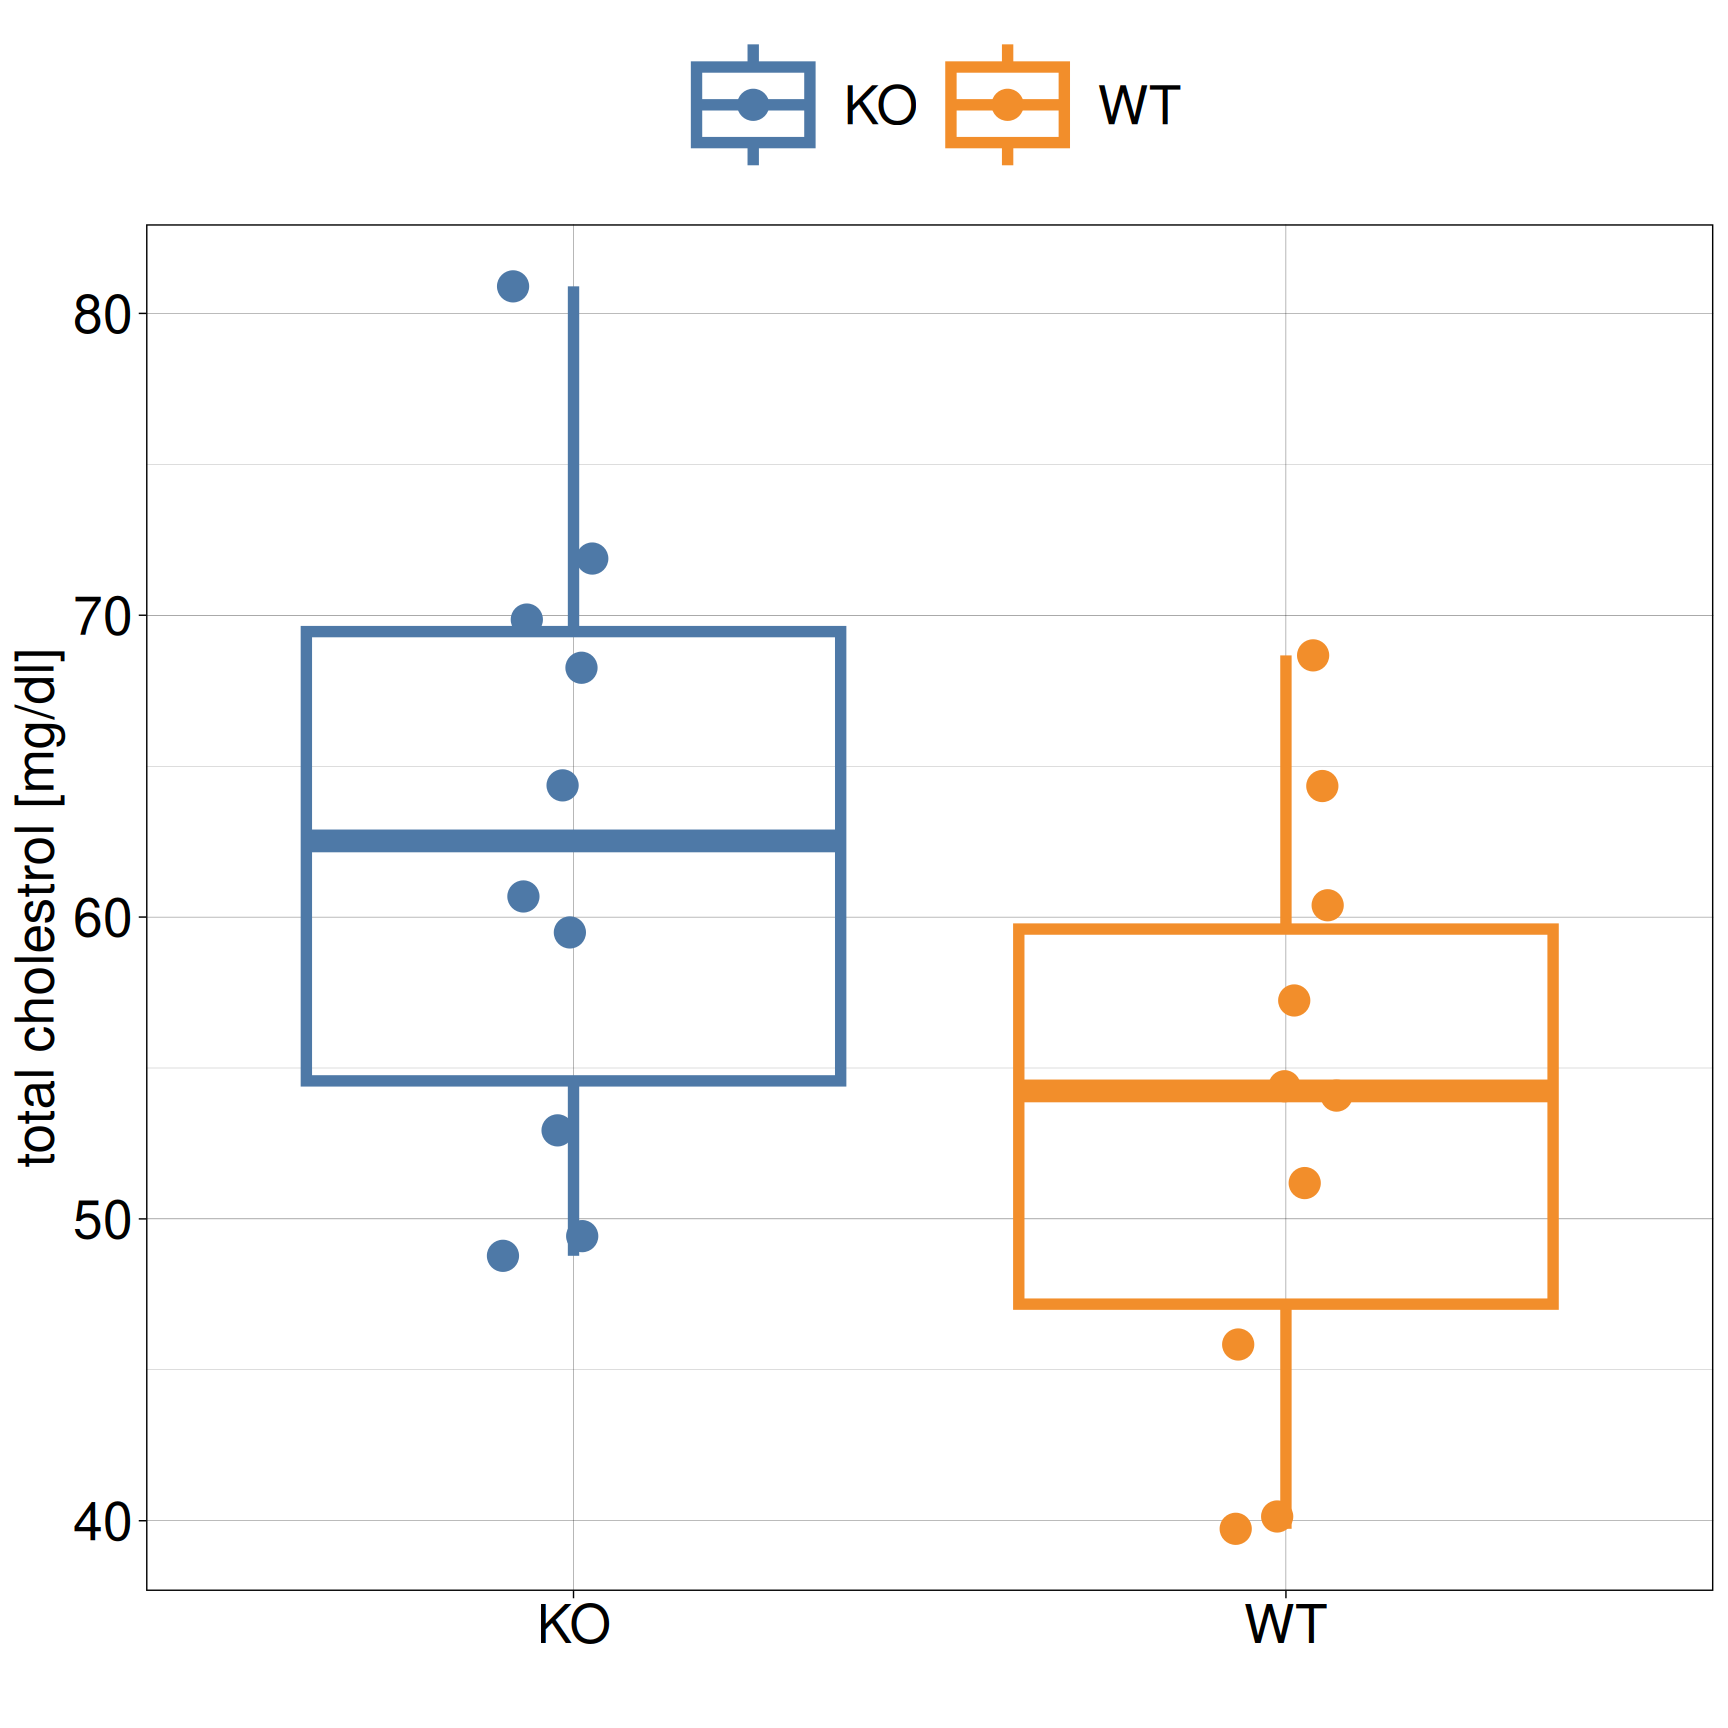
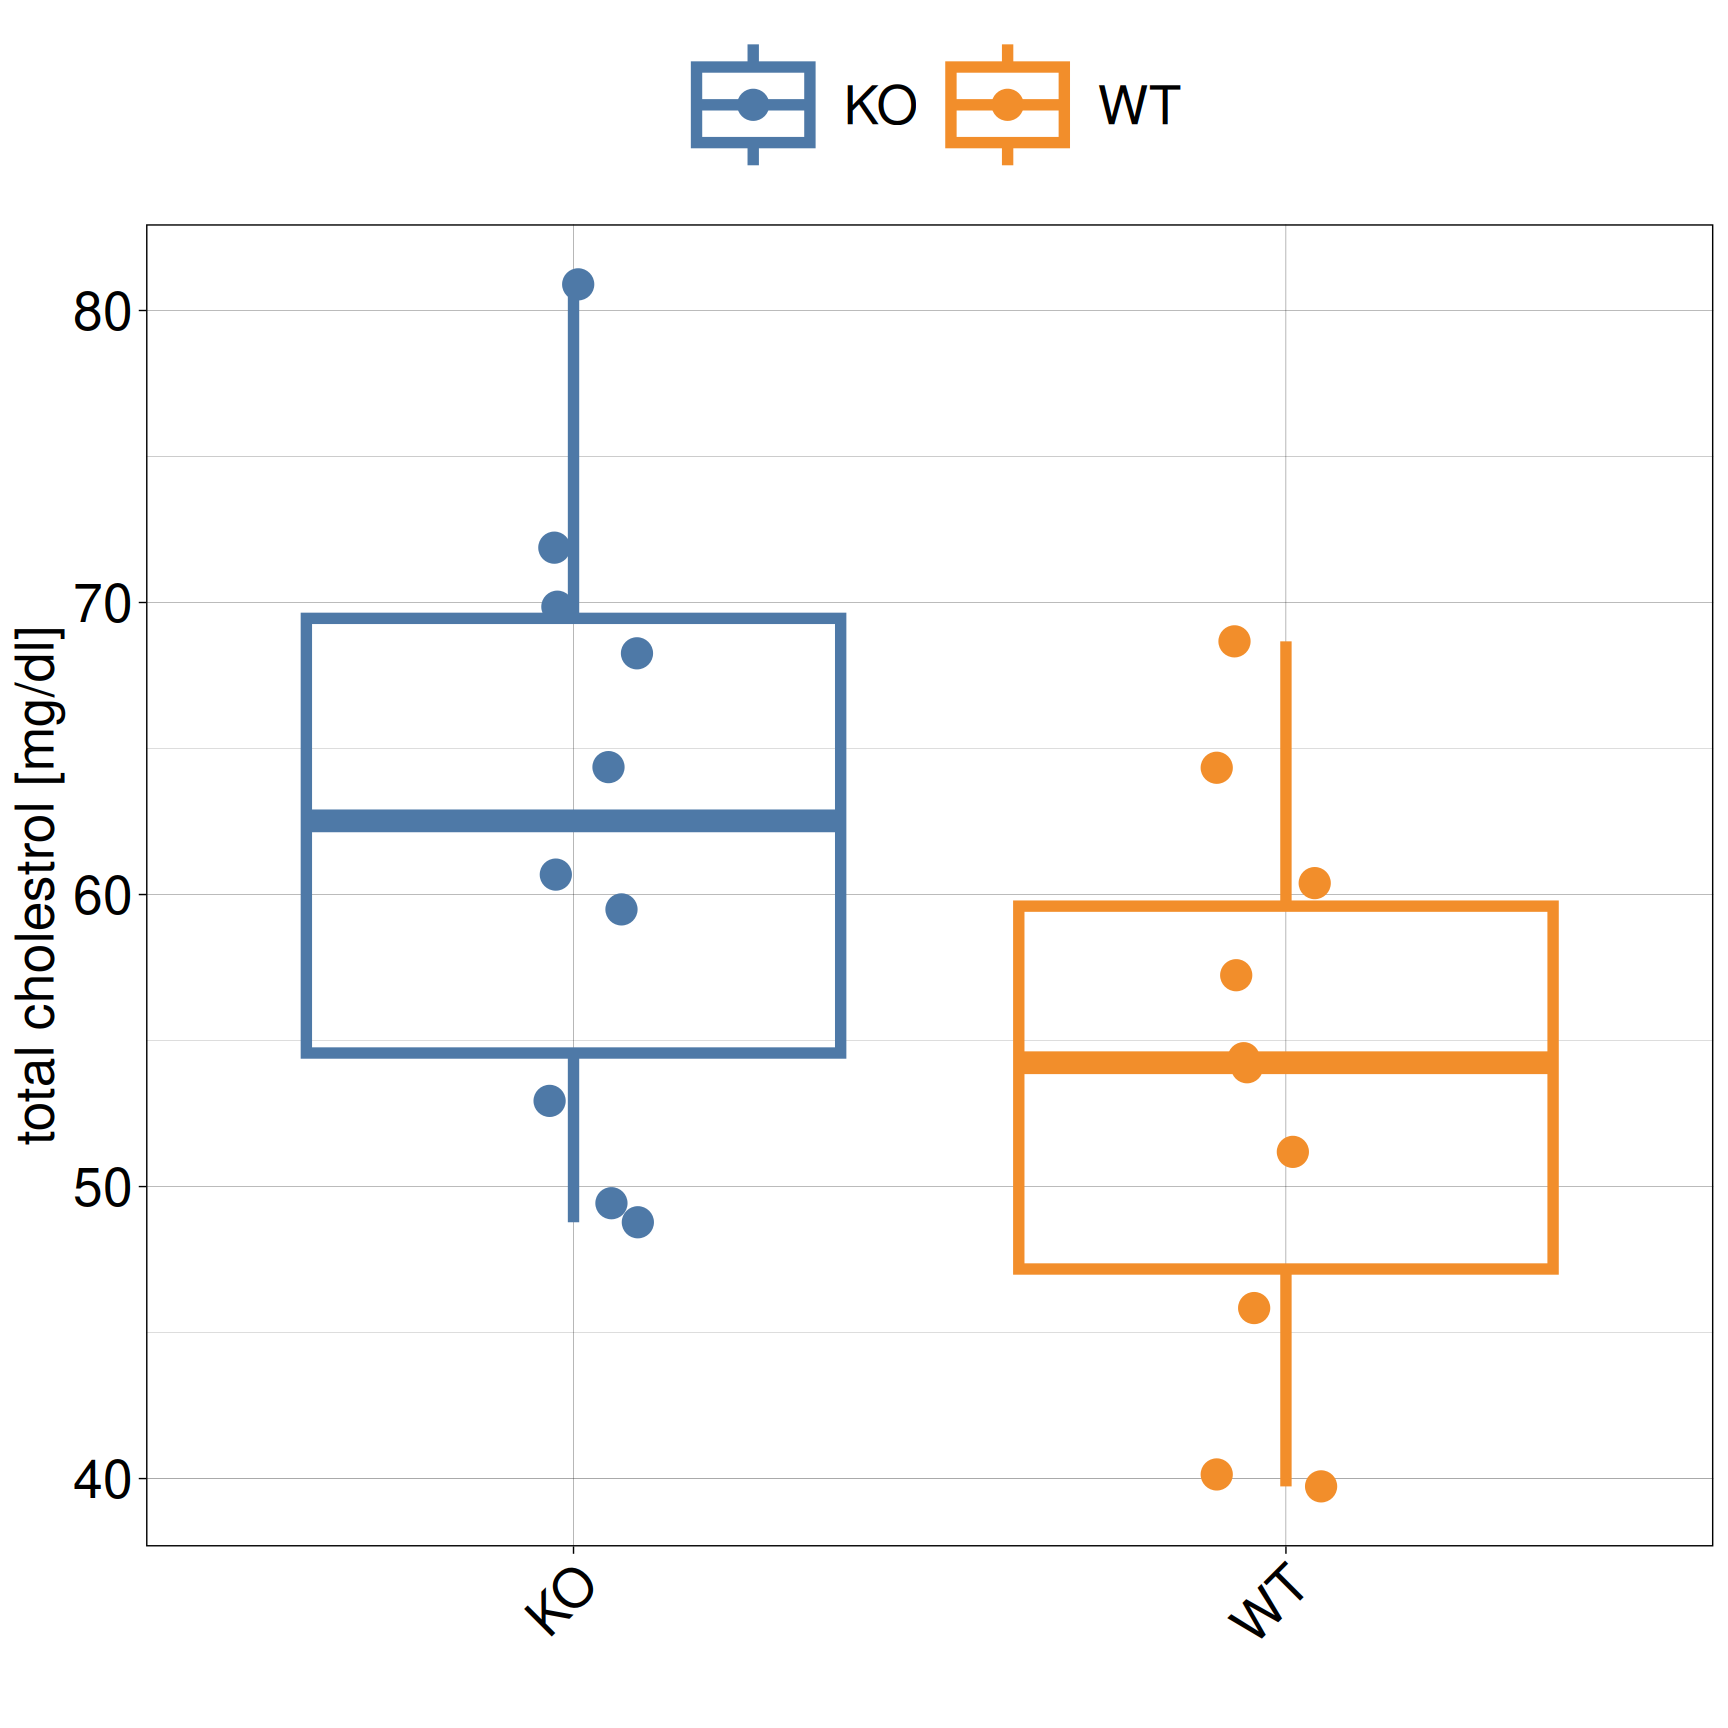
Content: Mouse Knockout Experiment
Interpretation
And now we get uncertain…
Probability gives us a scale for measuring uncertainty
Probability theory is fundamentally important to inferential statistical analysis
We will talk more:
probability theory
discrete and continuous random variables
Content: Mouse Knockout Experiment
Inference
Formulate null \(H_0\) and \(H_a\) hypothesis:
\(H_0\): \(\mu_1 = \mu_2\)
\(H_a\): \(\mu_1 \neq \mu_2\)
Select appropriate test statistics \(T\) and calculate corresponding p-value
Draw conclusions whether there is enough evidence of rejecting \(H_0\)
We will talk more:
statistical tests
using permutations, parametric test and non-parametric test
multiple testing
Content
Case 2: Protein expression
Content: Protein expression
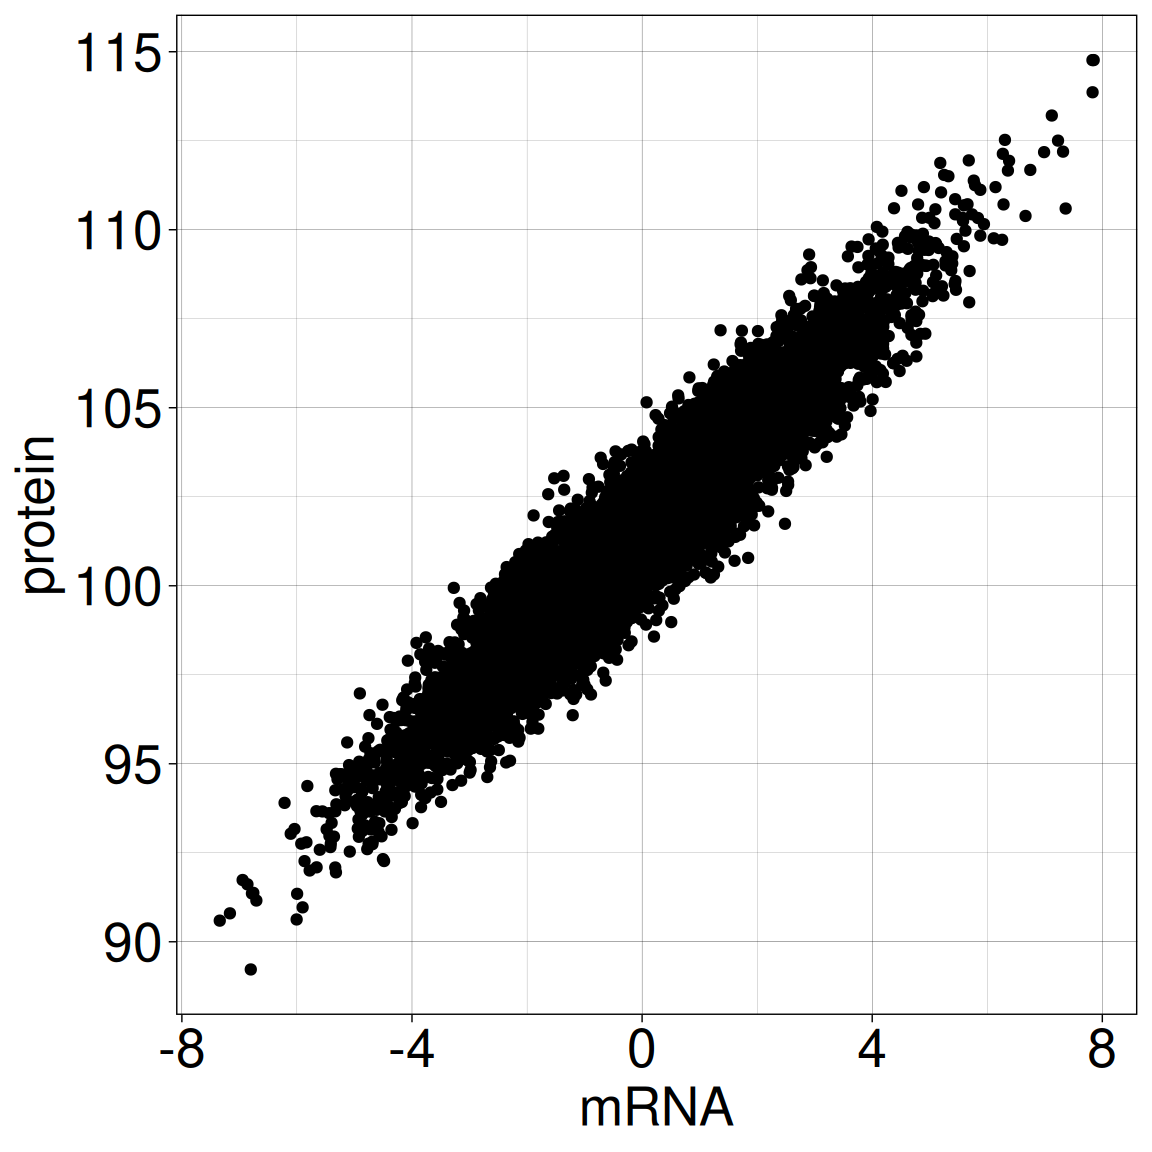
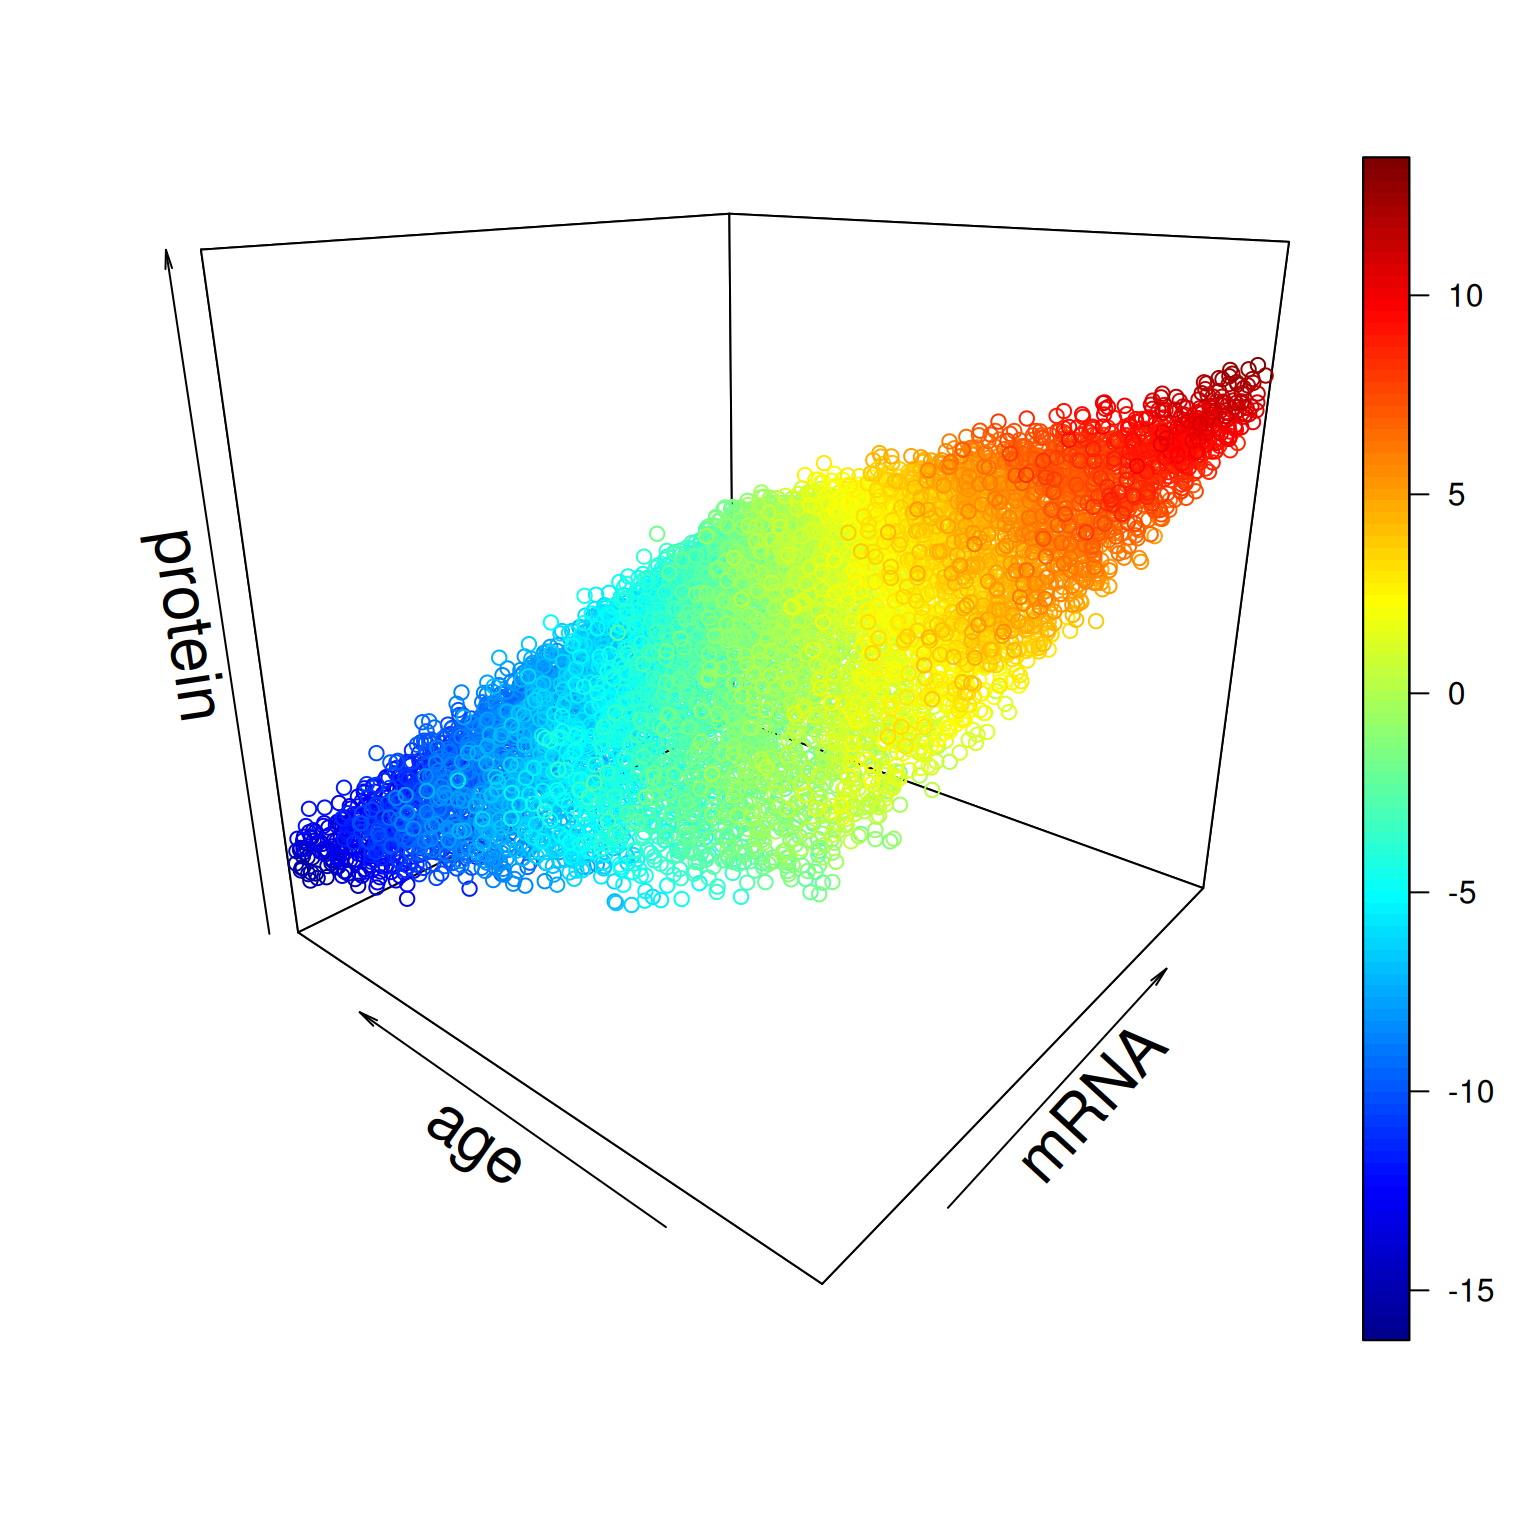
Case 2: Protein expression
Is there a relationship between BRCA1 protein expression and mRNA expression in breast tissue?
Setup
We have access to data from a breast cancer study:
BRCA1 protein expression based on immunohistochemical staining
mRNA expression from RNA-seq
for 10 000 study participants
Content: Protein expression
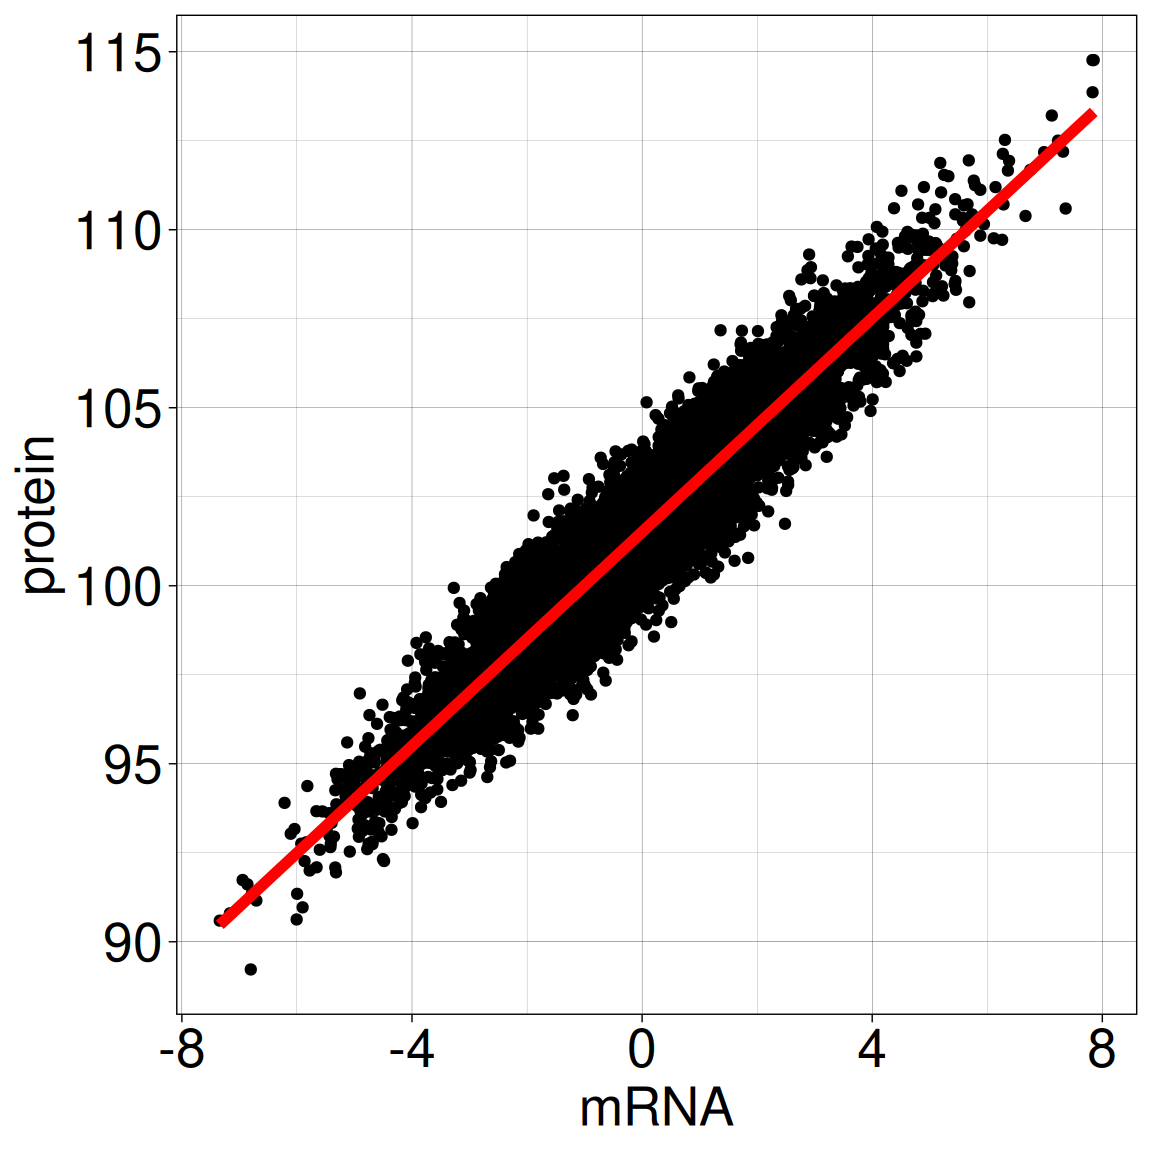
Case 2: Protein expression
Is there a relationship between BRCA1 protein expression and mRNA expression in breast tissue?
We will talk more:
fitting linear model: \([Prot] = \alpha +\beta [mRNA] + \epsilon\)
Content: Protein expression
Case 2: Protein expression
Is there a relationship between BRCA1 protein expression and mRNA expression in breast tissue?
We will talk more:
fitting linear model: \([Prot] = \alpha +\beta [mRNA] + \epsilon\)
hypothesis testing
Content: Protein expression
Case 2: Protein expression
Is there a relationship between BRCA1 protein expression and mRNA expression in breast tissue?
We will talk more:
fitting linear model: \([Prot] = \alpha +\beta [mRNA] + \epsilon\)
hypothesis testing
using model for predictions
Content: Protein expression
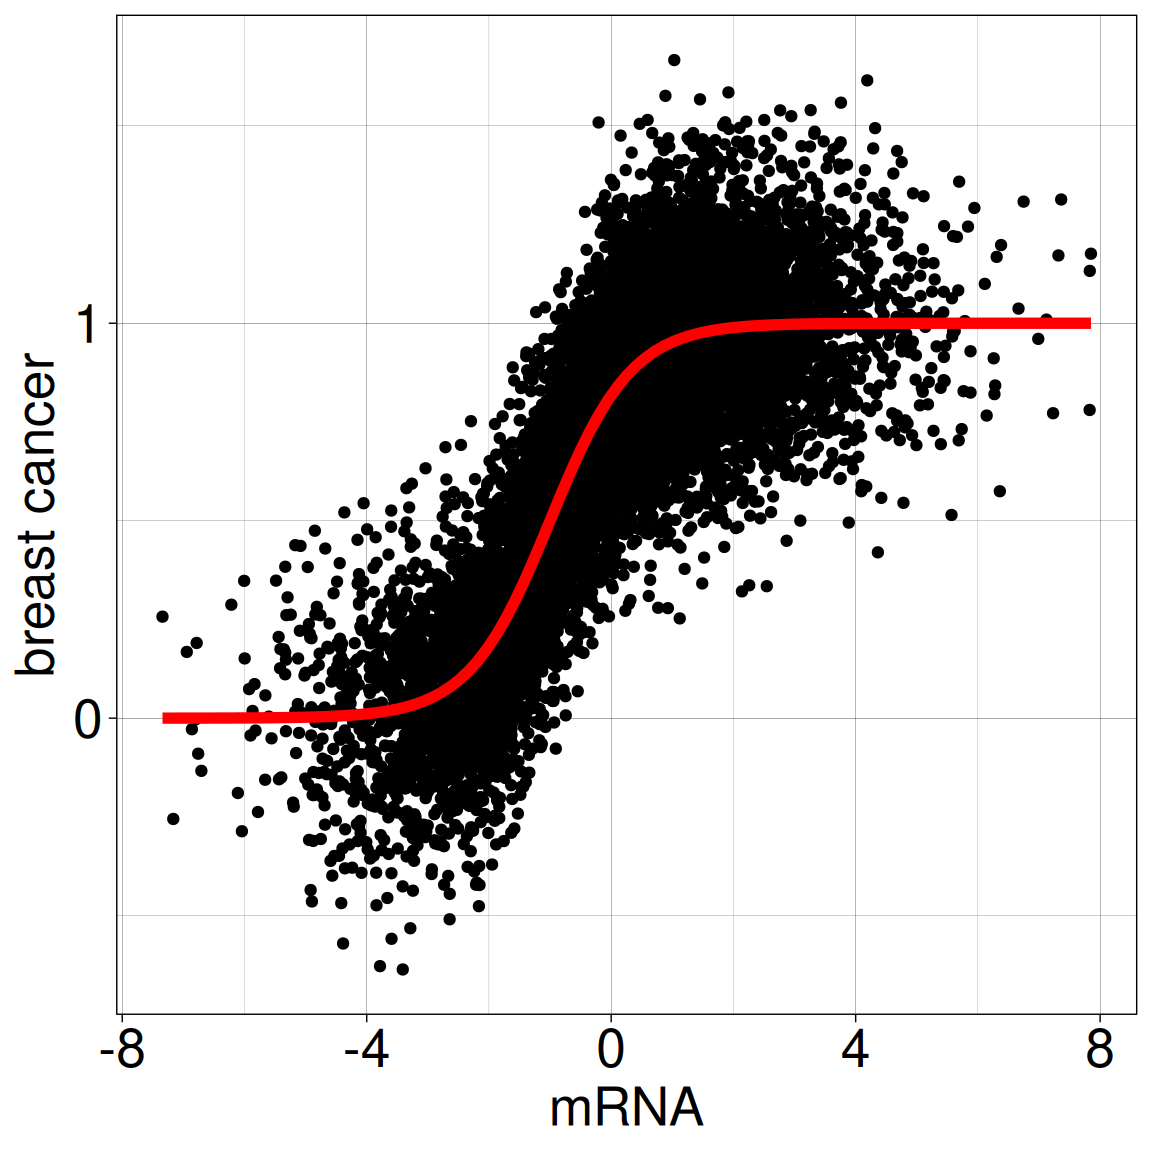
Case 2: Protein expression
Is there a relationship between BRCA1 protein expression and mRNA expression in breast tissue?
We will talk more:
fitting linear model: \([Prot] = \alpha +\beta [mRNA] + \epsilon\)
hypothesis testing
using model for predictions
expanding linear model to logistic regression with GLM, generalized linear models
Content: Protein expression
Case 2: Protein expression
Is there a relationship between BRCA1 protein expression and mRNA expression in breast tissue?
We will talk more:
fitting linear model: \([Prot] = \alpha +\beta [mRNA] + \epsilon\)
hypothesis testing
using model for predictions
expanding linear model to logistic regression with GLM, generalized linear models