[1] 2 3 4 2 1 2 4 5 10 11 8 9Introduction to ggplot
NBIS, SciLifeLab
19-May-2025
Quick checkups
- Coffee breaks (Morning and afternoon fika)
- Webpage structure
- Plots from drop-down
- Times mentioned in schedule are super arbitrary
Data Frames
- Let us take a quick look into
data.frameinR:
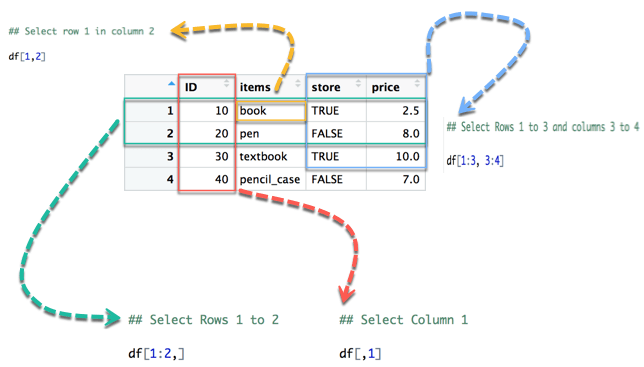
- Imported files are usually in
data.frame - Structured matrix with
row.namesandcolnames - Probably most used
data.typein Biology!
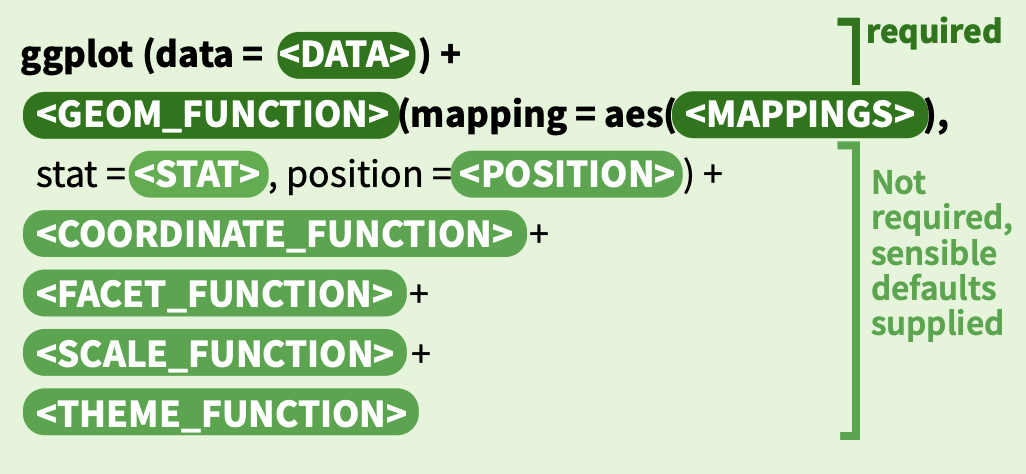
Grammar of Graphics
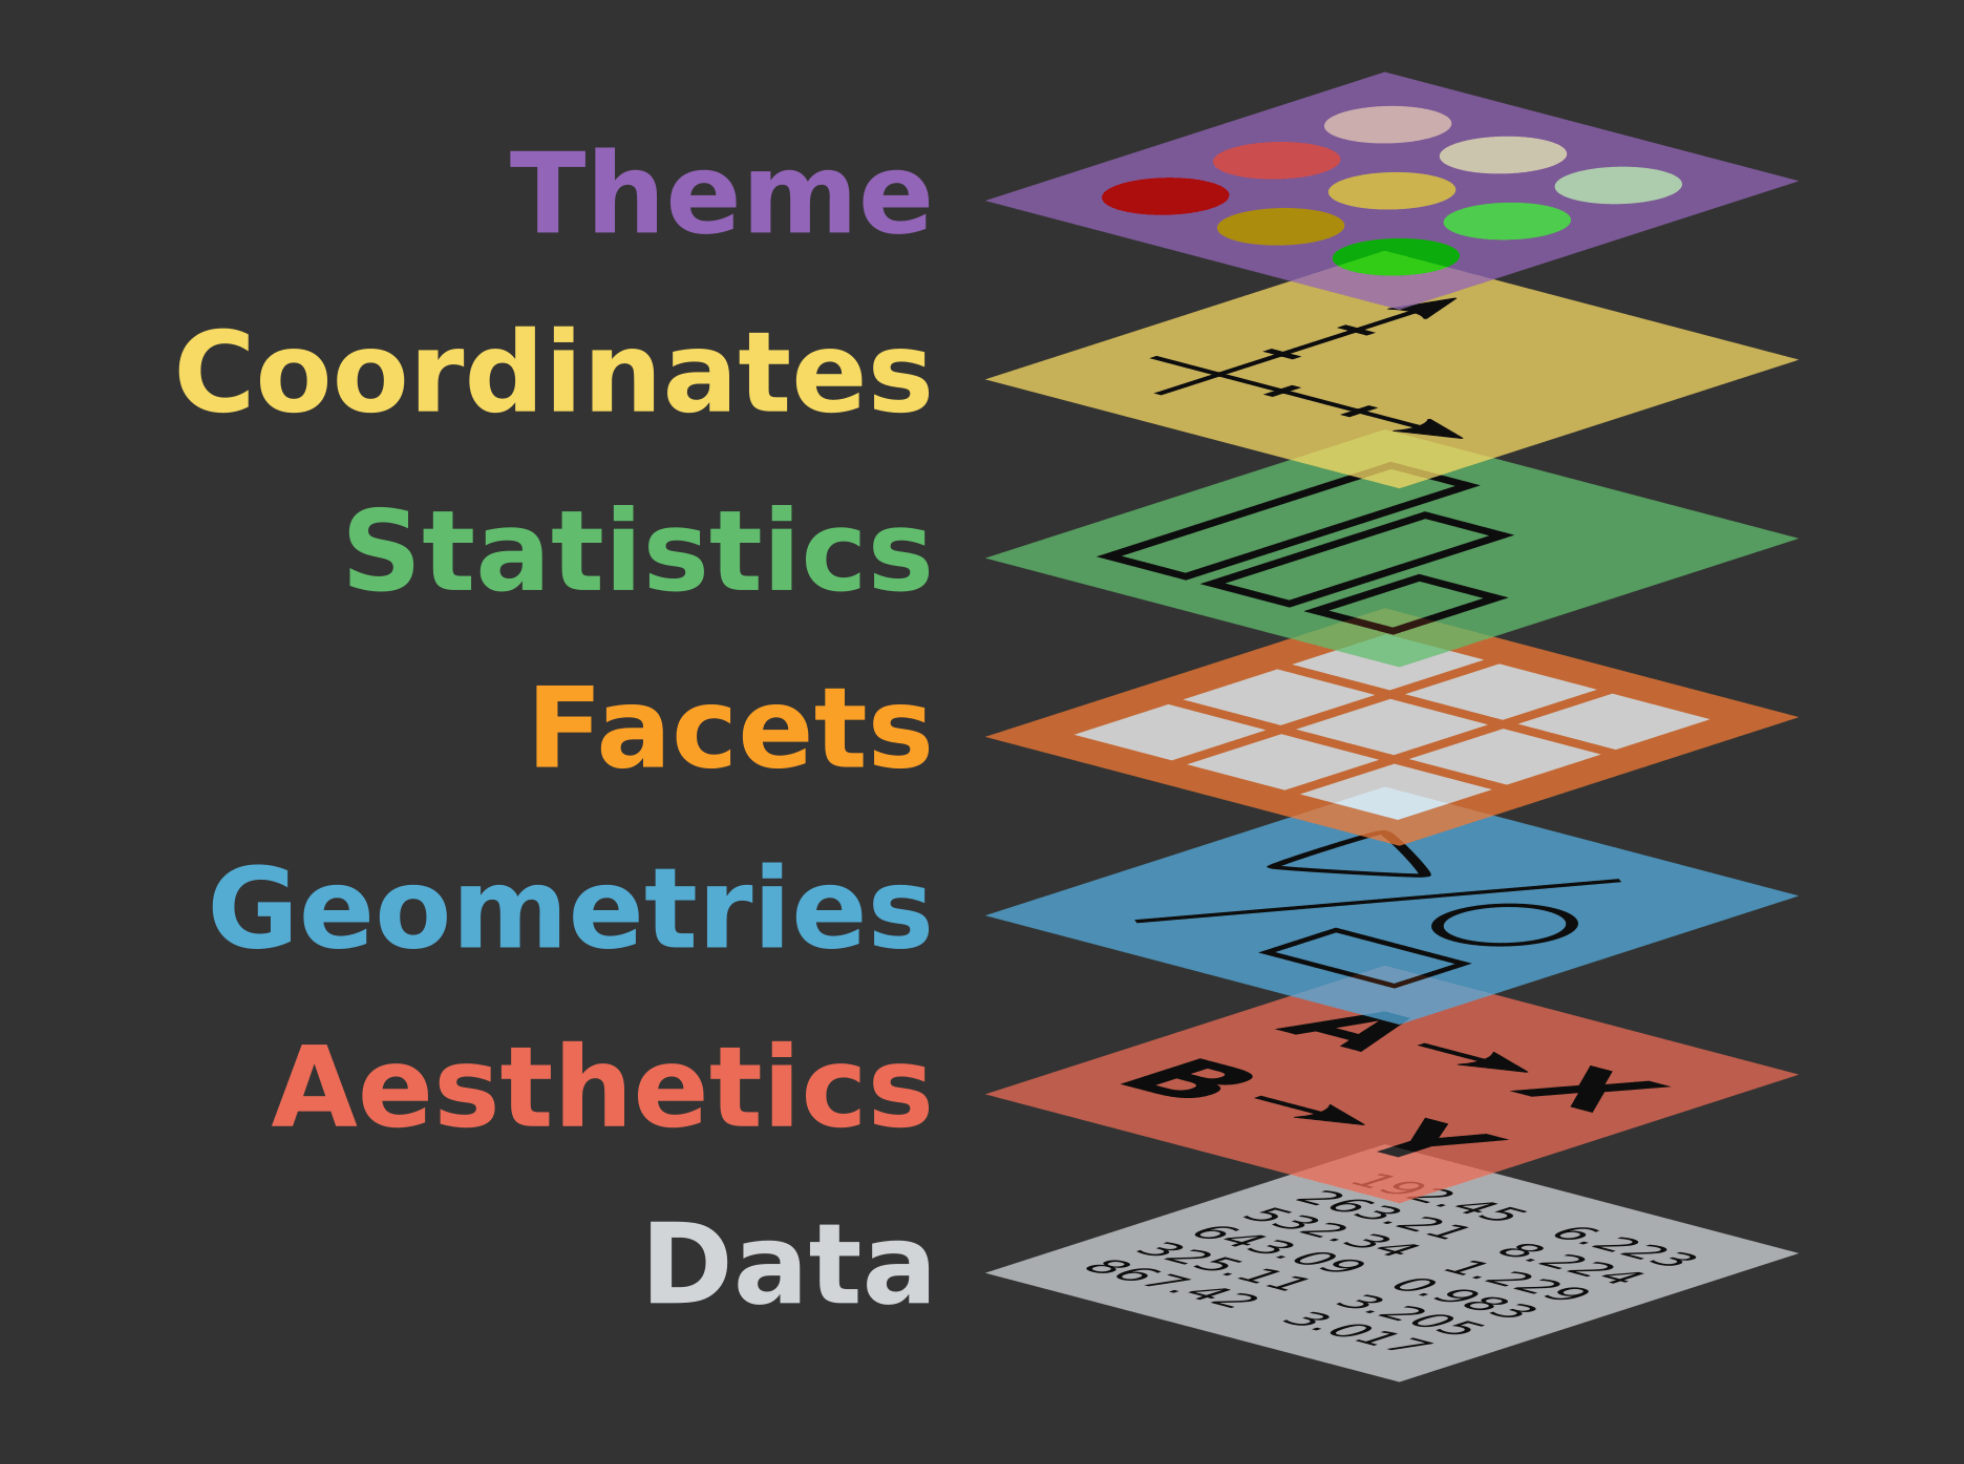
- Data: Input data
- Geom: A geometry representing data. Points, Lines etc
- Aesthetics: Visual characteristics of the geometry. Size, Color, Shape etc
- Scale: How visual characteristics are converted to display values
- Statistics: Statistical transformations. Counts, Means etc
- Coordinates: Numeric system to determine position of geometry. Cartesian, Polar etc
- Facets: Split data into subsets
Building a graph
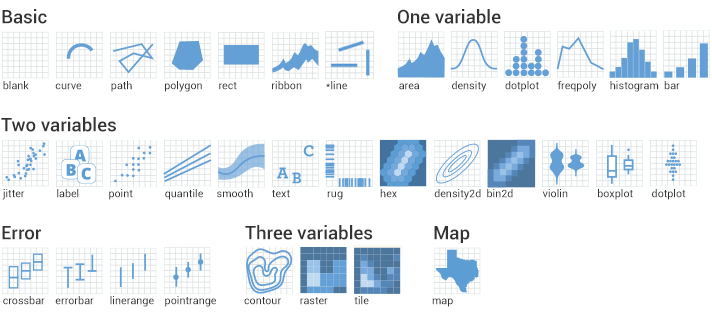
Geoms
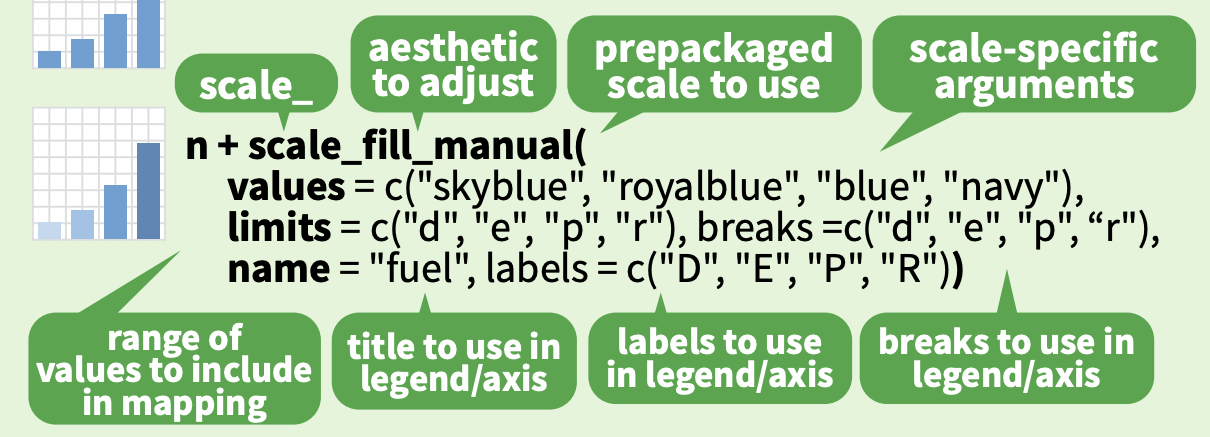
Scales
- If you would like to change the default aesthetics
- scales: position, color, fill, size, shape, alpha, linetype
- syntax:
scale_<aesthetic>_<type>
Discrete Colors:
Thank you. Questions?