Debugging, Profiling, and Optimization

RaukR 2026 • Data Science With R

Marcin Kierczak

18-Aug-2026

What will we be talking about?


  • My code does not run!debugging

  • Now it does run but… out of memory!profiling

  • It runs! It says it will finish in 5 minutes years.optimization

Types of bugs

  • 🔣 Syntax errors
pritnt(var1) 
mean(sum(seq((x + 2) * (y - 9 * b)))
  • 🔢 Arithmetic
y <- 7 / 0

Not in R though! y = Inf

  • 🍎🍊 Type
mean('a')
  • 🧩 Logic

Everything works and produces seemingly valid output that is WRONG!
IMHO those are the hardest 💀 to debug!

How to avoid bugs


  • Encapsulate your code in smaller units 🍱 (functions), you can test, AI can easily evaluate etc.

  • Use classes (OOP module next week) and type checking 🆗.

  • Test 🧪 at the boundaries, e.g. loops at min and max value.

  • Feed your functions with test data 💾 that should result with a known output.

Zoo of errors: the floating point trap


(vec <- seq(0.1, 0.9, by=0.1))
vec == 0.7 
vec == 0.5
[1] 0.1 0.2 0.3 0.4 0.5 0.6 0.7 0.8 0.9
[1] FALSE FALSE FALSE FALSE FALSE FALSE FALSE FALSE FALSE
[1] FALSE FALSE FALSE FALSE  TRUE FALSE FALSE FALSE FALSE


(0.5 + 0.1) - 0.6
(0.7 + 0.1) - 0.8 
[1] 0
[1] -1.110223e-16


How to avoid the trap


round((0.7 + 0.1) , digits = 2) - 0.8
[1] 0

When comparing floating point numbers, instead of this:

(vec <- seq(0.1, 0.9, by=0.1))
vec == 0.7
[1] 0.1 0.2 0.3 0.4 0.5 0.6 0.7 0.8 0.9
[1] FALSE FALSE FALSE FALSE FALSE FALSE FALSE FALSE FALSE

Write this:

epsilon <- 0.001
abs(vec - 0.7) <= epsilon
[1] FALSE FALSE FALSE FALSE FALSE FALSE  TRUE FALSE FALSE

Floating point technicalities

head(unlist(.Machine))
    double.eps double.neg.eps    double.xmin    double.xmax    double.base 
  2.220446e-16   1.110223e-16  2.225074e-308  1.797693e+308   2.000000e+00 
 double.digits 
  5.300000e+01 
head(unlist(.Platform))
                  OS.type                  file.sep                dynlib.ext 
                   "unix"                       "/"                     ".so" 
                      GUI                    endian                   pkgType 
                    "X11"                  "little" "mac.binary.sonoma-arm64" 

Handling Errors with try()

inputs <- list(10, -10, "ten", 42)
for (i in inputs) {
  print(paste0("log10 of ", i, " is ", log10(i)))
}
Error in `log10()`:
! non-numeric argument to mathematical function
[1] "log10 of 10 is 1"
[1] "log10 of -10 is NaN"
for (i in inputs) {
  try(
    print(paste0("log10 of ", i, " is ", log10(i)))
  )
}
[1] "log10 of 10 is 1"
[1] "log10 of -10 is NaN"
Error in log10(i) : non-numeric argument to mathematical function
[1] "log10 of 42 is 1.6232492903979"

Handling Errors with tryCatch

for (i in inputs) {
  tryCatch(
    {
      result <- log10(i)
      print(paste0("log10 of ", i, " is ", result))
    },
    warning = function(w) {
      print(paste0("A warning occured: ", w$message))
    },
    error = function(e) {
      print(paste0("An error occured: ", e$message))
    }
  )
}
[1] "log10 of 10 is 1"
[1] "A warning occured: NaNs produced"
[1] "An error occured: non-numeric argument to mathematical function"
[1] "log10 of 42 is 1.6232492903979"

Debugging – errors and warnings

  • An error in your code will result in a call to the stop() function that:
    • breaks the execution of the program (loop, if-statement, etc.)
    • performs the action defined by the global parameter error.
  • A warning just prints out the warning message (or reports it in another way)
  • Global parameter error defines what R should do when an error occurs.
options(error = )
  • You can use simpleError() and simpleWarning() to generate errors and warnings in your code:
f <- function(x) {
  if (x < 0) {
    x <- abs(x)
    w <- simpleWarning("Value less than 0. Taking abs(x)")
    w
  }
}

Debugging – what are my options?

  • Old-school debugging: a lot of print statements
    • print values of your variables at some checkpoints,
    • sometimes fine but often laborious,
    • need to remove/comment out manually after debugging.
  • Dumping frames
    • on error, R state will be saved to a file,
    • file can be read into debugger,
    • values of all variables can be checked,
    • can debug on another machine, e.g. send dump to your colleague!
  • Traceback
    • a list of the recent function calls with values of their parameters
  • Step-by-step debugging
    • execute code line by line within the debugger

Option 1: dumping frames

f <- function(x) { sin(x) }
options(error = quote(dump.frames(dumpto = "assets/testdump", to.file = T)))
f('test')
options(error = NULL) # reset the behavior
load('assets/testdump.rda')
# debugger(testdump)

Hint: Last empty line brings you back to the environments menu.

Option 2: traceback

f <- function(x) { 
  log10(x) 
}
g <- function(x) { 
  f(x) 
}
g('test')
Error in `log10()`:
! non-numeric argument to mathematical function
> traceback()
2: f(x) at #2
1: g("test")

traceback() shows what were the function calls and what parameters were passed to them when the error occurred.

Option 3: step-by-step debugging

Let us define a new function h(x, y):

h <- function(x, y) { 
  f(x) 
  f(y) 
}

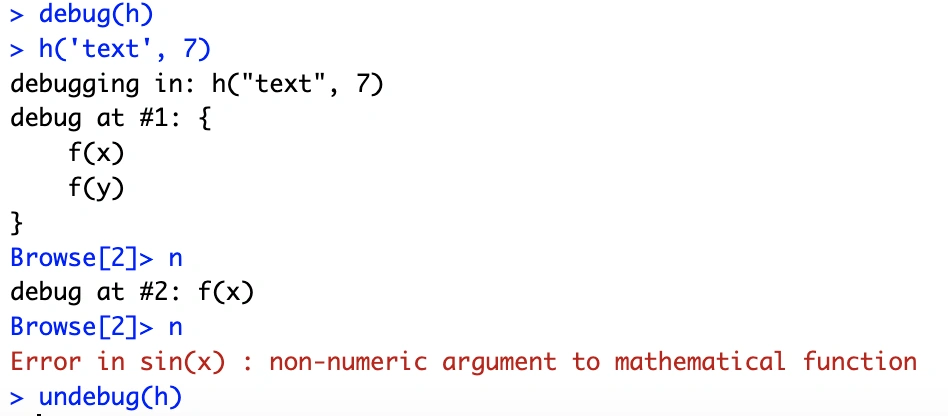
Now, we can use debug() to debug the function in a step-by-step manner:

debug(h)
h('text', 7)
undebug(h)

Profiling – proc.time()

Profiling is the process of identifying memory and time bottlenecks 🍾 in your code.

proc.time()
   user  system elapsed 
  0.761   0.070   0.868 
  • user time – CPU time charged for the execution of user instructions of the calling process,
  • system time – CPU time charged for execution by the system on behalf of the calling process,
  • elapsed time – total CPU time elapsed for the currently running R process.
pt1 <- proc.time()
tmp <- runif(n =  10e5)
pt2 <- proc.time()
pt2 - pt1
   user  system elapsed 
  0.004   0.001   0.004 

Profiling – system.time()

system.time(runif(n = 10e6))
system.time(rnorm(n = 10e6))
   user  system elapsed 
  0.071   0.004   0.075 
   user  system elapsed 
  0.178   0.000   0.178 

An alternative approaches include tic and toc statements from the tictoc package.

tictoc::tic()
tmp1 <- runif(n = 10e6)
tictoc::toc()
0.04 sec elapsed

Profiling – bench::mark()

or mark() from bench package:

dat <- data.frame(
  x = runif(10000, 1, 1000),
  y = runif(10000, 1, 1000)
)
bench::mark(
  dat[dat$x > 500, ],
  dat[which(dat$x > 500), ],
  subset(dat, x > 500)
)
# A tibble: 3 × 6
  expression                     min   median `itr/sec` mem_alloc `gc/sec`
  <bch:expr>                <bch:tm> <bch:tm>     <dbl> <bch:byt>    <dbl>
1 dat[dat$x > 500, ]          78.1µs   88.3µs    11036.     378KB     49.6
2 dat[which(dat$x > 500), ]   71.1µs   77.1µs    12911.     260KB     40.2
3 subset(dat, x > 500)        99.9µs  112.2µs     8822.     511KB     52.4

Profiling in action

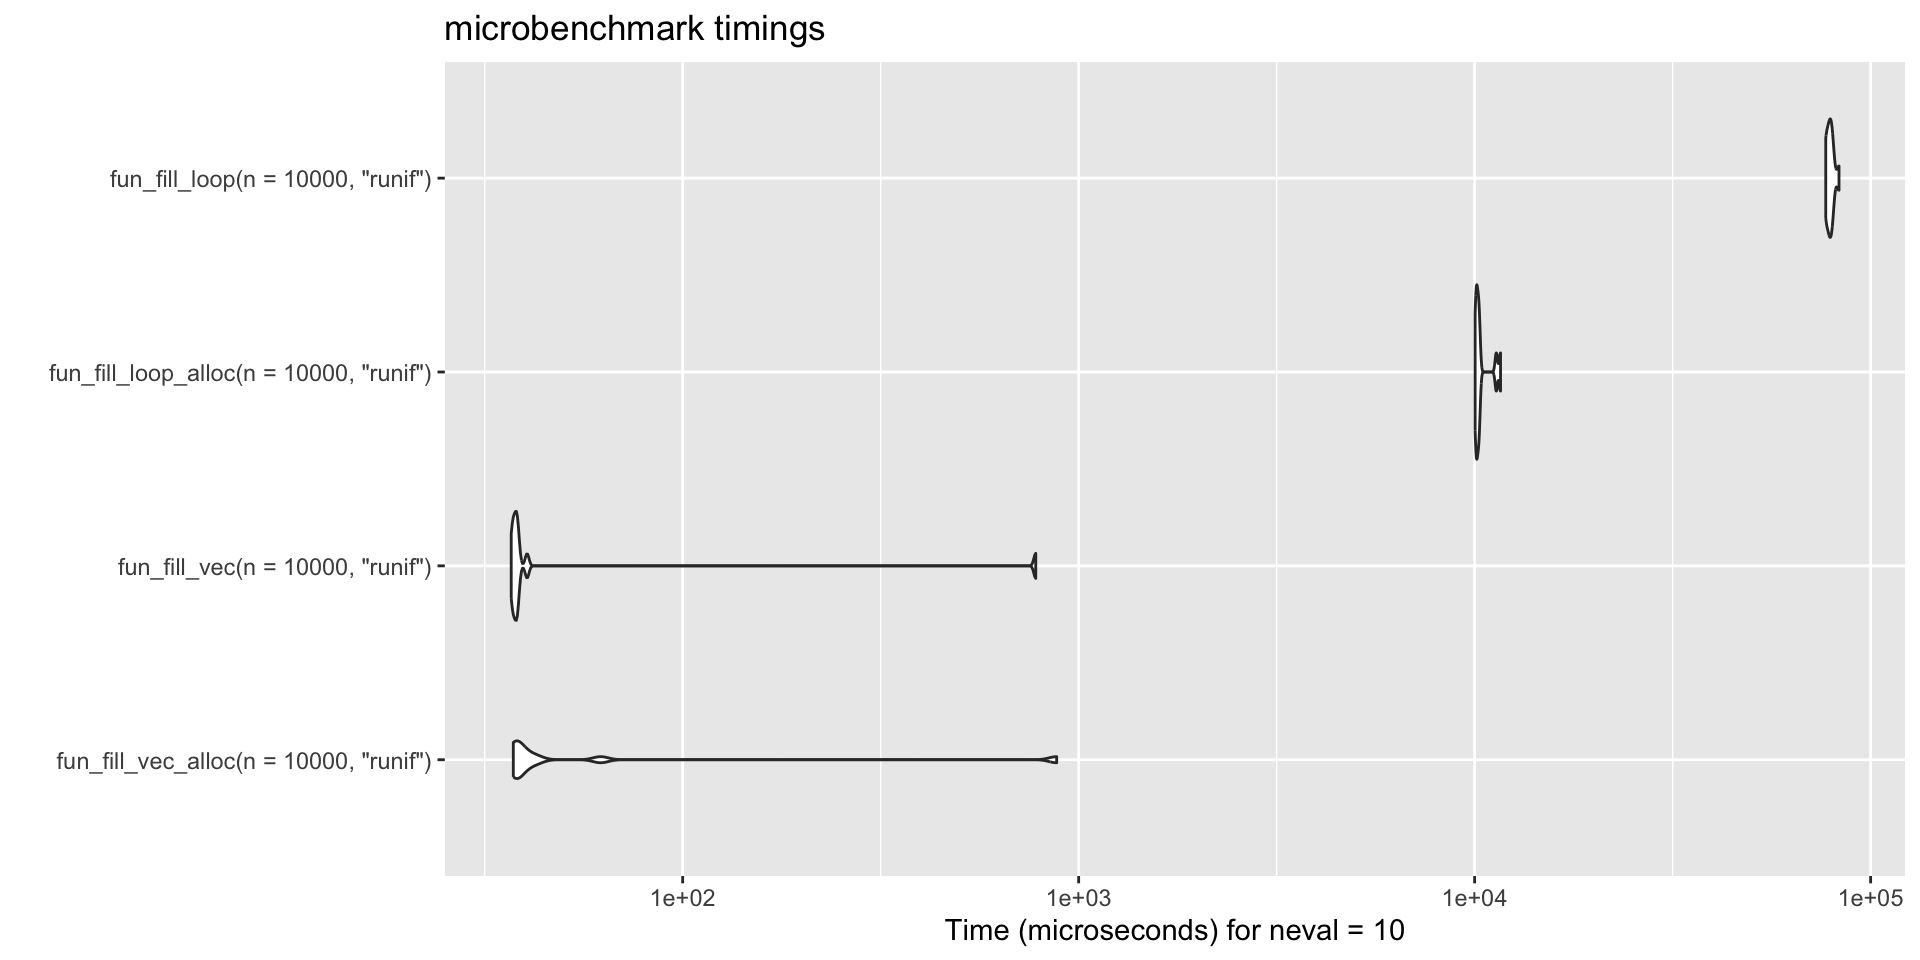
These 4 functions fill a large vector with values supplied by function f.

1 – loop without memory allocation.

fun_fill_loop <- function(n = 10e6, f) {
  result <- NULL
  for (i in 1:n) {
    result <- c(result, eval(call(f, 1)))
  }
  return(result)
}

2 – loop with memory allocation.

fun_fill_loop_alloc <- function(n = 10e6, f) {
  result <- vector(length = n)
  for (i in 1:n) {
    result[i] <- eval(call(f, 1))
  }
  return(result)
}

Profiling in action cted.

But it is maybe better to use…

vectorization!

3 – vectorized loop without memory allocation.

fun_fill_vec <- function(n = 10e6, f) {
  result <- NULL
  result <- eval(call(f, n))
  return(result)
}

4 – vectorized with memory allocation.

fun_fill_vec_alloc <- function(n = 10e6, f) {
  result <- vector(length = n)
  result <- eval(call(f, n))
  return(result)
}

Profiling our functions


benchmark <- microbenchmark::microbenchmark(
  fun_fill_vec_alloc(n = 1e4, "runif"),
  fun_fill_vec(n = 1e4, "runif"),
  fun_fill_loop_alloc(n = 1e4, "runif"),
  fun_fill_loop(n = 1e4, "runif"),
  times = 10L
)

ggplot2::autoplot(benchmark)

Memory profiling

We can include the memory profiling, using, e.g. Rprof() function.

Rprof('profiler_test.out', interval = 0.01, memory.profiling = T)
for (i in 1:5) {
  result <- fun_fill_loop_alloc(n = 1e4, "runif")
  print(head(result))
}
Rprof(NULL)
[1] 0.78279579 0.05264464 0.50698257 0.90737045 0.31946093 0.79888663
[1] 0.6872827 0.6428758 0.9454728 0.1888565 0.3335069 0.7415906
[1] 0.8361113 0.7188930 0.9121614 0.4654298 0.5075432 0.2536313
[1] 0.8306435 0.5007408 0.8382084 0.6722948 0.5235330 0.3564790
[1] 0.7162534 0.5847373 0.5167241 0.5347672 0.2806981 0.8517943

Memory profiling cted.

summary <- summaryRprof("profiler_test.out", memory = "both")
knitr::kable(summary$by.self)
unlink("profiler_test.out")
self.time self.pct total.time total.pct mem.total
“print.default” 0.03 60 0.03 60 34.9
“is.list” 0.01 20 0.01 20 15.0
“runif” 0.01 20 0.01 20 0.0

Optimizing your code

We should forget about small efficiencies, say about 97% of the time: premature optimization is the root of all evil. Yet we should not pass up our opportunities in that critical 3%. A good programmer will not be deluded into complacency by such reasoning, he will be wise to look carefully at the critical code; but only after that code has been identified.

– Donald Knuth
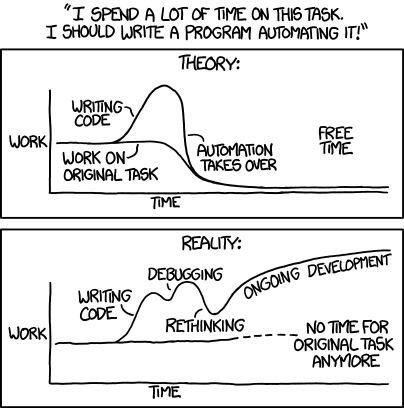

source: https://xkcd.com/1319
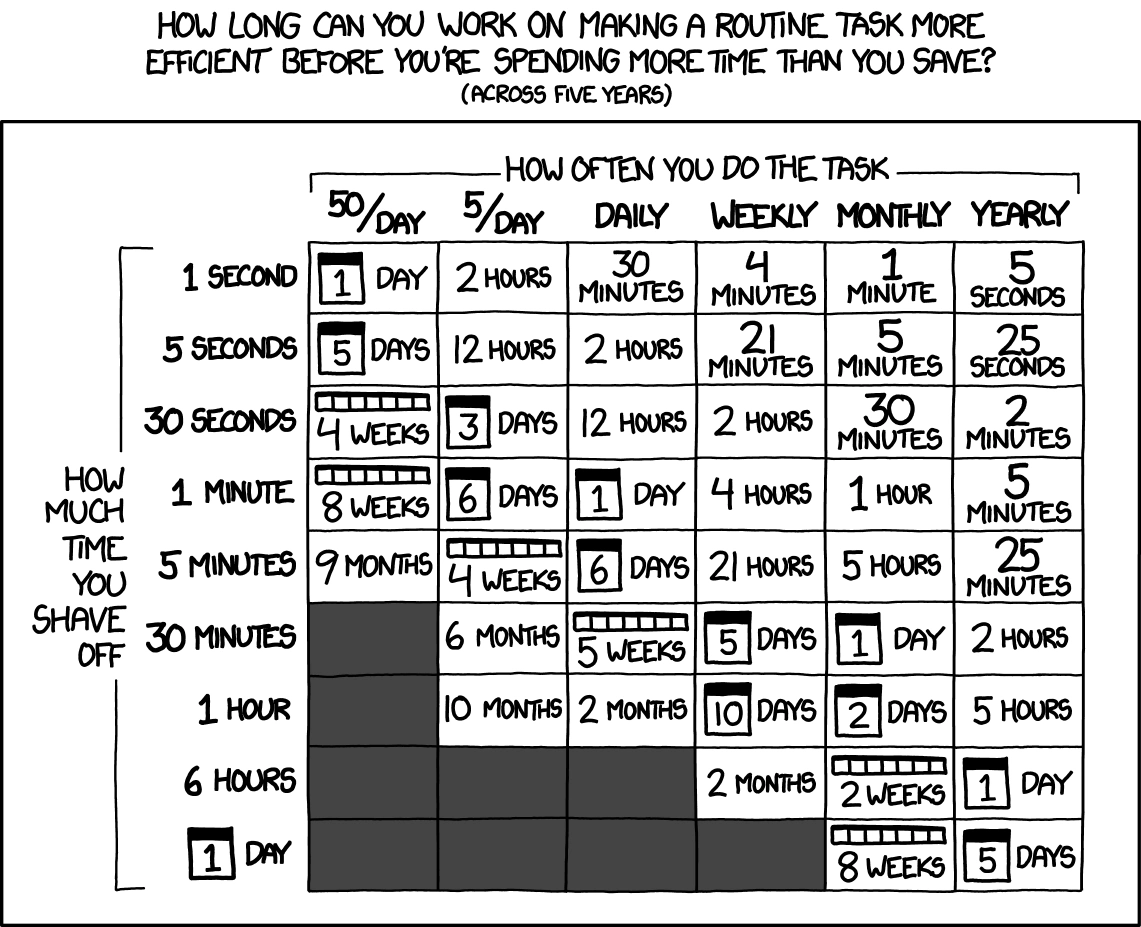

source: https://xkcd.com/1205/

Optimize your code

  • use DT data.table or tibble instead of data.frame
  • avoid loops, use vectorization or *apply when possible
  • allocate memory to avoid copy-on-modify,
  • use futures or mirai for multicore/parallel execution
  • use package BLAS for linear algebra,
  • use bigmemory package,
  • for large matrices consider GPU computations,

Copy-on-modify

order <- 1024
matrix_A <- matrix(rnorm(order^2), nrow = order)
matrix_B <- matrix_A

Check where the objects are in the memory:

lobstr::obj_addr(matrix_A)
lobstr::obj_addr(matrix_B)
[1] "0xca2800000"
[1] "0xca2800000"

What happens if we modify a value in one of the matrices?

matrix_B[1,1] <- 1
lobstr::obj_addr(matrix_A)
lobstr::obj_addr(matrix_B)
[1] "0xca2800000"
[1] "0xca3400000"

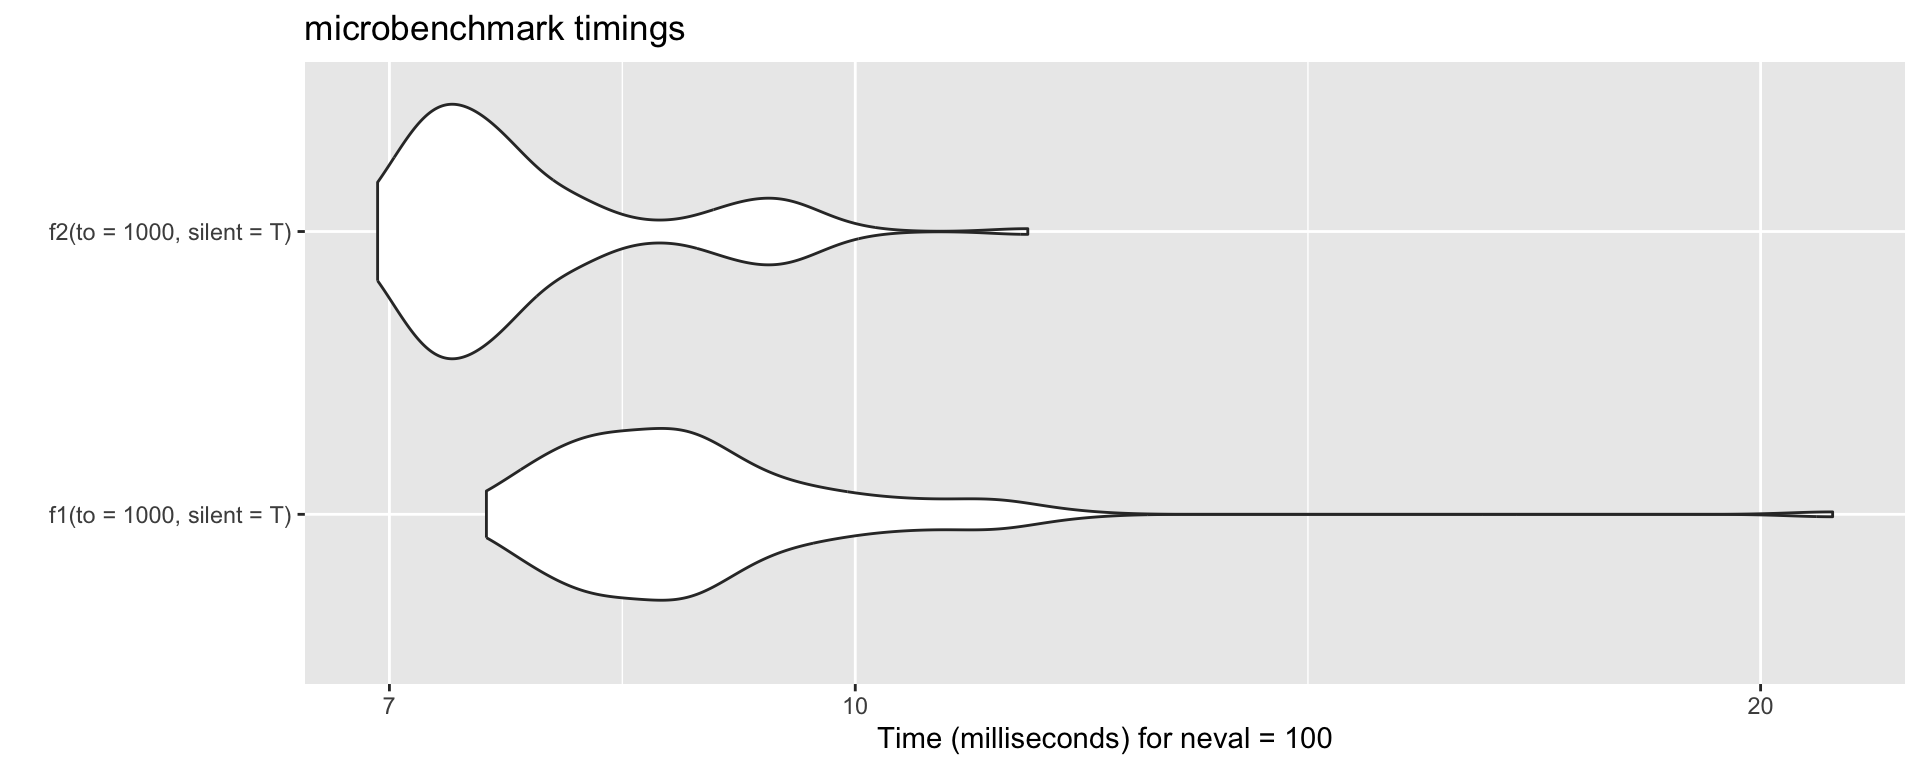
Avoid copying by allocating memory

No memory allocation

f1 <- function(to = 3, silent=F) {
  tmp <- c()
  for (i in 1:to) {
    a1 <- lobstr::obj_addr(tmp)
    tmp <- c(tmp, i)
    a2 <- lobstr::obj_addr(tmp)
    if (!silent) { print(paste0(a1, " --> ", a2)) } 
  }
}
f1()
[1] "0x10203c100 --> 0x718fc99d8"
[1] "0x718fc99d8 --> 0x718fc9ee0"
[1] "0x718fc9ee0 --> 0x719ff8d48"

Avoid copying by allocating memory cted.

With memory allocation

f2 <- function(to = 3, silent = FALSE) {
  tmp <- vector(length = to, mode='numeric')
  for (i in 1:to) {
    a1 <- lobstr::obj_addr(tmp)
    tmp[i] <- i
    a2 <- lobstr::obj_addr(tmp)
    if(!silent) { print(paste0(a1, " --> ", a2)) }
  }
}
f2()
[1] "0x718fb2828 --> 0x718fb2828"
[1] "0x718fb2828 --> 0x718fb2828"
[1] "0x718fb2828 --> 0x718fb2828"

Allocating memory – benchmark.

library(microbenchmark)
benchmrk <- microbenchmark(f1(to = 1e3, silent = T), 
                           f2(to = 1e3, silent = T), 
                           times = 100L)
ggplot2::autoplot(benchmrk)

Function vectorization — the problem

is_a_droid <- function(x) {
  droids <- c("2-1B", "4-LOM", "8D8", "0-0-0", "AP-5", "AZI-3", "Mister Bones", "BB-8", "BB-9E", "BD-1", "BT-1", "C1-10P", "C-3PO", "R2-D2")
  if (x %in% droids) {
    return(T)
  } else {
    return(F)
  }
}

test <- c("Anakin", "Vader", "R2-D2", "AZI-3", "Luke")
is_a_droid(test)
Error in `if (x %in% droids) ...`:
! the condition has length > 1

Function vectorization — possible solution(s)

The base::Vectorize way:

vectorized_is_a_droid <- base::Vectorize(is_a_droid, vectorize.args = c("x"))
vectorized_is_a_droid(test)
Anakin  Vader  R2-D2  AZI-3   Luke 
 FALSE  FALSE   TRUE   TRUE  FALSE 

vapply way:

vapply(test, is_a_droid, FUN.VALUE = TRUE) # value type-safe sapply
Anakin  Vader  R2-D2  AZI-3   Luke 
 FALSE  FALSE   TRUE   TRUE  FALSE 

purrr way:

purrr::map(test, is_a_droid) %>% unlist()
[1] FALSE FALSE  TRUE  TRUE FALSE

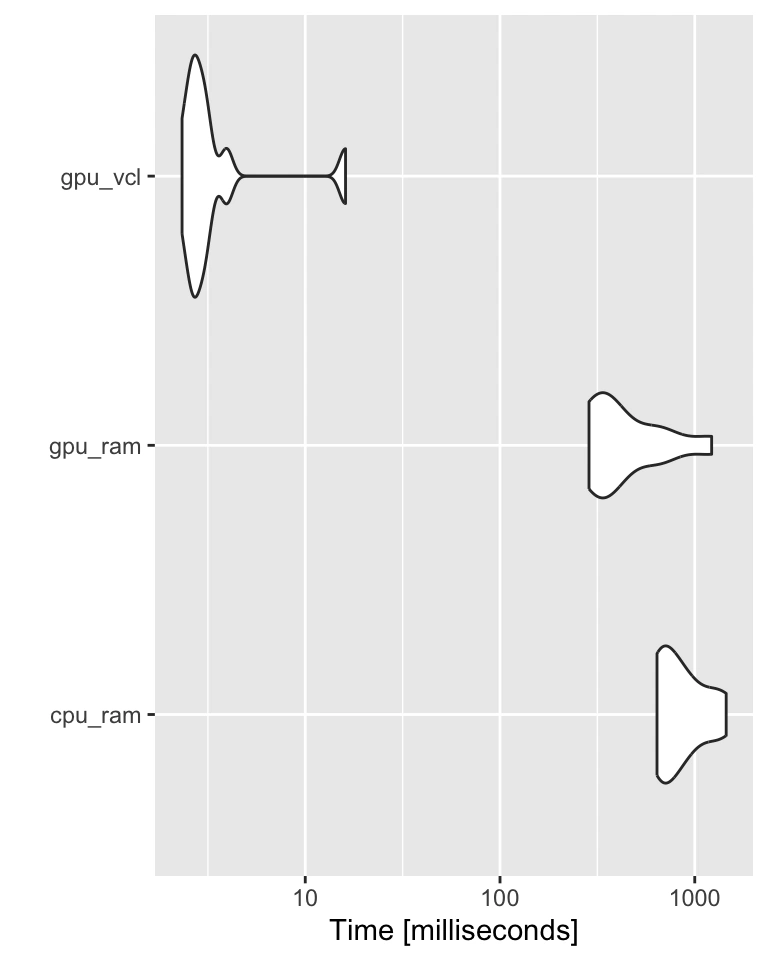
GPU with gpuR

A = matrix(rnorm(1000^2), nrow=1000) # stored: RAM, computed: CPU
B = matrix(rnorm(1000^2), nrow=1000) 
gpuA = gpuMatrix(A, type = "float") # stored: RAM, computed: GPU
gpuB = gpuMatrix(B, type = "float")
vclA = vclMatrix(A, type = "float") # stored: GPU, computed: GPU
vclB = vclMatrix(B, type = "float")
bch <- microbenchmark(
  cpu_ram = A %*% B,
  gpu_ram = gpuA %*% gpuB,
  gpu_vcl = vclA %*% vclB, 
  times = 10L) 

More on Charles Determan’s Blog.

GPU cted.

ggplot2::autoplot(bch)

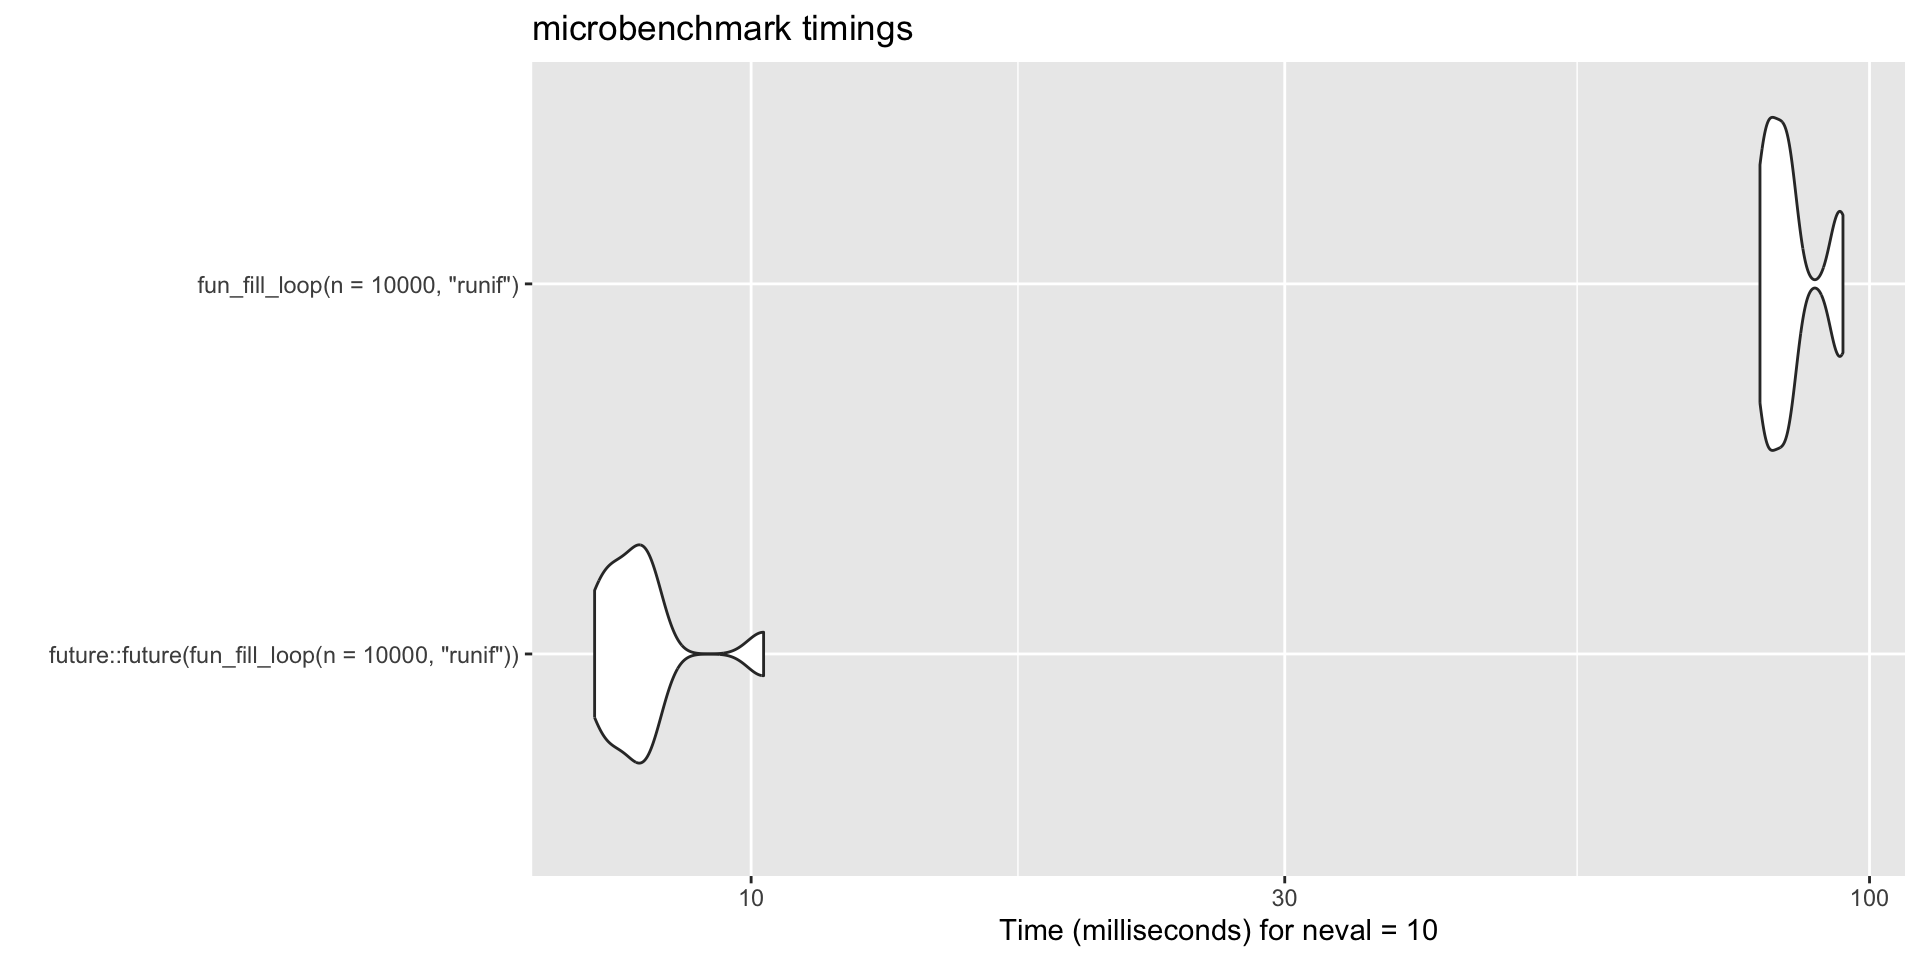
Parallel execution using future

future::plan('multisession')

benchmark <- microbenchmark::microbenchmark(
  future::future(fun_fill_loop(n = 1e4, "runif")),
  fun_fill_loop(n = 1e4, "runif"),
  times = 10L
)
ggplot2::autoplot(benchmark)

Thank you!

Questions?

2026 • SciLifeLabNBISRaukR