tidymodels - introduction
RaukR 2023 • Advanced R for Bioinformatics
Max Kuhn
20-Jun-2023
About me
- Becton-Dickinson (6y): molecular diagnostics for infectious diseases, non-clinical and clinical
- Pfizer (12y): nonclinical, Med chem, Comp {bio,chem} support
RStudioposit PBC (>= 2016): modeling packages
Selected R packages: caret, C50, Cubist, a lot of tidymodels
Some basic advice
- ML models are really bad at determining/quantifying associations and evaluating hypotheses
- You almost certainly don’t need deep learning unless you have a ton of images.
- Basic statistic (e.g. ANOVA, linear regression, etc) go a long way.
- Clustering is over-rated and over-used.
- Analyze your measurement systems.
- Always have a data set that could contradict what you think that you know.
- The only way to be comfortable with your data is to never look at them.
The Whole Game
We often begin with a very high-level view of a data analysis project from start to finish.
The goal is to give you a sense of strategy instead of a series of tactics.
I’ll focus on predictive modeling (aka machine learning) on some biological data.
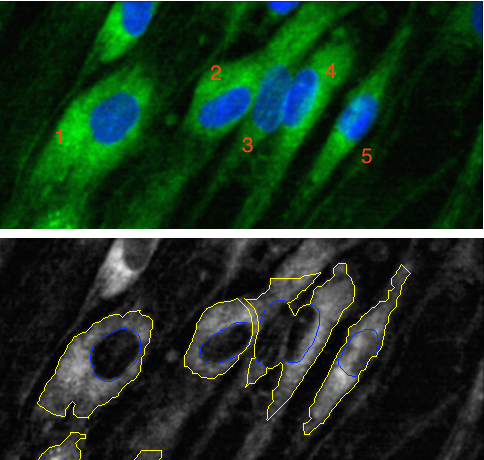
Cell Segmentation Data
Hill, LaPan, Li and Haney (2007) develop models to predict which cells in a high content screen were well segmented.
The data consists of 56 imaging measurements on 2019 cells.
The outcome class is contained in a factor variable called class with levels PS for poorly segmented and WS for well segmented.
What is the goal
The authors ran a high-content screening lab and were looking for a tool to:
- validate/characterize different image analysis parameters.
- pre-filter cells prior to analysis/modeling.
So their goal is to do their best to predict bad image data.
There’s not much inference/understanding that is required; be as accurate as possible.
Data Usage
We will immediately split the data into training and testing sets (80% / 20%).
What are some interesting features of these data? We’ll only use our training set to investigate.
Some key features
class imbalance

Clusters of highly correlated features

Feature Engineering
This describes the process of having good representations of your predictors so that the model has the easiest possible time fitting the data.
For the multicollinearity, we could:
- Do nothing and see how that works
- Maybe try feature extraction (e.g. PCA, PLS, and similar)
- Filter out predictions to reduce correlations
- Use a model that is resistant to multicollinearity.
How will we measure performance
We have to classes; there are a lot of options:
- Accuracy and similar.
- ROC and PR curves
- Brier scores
We’ll compute all of these but will focus on Brier scores
The process of building a model

Logistic regression
I usually start simple. Logistic regression is a commonly used model (both for prediction and inference).
We’ll try different versions of logistic regression as well as with different feature representations.
To get good measures of performance, we will use resampling methods to compute our results.
Logistic regression results

Filtering results

The best model retained 49 predictors out of 56.
Partial Least Squares Results

Evaluating More Models
At this point we would try different models too (e.g. boosting, etc).
From brevity, we’ll stop here to illustrate what occurs next.
Let’s choose a PLS logistic model as our “final model.”
How does this fit work with the test set?
The Brier score was 0.126.
Test Set Predictions

Test Set Calibration