Overview
Teaching: 20 min
Exercises: 15 minQuestions
What are good practices for structuring data and metadata in spreadsheets?
Objectives
Understand what to consider when using spreadsheets in a project or working group
Adopt good practices for structuring tabular data in spreadsheets
About this episode
We tend to organize data in spreadsheets as we humans want to work with the data, but computers and humans see it in different ways. In order to use tools that make computation more efficient, we need to structure our data the way that computers need it. This episode will cover:
- About this episode
- Good practices for structuring data tables
- Tips and tricks for working with spreadsheets
- Avoiding multiple tables
- Avoiding multiple tabs
- Zero vs. Missing data
- Bad null values (missing data)
- Avoid using formatting to add information
- Placing comments or units in cells
- More than one kind of information in a cell
- Field name problems
- Avoid special characters in data
- Avoid including metadata in spreadsheet
- Using different date formats
- Exercise 9
- Hints and Solution
- Further reading
Good practices for structuring data tables
The most common mistake made is treating spreadsheet programs like lab notebooks, i.e relying on context, colors, notes in the margin, and spatial layout of data and fields, to convey information. Humans can (usually) interpret such information, but computers view information differently. Unless we explain what everything means (and that can be hard!), a computer will not be able to see how our data fits together.
Setting up well-formatted tables early in the research process is extremely important – before you even start entering data. Once data is entered, even from a trial or test, we are less motivated to make changes to the format itself.
Data organization can make it easier or harder to work with data. Your future self might not agree with your present self on the best input format!
Early metadata
An important thing to consider is to adapt to using metadata standards early in the research phase. Adopting a metadata standard for your collected data, and sticking to it, will make later phases much easier. A dataset pre-adapted to publication will be the source of far less headache than a non-adapted.
Note
The best layouts/formats (as well as software and interfaces) for data entry and data analysis might be different. It is important to take this into account, and ideally automate the conversion from one to another.
Keeping track of your analyses
When working with spreadsheets during data clean-up or analyses, it is very easy to end up with a spreadsheet that looks different from what you started with. In order to be able to reproduce your analyses or figure out what you did when your team or supervisor asks for a different analysis, you must:
-
…create a new file or tab with your cleaned or analyzed data.
Do not modify the original dataset, or you will never know where you started! -
…keep track of the steps you took in your clean up or analysis.
You should track these steps as a researcher would each step in an experiment. You can do this in another text file, or a good option is to create a new tab in your spreadsheet with your notes. This way the notes and data stay together.
This might be an example of a spreadsheet setup:
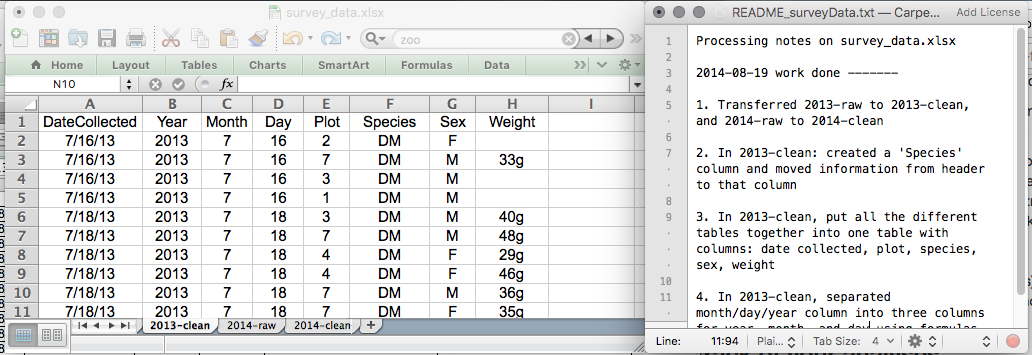
We will put these principles into practice today during the exercise.
How to structure data tables in spreadsheets
The cardinal rules of using spreadsheet programs for data:
- Put all your variables in columns - the thing you are measuring, like ‘length’ or ‘attendance’.
- Put each observation in its own row.
- Don’t combine multiple pieces of information in one cell. Sometimes it just seems like one thing, but think if that is the only way you want to be able to use or sort that data.
- Leave the original (raw) data raw - don’t mess with it!
- Export the cleaned data to a text-based format like CSV. This ensures that anyone can use the data (remember the I in FAIR?), and is the format required by most data repositories.
To illustrate, we will use participant data from a workshop. Different people have entered data in to a spreadsheet to keep track of things like date, number of attendees, and who delivered the workshop.
If they were to keep track of the data like this:
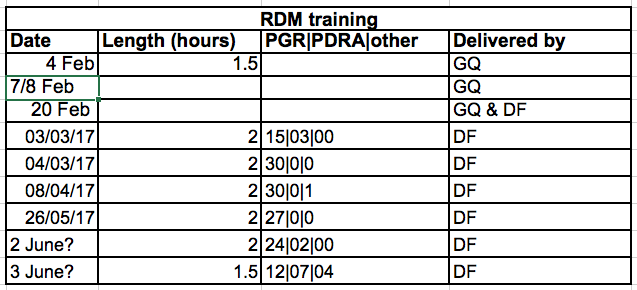
the problem is that attendees are split in types (post-graduate researcher (PGR), post-doctoral research associate (PDRA), and other), but retained in the same cells. If we want to look at attendance by type, it would be hard to set up the data. If instead we split attendee categories in different columns, it would be much easier.
Columns for variables and rows for observations
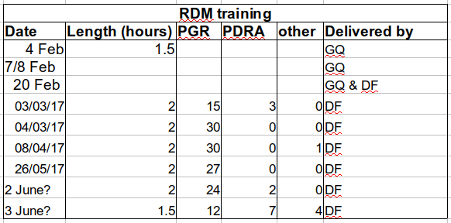
The rule of thumb, when setting up a datasheet, is columns = variables, rows = observations, cells = data (values).
So, instead we should have:
Tips and tricks for working with spreadsheets
Many things can happen when we enter data into a spreadsheet. Without claiming a comprehensible list, some of the things we can consider to make it easier for ourselves are:
Avoiding multiple tables
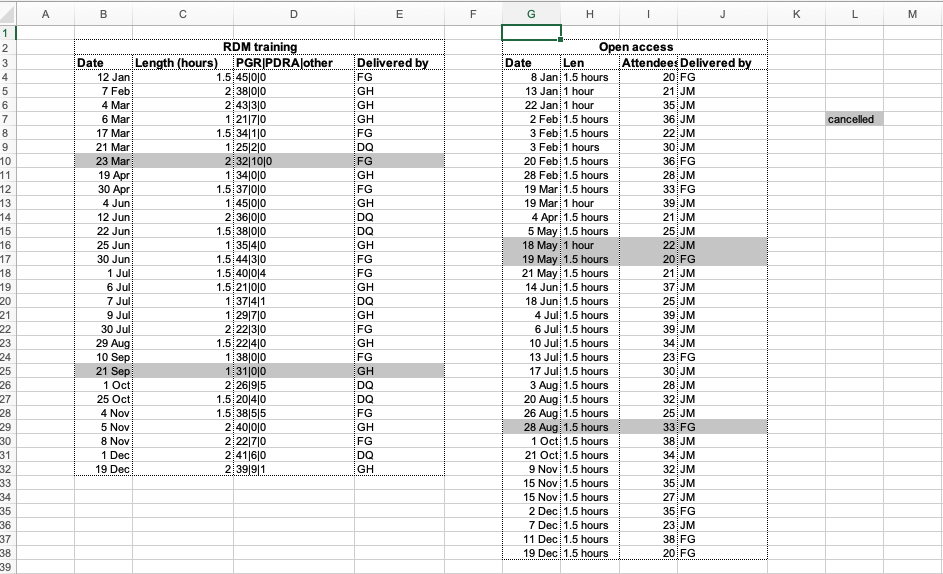
A common strategy is creating multiple data tables within one spreadsheet tab. This confuses the computer, avoid at all cost!. Multiple tables within one spreadsheet create false associations between cells for the computer, which sees each row as an observation. You are also potentially using the same field name in multiple places, which will make it harder to clean your data up into a usable form.
The example below depicts the problem:
Avoiding multiple tabs
Many tabs are good tabs, right? Well, yes and no. Creating extra tabs make the computer miss data connections that are there (which must be re-introduced using spreadsheet application-specific functions, or scripting). Say, for instance, you make a separate tab for each year.
Try to avoid it for two reasons:
- You are more likely to accidentally add inconsistencies to your data.
- You add an extra step for yourself before an analysis because you need to combine the data into a single data table.
Your datasheet might end up being very extensive over the course of recording data, making it harder to enter data and maintain an overview. For spreadsheets with many rows, use a Freeze Pane or Fixed Header function (do NOT repeat header rows!).
Documentation on how to freeze column headers in Microsoft Excel
Documentation on how to freeze column headers in LibreOffice Calc
Zero vs. Missing data
A spreadsheet cell missing data can be replaced with a zero (0), right? Zero participants at an event can be replaced by no value, because none showed up, right?
Wrong!
To a computer, a zero is data. You measured or counted it, and it was zero. A blank cell means no measurement at all, and the computer will interpret it as a null value. Leaving zero data blank is not good in a written format, but it is NEVER okay when you move your data into a digital format.
Bad null values (missing data)
How do you make explicit something that does not exist (a null value)?
Example: using -999 or other numerical values (or zero).
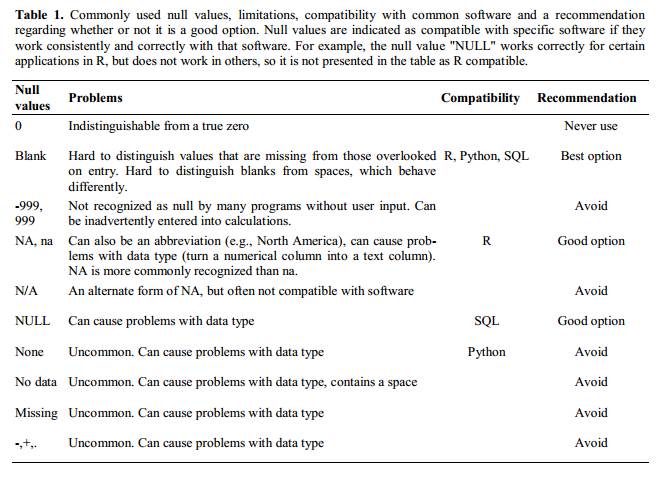
Solution: To many statistical programs a numeric value can never be a null. It will depend on the final application of your data and how you intend to analyse it, but it is essential to use a clearly defined and CONSISTENT null indicator. Blanks (most applications) and NA (for R) are good choices.
From White et al., 2013, Nine simple ways to make it easier to (re)use your data. Ideas in Ecology and Evolution:
Avoid using formatting to add information
Example: Colours! (The more the merrier). Separating data by blank rows. Merging cells to make text viewable.
Solution: Simple. If you cannot add information as data in a row, move it to documentation/README. If you cannot see all text in a cell, make cell wider. Merged cells can really mess up the machine readability of data!
Placing comments or units in cells
Example: You doubt the data quality of a cell and want to comment on it.
Solution: Add comments in separate cells, or in a separate tab referencing the cells in question.
More than one kind of information in a cell
Example:
You want to add linked but static data to a cell in a spreadsheet. For example, an experiment was run on mice mus with phenotype wrinkled skin wrinsk, caused by presence + of gene variant Prss21. So I can add that data in a single column as mus_wrinsk_Prss21+, and code data as present/absent, right? No.
Solution: Never include more than one piece of information in a cell! Design your datasheet to include a column for each type of data. The organism is one kind of data, the phenotype a separate kind, etc. Place each one in its own column, even if it seems unnecessary!
Field name problems
If possible, decide on a pre-defined controlled vocabulary prior to collecting your data. Doing so will make later data publications much easier since your data is pre-adapted to the submission requirements.
For field names do not include spaces, numbers, or special characters of any kind. Underscores (_) are a good alternative to spaces and consider writing names in camel-case (LikeThis.txt) to improve readability. Remember that abbreviations making sense today may not be so obvious tomorrow.
Examples:
| Good Name | Good Alternative | Avoid |
|---|---|---|
| Max_temp_C | MaxTemp | Maximum Temp (°C) |
| Precipitation_mm | Precipitation | precmm |
| Mean_year_growth | MeanYearGrowth | Mean growth/year |
| sex | - | M/F |
| length | - | l |
| cell_type | CellType | Cell Type |
| Observation_01 | first_observation | 1st Obs |
Avoid special characters in data
Example: You treat Excel as a word processor when writing notes, even copying data directly from Word or other applications.
Solution: When writing longer text in a cell, avoid using things like line breaks and em-dashes. Be careful when copying data/test in from applications such as Word. Formatting and fancy non-standard characters can cause issues when exported to other software, such as the appearance of sudden line breaks. Treat all text as simple unformatted text.
Avoid including metadata in spreadsheet
Example: You add a legend at the top or bottom of your data table explaining column meaning, units, exceptions, etc.
Solution: Same as before, move all explanations to a separate tab or a separate cross-referenced document.
Using different date formats
Example: You enter a full date as the value in a column.
Solution: It may seem the most natural way to record dates is to write them as you say them. Spreadsheet programs have numerous “useful features” which allow them to “handle” dates, but it actually is not a good practice. Even if the spreadsheet application will display the dates in a seemingly correct way (to the human eye), how it actually handles and stores the dates may be problematic.
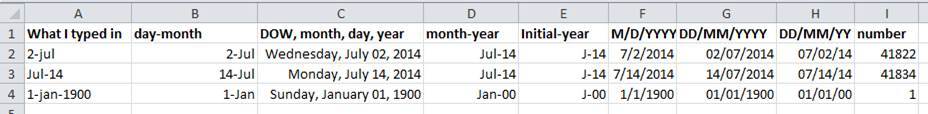
Excel stores dates as a number - see the last column in the above figure. Essentially, it counts the days from a default of December 31, 1899, and thus stores July 2, 2014 as the serial number 41822.
If possible, stick to the international ISO standard date format - YYYY-MM-DD, especially if you are collaborating with colleagues used to other date formats. It will save you a lot of headaches, we promise!
Exercise 9
We are going to take a messy version of some data and begin cleaning it up using the information, tips and tricks listed above. (Remember to create a new file for the cleaned data, and never modify the original (raw) data.)
- First download the data
- Open up the data in a spreadsheet program (i.e. Excel).
- You can see that there are two tabs. Various people have recorded training attendance statistics over 2016 and 2017 for two kinds of training activities, and they have made notes and kept track of the data in their own way. Now you are being asked to evaluate the training programme, and you want to be able to run a few statistical analyses. You need to make the data more machine-readable.
- Together with the person next to you, work on the data to make it both human-readable and machine-readable. Clean up the 2016 and 2017 tabs, and see if all data can be merged in an easier way.
- Think of a way to document what you have done, so that your future you understand the changes that were made. Where do you store that information?
Hints and Solution
- Can the data potentially be merged into a single tab?
- The colours used to mark cells are not explained. Is it useful to retain such information?
- The diagrams are only visualisations of some of the data. They can be easily reproduced elsewhere and may mask other information. Can they be removed from the spreadsheet?
- It seems the attendee data is entered in a non-compatible way across the different tabs. Is there a risk of information loss, or can you merge data using the smallest common denominator approach?
- Would you store documentation of changes within or outside of the spreadsheet? Why and how?
- A suggestion on how the data can be cleaned and organised can be downloaded here
Further reading