Overview
Teaching: 15 min
Exercises: 20 minQuestions
How can we bring our data into OpenRefine?
How can we sort and summarize our data?
How can we find and correct errors in our raw data?
Objectives
Create a new OpenRefine project from a CSV file.
Understand potential problems with file headers.
Use facets to summarize data from a column.
Use clustering to detect possible typing errors.
Understand that there are different clustering algorithms which might give different results.
Employ drop-downs to remove white spaces from cells.
Employ drop-downs to split values from one column into several columns.
Manipulate data using previous steps with undo/redo.
Lesson
Creating a new OpenRefine project
In Windows, you can start the OpenRefine program by double-clicking on the openrefine.exe file. Java services will start automatically on your machine, and OpenRefine will open in your browser. On a Mac, OpenRefine can be launched from your Applications folder. If you are using Linux, you will need to navigate to your OpenRefine directory in the command line and run ./refine.
OpenRefine can import a variety of file types, including tab separated (tsv), comma separated (csv), Excel (xls, xlsx), JSON, XML, RDF as XML, and Google Spreadsheets. See the OpenRefine Importers page for more information.
In this first step, we’ll browse our computer to the sample data file for this lesson. In this case, we will be using a data set very similar to the one we used in the previous metadata module, obtained from a covid-19 study. Instructions on downloading the data are available in Setup.
Once OpenRefine is launched in your browser, the left margin has options to Create Project, Open Project, or Import Project. Here, we will create a new project:
- Click
Create Projectand selectGet data fromThis Computer. - Click
Choose Files, orBrowse...and select the filesamples_openrefine_lesson.csvthat you downloaded in the setup step. ClickOpenor double-click on the filename. - Click
Next>>under the browse button to upload the data into OpenRefine. -
OpenRefine gives you a preview - A chance to show you it understands the file. If, for example, your file was really tab-delimited, the preview might look strange. You would then choose the correct separator in the box shown and click
Update Preview(middle right). If this is the wrong file, click<<Start Over(upper left). There are also options to indicate whether the dataset includes column headers and whether OpenRefine should skip a specified number of rows before reading the data.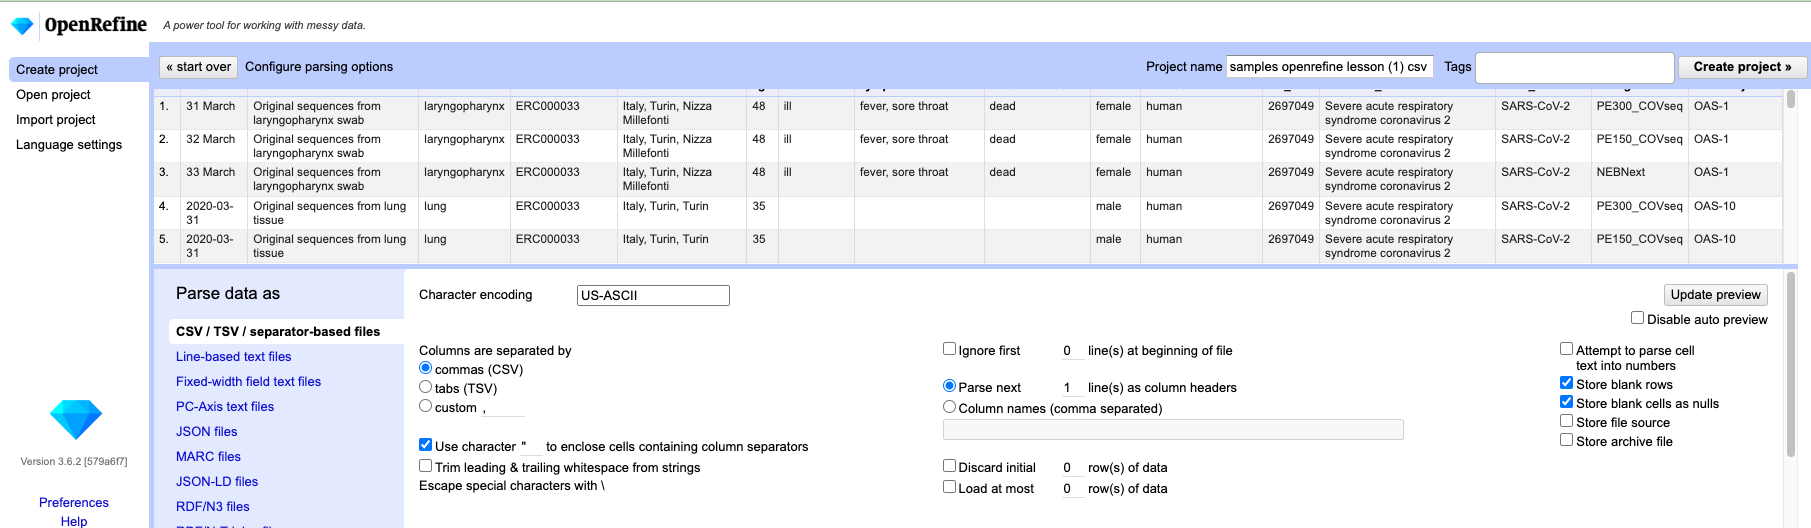
- If all looks good, click
Create Project>>(upper right). You will now enter edit mode for the project you just created.
Note that at step 1, you could upload data in a standard form from a web address by selecting Get data from Web Addresses (URLs). However, this won’t work for all URLs.
Using Facets
Exploring data by applying multiple filters
Facets are one of the most useful features of OpenRefine and can help you get an overview of the data in a project as well as bring more consistency to it. OpenRefine supports faceted browsing as a mechanism for
- seeing a big picture of your data, and
- filtering down to just the subset of rows that you want to change in bulk.
A ‘Facet’ groups all the like values that appear in a column, and then allow you to filter the data by these values and edit values across many records at the same time.
One type of Facet is called a ‘Text facet’. This groups all the identical text values in a column and lists each value with the number of records it appears in. The facet information always appears in the left-hand panel of the OpenRefine interface.
Here, we will use faceting to begin looking for potential errors in data entries in the sex column.
- Scroll over to the
sexcolumn. - Click the down arrow and choose
Facet>Text facet. - In the left panel, you’ll now see a box containing every unique value in the
sexcolumn along with a number representing how many times that value occurs in the column. - Try sorting this facet by name and by count. Do you notice any problems with the data? What are they?
- Hover the mouse over one of the names in the
Facetlist. You should see that aneditfunction appears on the right. - You could use this to fix an error immediately, and OpenRefine will ask whether you want to make the same correction to every value it finds like that one. However, OpenRefine offers even better ways to find and fix these errors, which we’ll use instead. We’ll learn about these when we talk about clustering.
Solution
male.F,f,femaleandFemalerefer to the same sex, as doM,m,Maleandmale. We will see how to correct these misspelt and mistyped entries in a later exercise.
Exercise 1.1
Using faceting, find out how many values the dataset contains in the column
location.What is the column format (text, date, or numbers)?
In the column
date, useText Facetto identify how many unique entries there are.Use faceting to produce a timeline display for the column
date. You will need to useEdit cells>Common transforms>To dateto convert this column to dates.During which day were most of the samples registered, and what happened to the data in cells not conforming to a proper date format?
Solution
- For the column
locationdoFacet>Text facet. A box will appear in the left panel showing that there are 7 unique entries in this column.- The format is text, which is the default, otherwise
Text facetwould not have displayed any entries. If you want to check the format, clickeditin a cell, and the data type will show the current format.- For the column
datedoFacet>Text facet. A box will appear in the left panel showing that there are 17 unique entries in this column.- By default, the column
dateis formatted as Text. You can change the format by doingEdit cells>Common transforms>To date. Notice that the values in the columns possible to transform to a correct date format turn green, and also add a timestamp after each date. DoingFacet>Timeline facetcreates a box in the left panel that shows a histogram of the number of entries for each date. If we do not want the timestamp in the date format, we can remove it, but more on that later.- Most of the samples (43) were registered for the date
2020-03-31. The four dates that couldn’t be transformed (7 April,31 March,32 Marchand33 March) are noted as Non-Time in the timeline histogram.
More on Facets
As well as ‘Text facets, ‘ OpenRefine also supports a range of other types of facets. These include:
- Numeric facets
- Timeline facets (for dates)
- Custom facets
- Scatterplot facets
Numeric and Scatterplot facets display graphs instead of lists of values. The numeric facet graph includes ‘drag and drop’ controls you can use to set a start and end range to filter the data displayed. These facets are explored further in Examining Numbers in OpenRefine
Custom facets are a range of different types of facets. Some of the default custom facets are:
- Word facet - this breaks down text into words and counts the number of records each word appears in
- Duplicates facet - this results in a binary facet of ‘true’ or ‘false’. Rows appear in the ‘true’ facet if the value in the selected column is an exact match for a value in the same column in another row
- Text length facet - creates a numeric facet based on the length (number of characters) of the text in each row for the selected column. This can be useful for spotting incorrect or unusual data in a field where specific lengths are expected (e.g. if the values are expected to be years, any row with a text length of more than 4 for that column is likely to be incorrect)
- Facet by blank - a binary facet of ‘true’ or ‘false’. Rows appear in the ‘true’ facet if they have no data present in that column. This is useful when looking for rows missing key data.
Using undo and redo
It’s common while exploring and cleaning a dataset to discover that, after you’ve made a change, you really should have done something else first. OpenRefine provides Undo and Redo operations to make this easy.
Exercise 1.2
- Click where it says
Undo / Redoon the left side of the screen. All the changes you have made so far are listed here.- Click on the step that you want to go back to, in this case, go back one step to before you had done the text-to-date transformation.
- Visually confirm that the date column now contains only the original dates, without timestamps.
- Notice that you can still click on the later steps to
Redothe actions. Redo the date transformation by clicking on this step.
Using clustering to detect possible typing errors
In OpenRefine, clustering means “finding groups of different values that might be alternative representations of the same thing”. For example, the two strings New York and new york are very likely to refer to the same concept and just have capitalization differences. Likewise, Gödel and Godel probably refer to the same person, as well as Turin and Torino most likely are synonyms of the same city but in different languages. Clustering is a very powerful tool for cleaning datasets which contain misspelt or mistyped entries. OpenRefine has several clustering algorithms built in. Experiment with them, and learn more about these algorithms and how they work.
- In the
sexText Facet we created in the step above, click theClusterbutton. If you removed the Facet, just generate it again. - In the resulting pop-up window, you can change the
Methodand theKeying Function. Try different combinations to see what different mergers of values are suggested. - Select the
key collisionmethod andmetaphone3keying function. It should identify four clusters. - Tick the
Merge?box beside each cluster, then clickMerge Selected and Re-clusterto apply the corrections to the dataset. - Try selecting different
MethodsandKeying Functionsagain, to see if new merges are suggested. - You should find that using the default settings, no more clusters are found. (Note that the
key collisionmethod withngram-fingerprintkeying function will suggest to mergeFandM, which is not desired.) - To merge the remaining values we would like to merge, we will hover over them in the
sextext facet, select edit, and manually change the names. In a previous lesson, we had identifiedmaleandfemaleas allowed values. ChangeMtomaleandFtofemale. The Text Facet on the left should now show 2 clusters corresponding to the allowed values.
Important: If you Merge using a different method or keying function, or more times than described in the instructions above,
your solutions for later exercises might not be the same as shown in those exercise solutions.
The technical details of how the different clustering algorithms work can be found at the link below.
Split
If data in a column needs to be split into multiple columns, and the parts are separated by a common separator (say a comma, or a space), you can use that separator to divide the pieces into their own columns.
- Let us suppose we want to split the
locationcolumn into separate columns for country, region, and city. - Click the down arrow at the top of the
locationcolumn. ChooseEdit Column>Split into several columns... - In the pop-up, in the
Separatorbox, make sure the separator is a comma. - Check the box that says
Remove this column. - Click
OK. You’ll get some new columns calledlocation 1,location 2, andlocation 3. - Note that the character on which the split is performed could be anything. The default is a comma, but you could make it any letter, number or special character. The only requirements are that it A) appears in every row of the column, and B) appears consistently in the place where you want the column to be split.
Exercise 1.3
Try to change the name of the column
location 1tolocation 2. Are you able to do this, or do you encounter a problem?Change the name of the first new column to
geographic location (country), the second togeographic location (region and locality), and the third togeographic location (city). Then change all occurrences of the city nameTurintoTorino.Solution
- On the
location 1column, click the down arrow and thenEdit column>Rename this column.- Type
geographic location (country)into the box that appears. If you type anything that is already used as a column name elsewhere, a pop-up will appear that saysAnother column already named [name]. Note that column names are case-sensitive. If you capitalize the initial (or any) letter, it will be recognized as a unique name. You should now have three new columns calledgeographic location (country),geographic location (region and locality), andgeographic location (city)- Hover the mouse over a cell in
geographic location (city)namedTurin. Notice theeditfunction becoming available. Click onedit, type inTorinoand selectApply to All Identical Cells. All occurrences ofTurinare now replaced withTorino. Also, notice there might be leading whitespaces in most of the names forgeographic location (city). We will deal with those in the next section.
Trim Leading and Trailing Whitespace
Words with spaces at the beginning or end are particularly hard for us humans to tell apart from strings without them, but blank characters will make a difference to the computer. We usually want to remove these. As of version 3.4 of OpenRefine, the option to trim leading and trailing whitespace is available when importing data (see the image at the top of this page).
If you unchecked that box when importing data, or if leading or trailing whitespaces were introduced while splitting columns, or other operations, OpenRefine also provides a tool to remove blank characters from the beginning and end of any entries that have them.
- In the
geographic location (city), there seem to be leading whitespaces in most columns. These are most likely an artefact of the splitting of the initial geographic column. - To remove the whitespace, choose
Edit cells>Common transforms>Trim leading and trailing whitespace. - You should now see one less category in your text facet, along with normalised names.
Manual input to correct incorrect values
Remember the conversion of date from text to date format? If we take a closer look, we notice some rather questionable cell values. First of all, we want to remove the timestamp from the dates. We do this by first transforming the cells to text, Edit cells > Common transforms > To text. Next we click edit in one of the cells and copy the expression T00:00:00Z. Finally, we select Edit cells > Replace, paste the expression into the Find: box, leave the box Replace with: blank, and click OK. By doing this, we now get all dates in the standard YYYY-MM-DD format.
Next, we take a look at the years, there are 2020, 2021 and 2022. However, the data stems from a study conducted during 2020. We can therefore safely assume that dates beginning with 2021 and 2022 are typos of 2020. Correct these via edit in the Text Facet in the left panel.
Last, we turn our attention to 7 April, 31 March, 32 March and 33 March. We lack information on the year, but knowing that the study is from 2020, we can safely edit the 7 April to the correct format YYYY-MM-DD. Doing so we arrive at 2020-04-07. For the remaining three dates, we can assume that the dates 32 March and 33 March are artefacts from the drag-to-copy function in Excel. Hence, use the edit function to change all three to 2020-03-31.
Exercise 1.4
Did you notice that some of the dates in the
datecolumn look eerily related? In the list we have both2020-04-01and >2020-01-04,2020-04-07and2020-07-04, and2020-04-08and2020-08-04. These might be correct, or they may be an artefact of when the data was entered, depending on the date format used.Discuss when this could happen in a dataset, and what practices we can use to avoid such problems, particularly in larger research groups where members from different parts of the world collaborate.
Solution
Before starting a project, make sure all collaborators have agreed to conform to a common standard. In particular, atypical date formats in spreadsheets can cause severe issues in downstream analyses.