class: center, middle, inverse, title-slide # Fun with Presentations ### Your Name ### 15/04/2022 --- # Bullet points - Point One - Point Two # Structure Below is an R chunk showing the structure. ```r data(iris) str(cars) ``` ``` ## 'data.frame': 50 obs. of 2 variables: ## $ speed: num 4 4 7 7 8 9 10 10 10 11 ... ## $ dist : num 2 10 4 22 16 10 18 26 34 17 ... ``` --- name: plots # Plots ```r plot(cars$speed,cars$dist) ``` 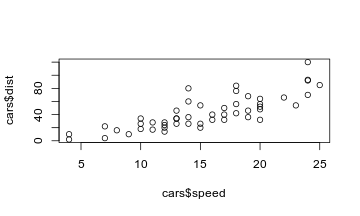<!-- --> --- name: table # Table Below is an R chunk showing a table. Below is a table. ```r head(cars) ``` ``` ## speed dist ## 1 4 2 ## 2 4 10 ## 3 7 4 ## 4 7 22 ## 5 8 16 ## 6 9 10 ``` Click [here](#plots) to go to plots. --- # Image ## Adding an Image The default usage does not work well because the image is too big. ``` 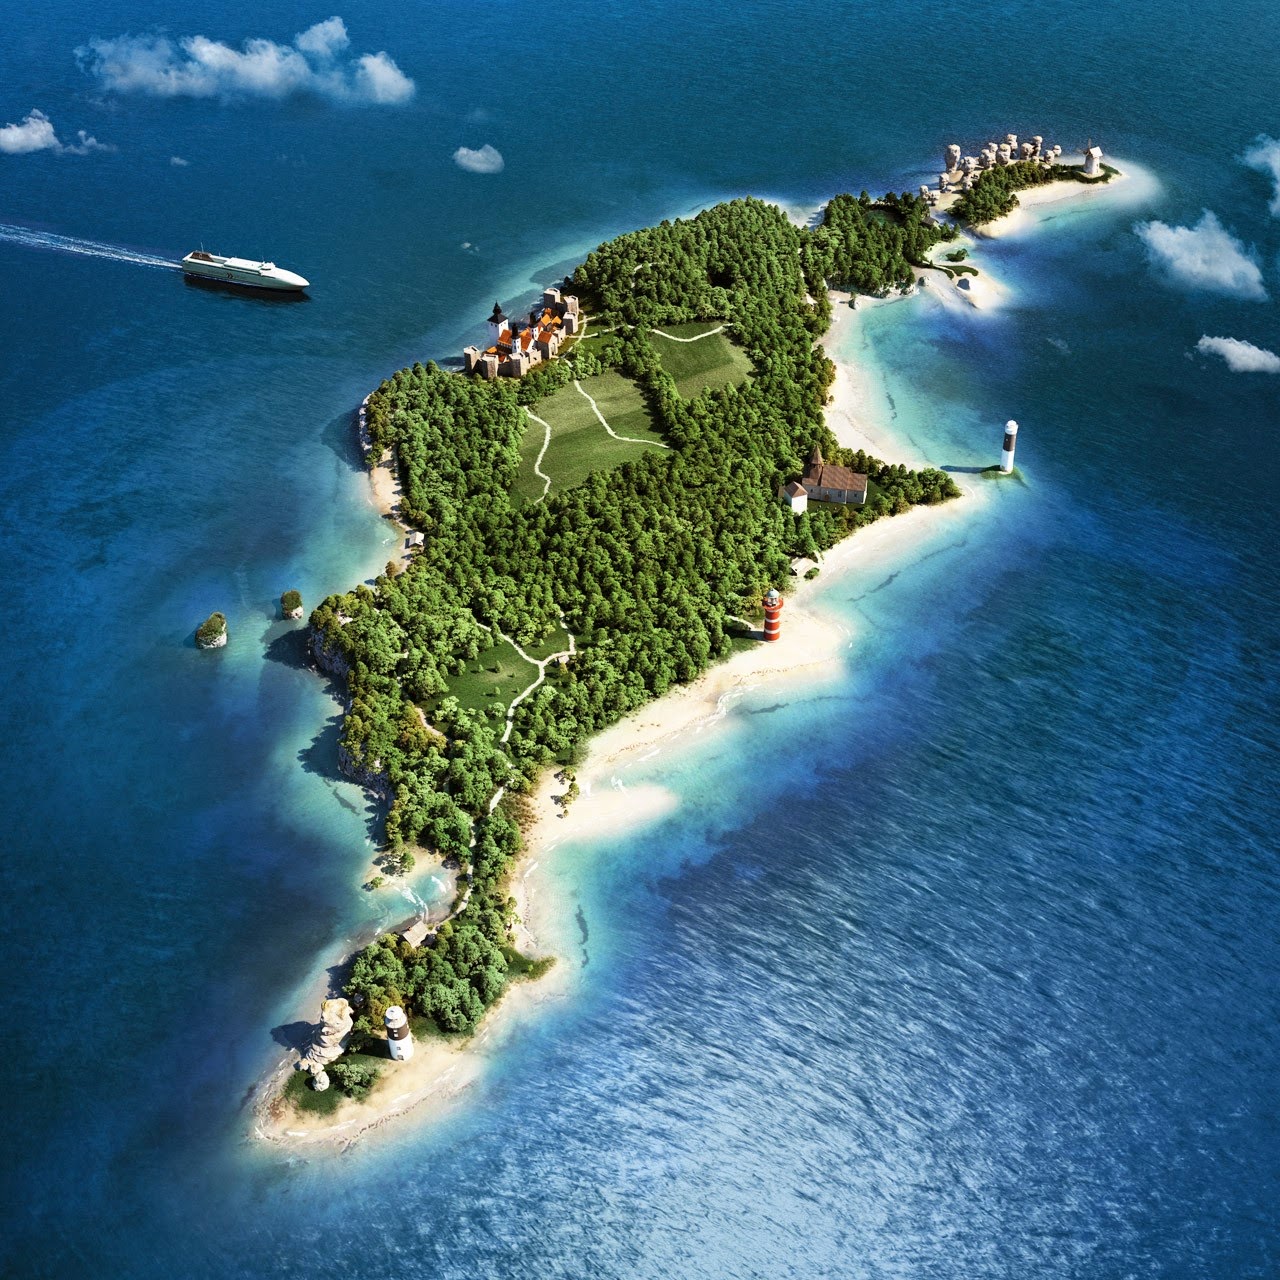 ``` So, we use HTML directly like this: ``` <img src="rr_lab_assets/gotland.jpg" width="250px"> ``` <img src="rr_lab_assets/gotland.jpg" width="250px"> --- name: Plot # Plot ```r ggplot(iris,aes(x=Petal.Length,Sepal.Width,col=Species))+ geom_point(size=2)+ labs(x="Petal Length",y="Sepal Width")+ scale_colour_manual(values=c("#000000","#E69F00","#56B4E9", "#009E73","#F0E442","#006699","#D55E00","#CC79A7"))+ {{theme_bw(base_size=12)}} ``` 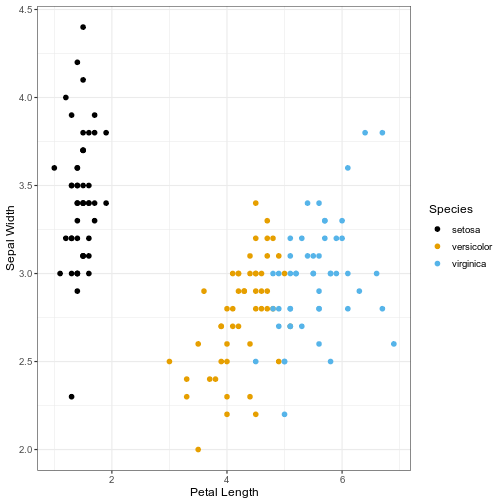<!-- --> --- name: math # Math `\(e^{i\pi} + 1 = 0\)` -- `$$\frac{E \times X^2 \prod I}{2+7} = 432$$` -- `$$\sum_{i=1}^n X_i$$` -- `$$\int_0^{2\pi} \sin x~dx$$` --- # Thank you