Fun with Presentations
Your Name
08/06/2019
Level 1 Heading
Level 2 Heading
Below is an R chunk showing the structure.
data(iris)
str(cars)
## 'data.frame': 50 obs. of 2 variables:
## $ speed: num 4 4 7 7 8 9 10 10 10 11 ...
## $ dist : num 2 10 4 22 16 10 18 26 34 17 ...Table
Below is an R chunk showing a table.
Below is a table.
head(cars)## speed dist
## 1 4 2
## 2 4 10
## 3 7 4
## 4 7 22
## 5 8 16
## 6 9 10Plots
Here is a basic R plot.
plot(cars$speed,cars$dist)This is a scatterplot.
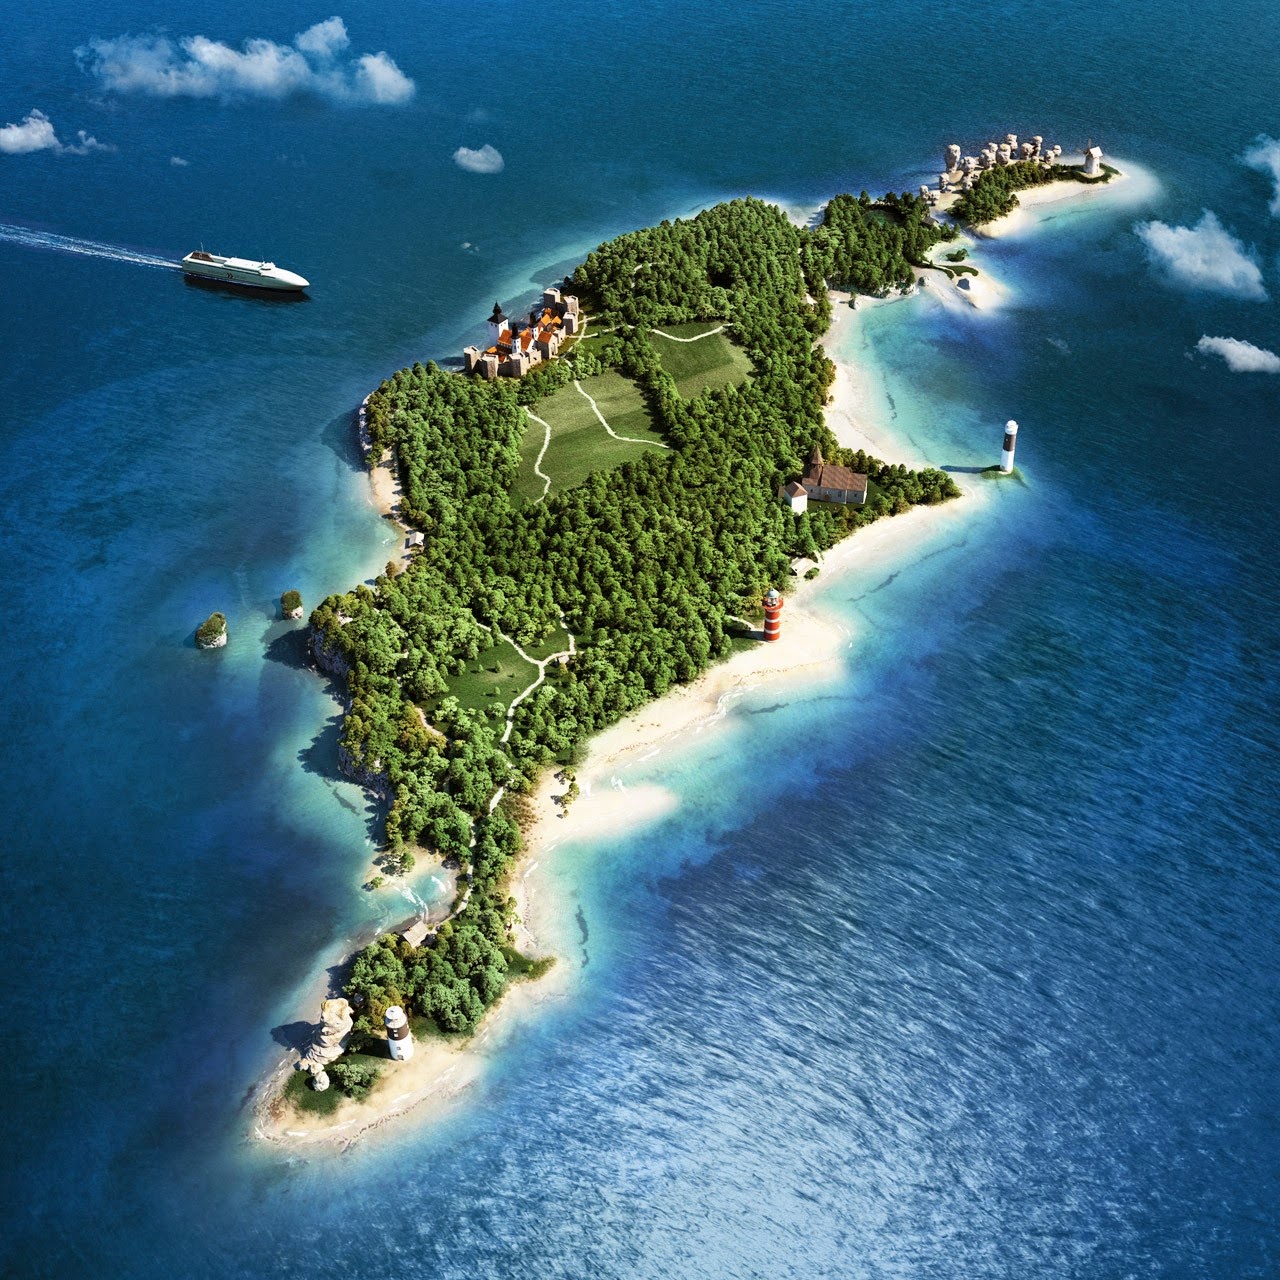
Image
Image
The default usage does not work well because the image is too big.
So, we use HTML directly like this:
<img src="rr_lab_assets/gotland.jpg" width="250px">