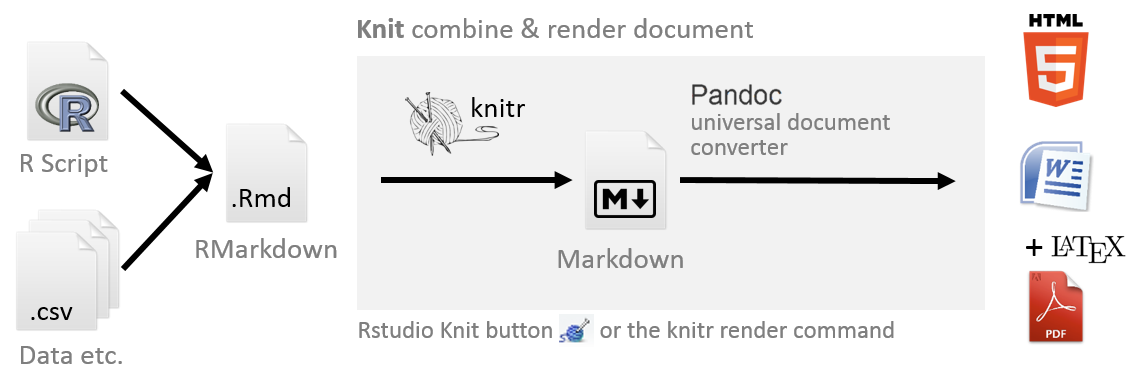
class: center, middle, inverse, title-slide # RaukR | Reproducible Research ## Advanced R for Bioinformatics. Visby, 2018. ### Roy Francis ### 10 June, 2018 --- name: intro class: spaced ## What's the fuss about? <img src="rr_presentation_assets/nature-reproducibility.jpg" class="fancyimage size-75"> .small[<https://www.nature.com/collections/prbfkwmwvz/>] <img src="rr_presentation_assets/nature-reproducibility-2.jpg" class="fancyimage size-75"> .small[<https://www.nature.com/news/1-500-scientists-lift-the-lid-on-reproducibility-1.19970>] ??? A large percentage of research is not reproducible by other researchers or by the original researchers themselves. This concern has been lately addressed by several high profile journals. --- <img src="rr_presentation_assets/nature-rr-pie.jpg" class="fancyimage size-50"> <img src="rr_presentation_assets/nature-rr-bar.jpg" class="fancyimage size-70"> --- <img src="rr_presentation_assets/zapsc.png" class="size-90"> .large["The difference between a scientist and a crazy person is that a scientist takes notes."] --- class: spaced ## Typical workflow .pull-left-60[ 1. Get data 2. Clean, transform data in spreadsheet 3. Copy-paste, copy-paste, copy-paste 4. Run analysis & export figures using A 5. Write up report using B 6. Import figures from A to B 7. Realises a sample was mislabelled 8. Go back to step 2, Repeat ] -- .pull-right-40[ <img src="rr_presentation_assets/picard.jpg" class="fancyimage"> ] ??? Manually handling workflow is hard to reproduce because it is hard to know the exact step carried out. A programmatic workflow allows full transparency to the exact steps followed. --- class: spaced ## Benefits of reproducibility - Rerunning workflow - Additional data/New data - Returning to a project - Transferring projects - Collaborative work - Easy to make changes - Eliminate copy-paste errors ??? A reproducible workflow allows a lot of convenience. - It's easy to automate re-running of analysis when earlier steps have changed such as new input data, code or assumptions. - Useful for an investigator returning to an analyses after a period of time. - Useful when a project is transferred to a new investigator. - Useful when working collaboratively. - When you are asked to modify or change a parameter. --- class: spaced ## Solutions  * Containerized computing environment. Eg: *Docker* * Workflow manager Eg: *Snakemake, Nextflow* * Package and environment manager. Eg: *Packrat, Conda* * Track edits and collaborate coding. Eg: *Git* * Share and track code. Eg: *GitHub* * Notebooks to document ongoing analyses. Eg: *Jupyter* * Analyse and generate reports. Eg: *R Markdown* ??? Reproducible projects can be performed at different levels. Reproducibility is the ability for a work to be reproduced by an independently working third-party. --- class: spaced ## Steps to reproducibility * Single document containing analysis, code and results * Self-contained portable project * Avoid manual steps * Results are directly linked to code used to generate them * Contexual narrative to why a certain step was performed * Version control of documents ??? Reproducible programming is not an R specific issue. R offers a set of tools and an environment that is conducive to reproducible research. --- ## Automate workflow * Install packages from repositories ``` install.packages(), devtools::install_github() ``` * Read data and scripts ``` read.delim(), source(), readr::read_tsv() ``` * Reorganise data ``` dplyr, tidyr ``` * Create figures ``` ggplot2 ``` * Run statistics ``` lm(), wilcox.test() ``` * Run external programs ``` system("./plink --file --flag1 --flag2 --out bla") ``` --- ## RStudio | IDE <img src="rr_presentation_assets/rstudio.jpg" class="fancyimage"> * Code completion * Syntax highlighting (for many languages) * R Notebook * Debugging * Useful GUI elements --- ## RStudio | Project .small[**Create a new project**] <img src="rr_presentation_assets/new-project.gif" class="fancyimage"> * Portable project (.Rproj) * Dynamic reports * Version control (git) * Package control (packrat) --- ## Project Structure ``` project_name/ +-- raw/ | +-- gene_counts.txt | +-- metadata.txt +-- results/ | +-- gene_filtered_counts.txt | +-- gene_vst_counts.txt +-- images/ | +-- exp-setup.jpg +-- scripts/ | +-- bash/ | | +-- fastqc.sh | | +-- trim_adapters.sh | | +-- mapping.sh | +-- r/ | +-- qc.R | +-- functions.R | +-- dge.R +-- report/ +-- report.Rmd ``` Organise data, scripts and results sensibly in the same project directory. Use relative links. ??? Try to organise all material related to a project in a common directory. Organise the directory in a sensible manner. Use relative links to refer to files. Consider raw as read-only content. --- ## RMarkdown | Intro ### Markdown - Plain text format for readability - Support pure HTML for complex formatting ### RMarkdown - Markdown + embedded R chunks - Combine text and code in one file --- ## RMarkdown | Guide .pull-left-50[ ``` ## Heading 2 ### Heading 3 #### Heading 4 _italic text_ __bold text__ `code text` - bullet point Link to [this](somewhere.com)  ``` ] .pull-right-50[ ## Heading 2 ### Heading 3 #### Heading 4 *italic text* **bold text** `code text` * bullet point Link to [this](somewhere.com)  ] R Markdown reference https://rmarkdown.rstudio.com/ --- ## RStudio | Notebook .small[**Create a new .Rmd document**] <img src="rr_presentation_assets/new-rmarkdown.gif" class="fancyimage"> * Text and code can be written together * Inline R output (text and figures) ??? R Notebook demonstration. --- ## RStudio | Report  - Rmd > md > docx|HTML|PDF - PDF needs Latex - Handouts - Scientific Articles - Presentations - beamer - ioslides - slidy - xaringan --- ## RStudio | Export - Simple websites - [Rmd](https://rmarkdown.rstudio.com/lesson-13.html) - Book - [bookdown](https://bookdown.org/yihui/bookdown/) - Package documentation - [pkgdown](http://pkgdown.r-lib.org/) - Complex websites - [blogdown](https://bookdown.org/yihui/blogdown/) - Dashboards - [flexdashboard](https://rmarkdown.rstudio.com/flexdashboard/) - Web applications - [Shiny](https://www.rstudio.com/products/shiny/) --- name: help class: spaced ## Acknowledgements * [**Reproducible Research in R and RStudio**](https://www.slideshare.net/SusanJohnston3/reproducible-research-in-r-and-r-studio) - Susan Johnston * [**New Tools for Reproducible Research with R**](https://slides.yihui.name/2012-knitr-RStudio.html) - JJ Allaire and Yihui Xie * [**Reproducible research with R**](http://www.hafro.is/~einarhj/education/tcrenv2016/pre/r-markdown.pdf) - Bjarki Thor Elvarsson and Einar Hjorleifsson * [**Reproducible Research Workshop**](http://www.geo.uzh.ch/microsite/reproducible_research/post/rr-r-publication/) - University of Zurich --- name: session ## Session .small[This presentation was created in RStudio using [`remarkjs`](https://github.com/gnab/remark) framework through R package [`xaringan`](https://github.com/yihui/xaringan).] ```r getS3method("print","sessionInfo")(sessionInfo()[-7]) ``` ``` ## R version 3.4.3 (2017-11-30) ## Platform: x86_64-w64-mingw32/x64 (64-bit) ## Running under: Windows >= 8 x64 (build 9200) ## ## Matrix products: default ## ## locale: ## [1] LC_COLLATE=English_United Kingdom.1252 ## [2] LC_CTYPE=English_United Kingdom.1252 ## [3] LC_MONETARY=English_United Kingdom.1252 ## [4] LC_NUMERIC=C ## [5] LC_TIME=English_United Kingdom.1252 ## ## attached base packages: ## [1] stats graphics grDevices utils datasets methods base ## ## other attached packages: ## [1] gridExtra_2.3 kableExtra_0.7.0 forcats_0.3.0 stringr_1.3.0 ## [5] dplyr_0.7.4 purrr_0.2.4 readr_1.1.1 tidyr_0.8.1 ## [9] tibble_1.4.2 ggplot2_2.2.1 tidyverse_1.2.1 captioner_2.2.3 ## [13] bookdown_0.7 knitr_1.20 ``` --- name: end-slide class: end-slide # Thank you